For an economist, it’s always a joy to have a vast history of data on a certain subject to study. Such is the case for Canadian housing starts at the national, provincial and even city levels.
Today’s article looks at annual new home groundbreakings, as calculated and published by Canada Mortgage and Housing Corporation (CMHC), in ten of the nation’s most important housing markets. The numbers go back more than 50 years.
The ten cities being showcased have been chosen not only for their size, but also because they provide wide geographical representation across the country. (Three other major markets that have not been included are Hamilton, London and Victoria.)
For each of the 10 cities, Table 1 sets out 50-year averages, latest-10-year averages and 2018 annual levels. Further down in this article, there are also graphs for all 10 cities, with bullet points underneath. Especially interesting in the bullet points, and highlighted in bold, are peak levels of starts for each city and when they occurred.
Table 1: Annual Housing Starts in Major Canadian Cities
| Latest | 10-Yr Avg vs | 2018 versus | ||||||
| Ranking by | 50-Year | 10-Year | 50-Yr Avg | Latest | ||||
| 2018 Annual Starts Level | Average | Average | % Change | 2018 | 10-Yr Avg | |||
| 1 | Toronto | 31,440 | 36,663 | 16.6% | 41,107 | 12.1% | ||
| 2 | Montreal | 20,439 | 20,520 | 0.4% | 25,000 | 21.8% | ||
| 3 | Vancouver | 16,274 | 19,674 | 20.9% | 23,404 | 19.0% | ||
| 4 | Calgary | 9,575 | 11,221 | 17.2% | 10,971 | -2.2% | ||
| 5 | Edmonton | 8,786 | 11,557 | 31.5% | 10,038 | -13.1% | ||
| 6 | Ottawa-Gatineau | 8,188 | 8,368 | 2.2% | 9,468 | 13.1% | ||
| 7 | Winnipeg | 3,883 | 4,109 | 5.8% | 5,384 | 31.0% | ||
| 8 | Quebec City | 5,167 | 5,536 | 7.1% | 5,355 | -3.3% | ||
| 9 | Kitchener-Waterloo | 3,077 | 3,105 | 0.9% | 3,103 | -0.1% | ||
| 10 | Halifax | 2,575 | 2,455 | -4.7% | 2,871 | 16.9% | ||
| 1st-Place Toronto vs | ||||||||
| 2nd-Place Montreal: | +54% | +79% | +64% | |||||
Data source: Canada Mortgage & Housing Corporation (CMHC)
Table: ConstructConnect.
Ottawa-Gatineau (1973), Halifax (1977), Winnipeg (1978) and Edmonton (1978) had their annual peaks the longest stretch of time ago, although Edmonton managed an almost dual summit in 2015, falling short by a statistically insignificant 15 units.
The city to score its all-time highest number most recently has been Vancouver, in 2016.
Something I find fascinating is that in most of the 10 cities, their latest-10-year-averages aren’t much higher than their 50-year averages. In Montreal, Ottawa-Gatineau and Kitchener-Waterloo, the difference lies between 0.0% and +2.5%; in Winnipeg and Quebec City, between +5.5% and +7.5%. Halifax is the only urban center with a modest decline from 50-year average to latest-10-year average, -4.7%.
There have, however, been sizable upwards jumps between 50-year averages and latest-10-year averages in four cities: Edmonton, +31.5%; Vancouver, +20.9%; Calgary, +17.2%; and Toronto, +16.6%.
For much of the past two decades, interprovincial population movement in Canada has been towards the West. There have also been big residency gains in Alberta and British Columbia due to immigration.
More recently, Ontario has been the major destination point for both foreign and domestic migration. The long-term housing starts trend lines in the 10 graphs have their strongest vertical tilts, from lower left to upper right, in Toronto, Edmonton, Calgary and Vancouver.
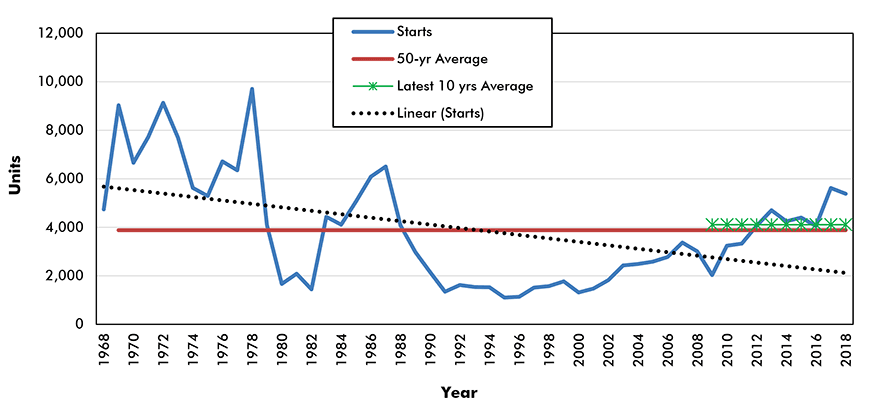
Winnipeg is the city with the most clearly apparent downwards-sloping trend line. But the linear trend line doesn’t pay enough attention to the way in which Winnipeg’s new homes construction has been quietly but convincingly advancing since 2000. (Also, notice from the far-right column in Table 1 that Winnipeg led the ten cites for 2018 level versus latest-10-year average, +31.0%.)
Another tidbit that emerges from Table 1 is how closely home starts in Calgary and Edmonton have tracked each other, whether measured as 50-year averages, latest-10-year averages or 2018 levels. The difference in all three instances is not more than 900 units.
Toronto is the All-Star in the Line-Up:
Finally, there is the matter of just how dominant Toronto is on the Canadian urban housing market scene. The bottom line in Table 1 shows Toronto’s first-place number relative to Montreal’s second-place figure according the three metrics.
With respect to their 50-year averages, Toronto (+54%) is more than half again higher than Montreal. As for latest-10-year-averages, Toronto’s advantage (+79%) is beyond three-quarters as great. And in 2018, Toronto’s positive gap with Montreal was +64%.
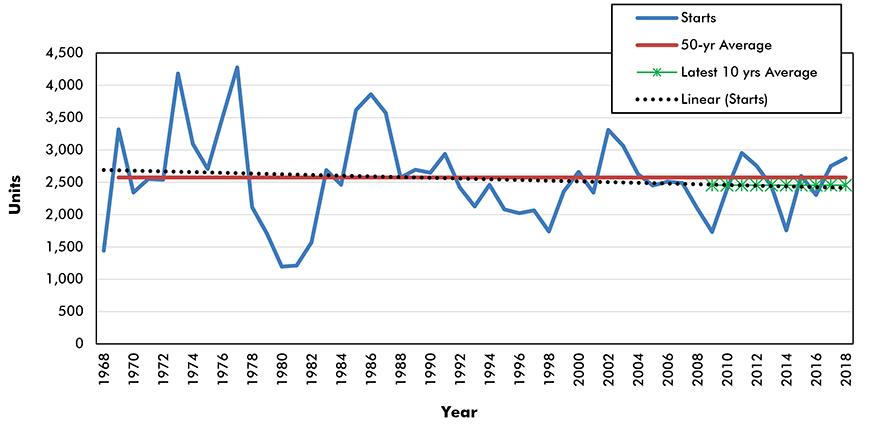
Graph 1: Halifax Housing Starts
Data source: CMHC and Statistics Canada (Table 34-10-0134-01).
Chart: ConstructConnect.
- 50-year average = 2,575 units;
- Latest 10-year average = 2,455 units;
- All-time peak = 4,277 units in 1977;
- 2018 = 2,871 units, +4.3% y/y;
- Linear trend line is flat.
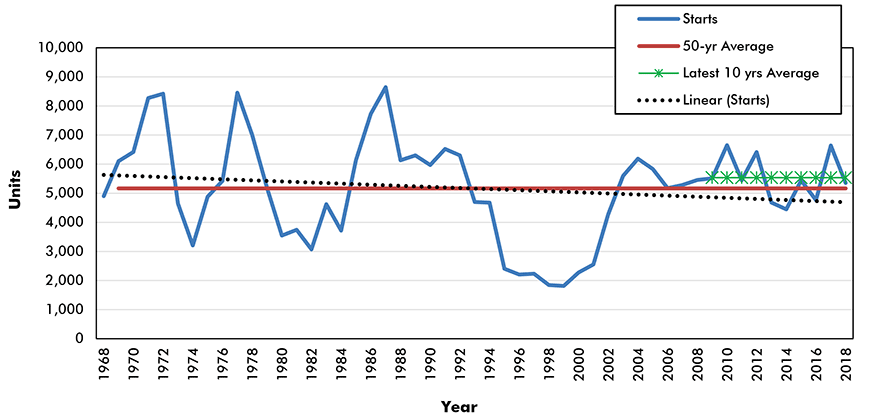
Graph 2: Quebec City Housing Starts
Data source: CMHC and Statistics Canada (Table 34-10-0134-01).
Chart: ConstructConnect.
- 50-year average = 5,167 units;
- Latest 10-year average = 5,536 units;
- All-time peak = 8,646 units in 1987;
- 2018 = 5,355 units, -19.4% y/y;
- Linear trend line is mildly descending.
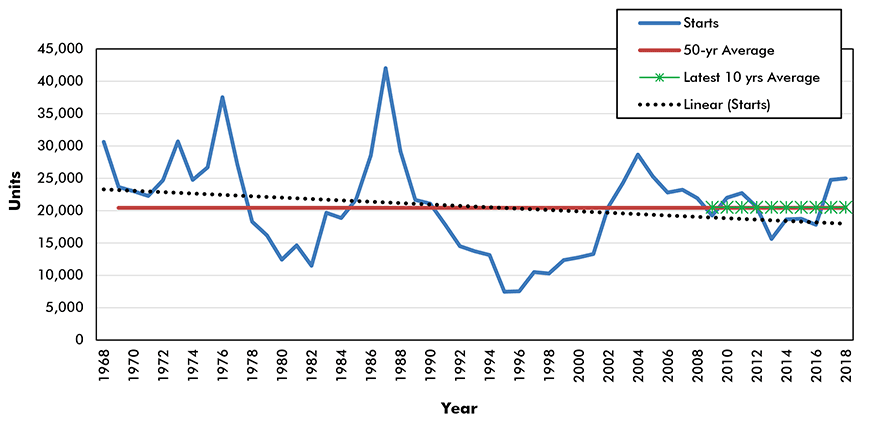
Graph 3: Montreal Housing Starts
Data source: CMHC and Statistics Canada (Table 34-10-0134-01).
Chart: ConstructConnect.
- 50-year average = 20,439 units;
- Latest 10-year average = 20,520 units;
- All-time peak = 42,024 units in 1987;
- 2018 = 25,000 units, +1.0% y/y;
- Linear trend line is mildly descending.
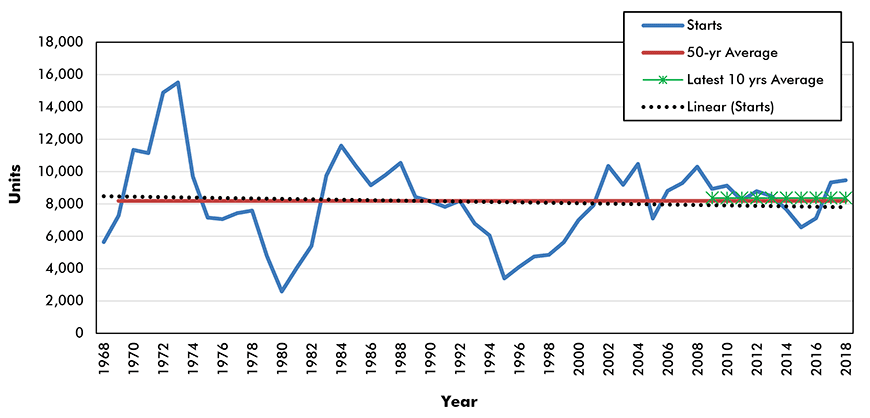
Graph 4: Ottawa-Gatineau Housing Starts
Data source: CMHC and Statistics Canada (Table 34-10-0134-01).
Chart: ConstructConnect.
- 50-year average = 8,188 units;
- Latest 10-year average = 8,368 units;
- All-time peak = 15,511 units in 1973;
- 2018 = 9,468 units, +1.5% y/y;
- Linear trend line is flat.
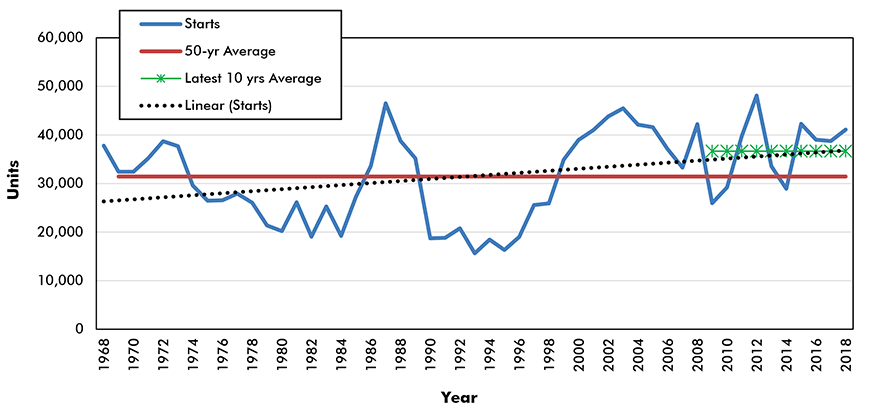
Graph 5: Toronto Housing Starts
Data source: CMHC and Statistics Canada (Table 34-10-0134-01).
Chart: ConstructConnect.
- 50-year average = 31,440 units;
- Latest 10-year average = 36,663 units;
- All-time peak = 48,105 units in 2012;
- 2018 = 41,107 units, +6.1% y/y;
- Linear trend line is ascending.
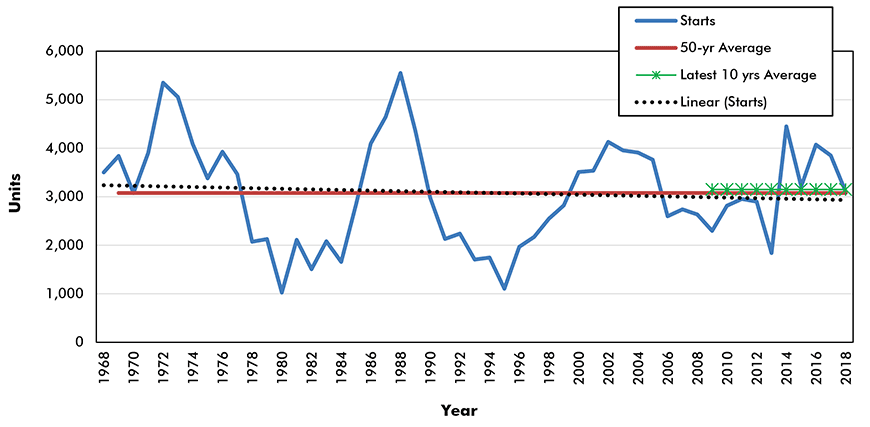
Graph 6: Kitchener-Waterloo Housing Starts
Data source: CMHC and Statistics Canada (Table 34-10-0134-01).
Chart: ConstructConnect.
- 50-year average = 3,077 units;
- Latest 10-year average = 3,105 units;
- All-time peak = 5,550 units in 1988;
- 2018 = 3,103 units, -19.4% y/y;
- Linear trend line is flat.
Graph 7: Winnipeg Housing Starts
Data source: CMHC and Statistics Canada (Table 34-10-0134-01).
Chart: ConstructConnect.
- 50-year average = 3,883 units;
- Latest 10-year average = 4,109 units;
- All-time peak = 9,706 units in 1978;
- 2018 = 5,384 units, -4.2% y/y;
- Linear trend line declining long-term but may soon reverse course.
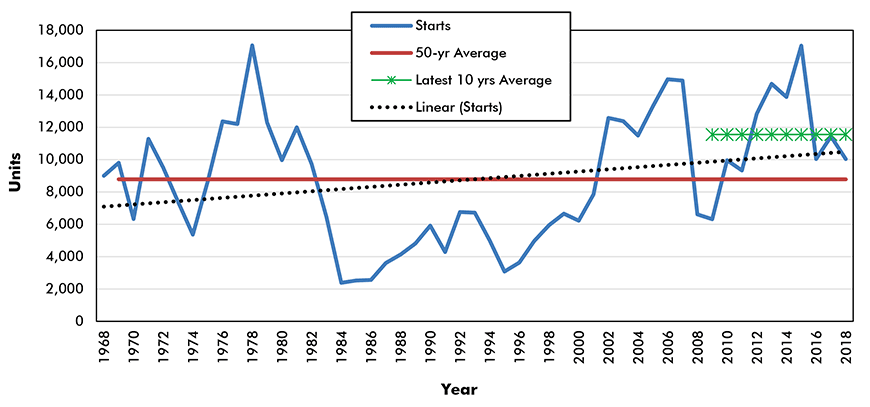
Graph 8: Edmonton Housing Starts
Data source: CMHC and Statistics Canada (Table 34-10-0134-01).
Chart: ConstructConnect.
- 50-year average = 8,786 units;
- Latest 10-year average = 11,557 units;
- All-time peak = 17,065 units in 1978;
- 2018 = 10,038 units, -12.2% y/y;
- Linear trend line is sharply ascending.
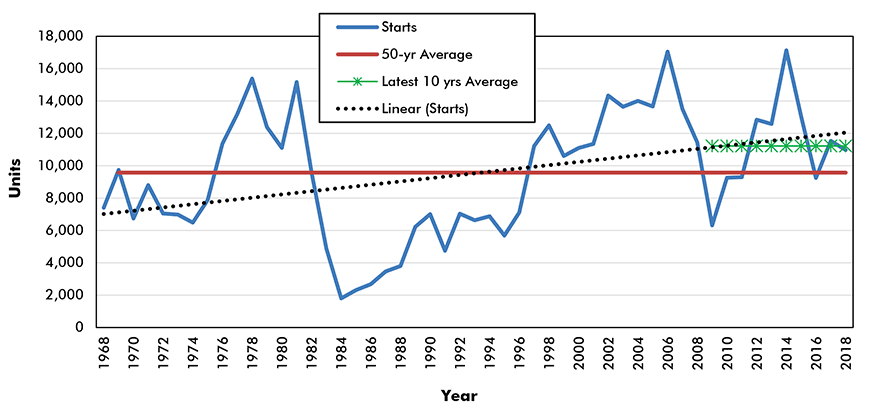
Graph 9: Calgary Housing Starts
Data source: CMHC and Statistics Canada (Table 34-10-0134-01).
Chart: ConstructConnect.
- 50-year average = 9,575 units;
- Latest 10-year average = 11,221 units;
- All-time peak = 17,131 units in 2014;
- 2018 = 10,971 units, -4.9% y/y;
- Linear trend line is sharply ascending.
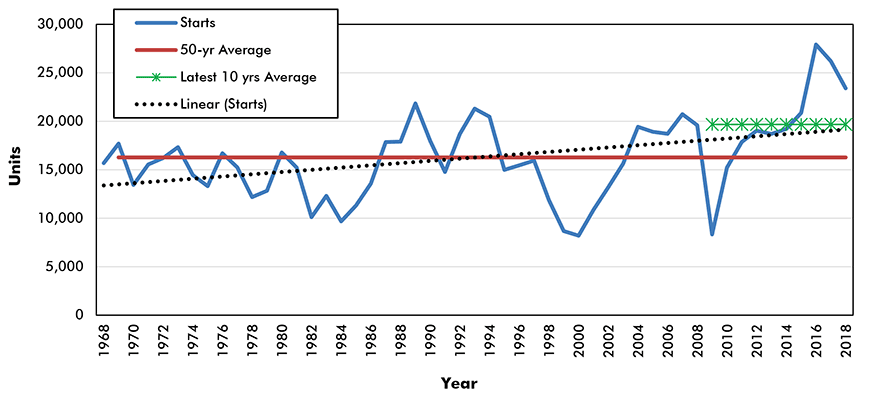
Graph 10: Vancouver Housing Starts
Data source: CMHC and Statistics Canada (Table 34-10-0134-01).
Chart: ConstructConnect.
- 50-year average = 16,274 units;
- Latest 10-year average = 19,674 units;
- All-time peak = 27,914 units in 2016;
- 2018 = 23,404 units, -10.7% y/y;
- Linear trend line is ascending.





Recent Comments