
There are 51 metropolitan statistical areas (MSAs) in the United States with population levels above one million. Drawing from ConstructConnect’s data pool for those 51 cities, Table 1 ranks the Top 25 markets in America for educational facility construction starts last year. (Map 1 showcases the Top 20.)

Leading all cities last year was Washington, D.C., with groundbreakings on hospitals, clinics, nursing and seniors’ homes combined valued at $1.3 billion. Next in line were Cleveland ($1.1 billion), Phoenix ($883 million), Cincinnati ($858 million), Pittsburgh ($740 million), Atlanta and Orlando (tied at $736 million), Tampa-St. Petersburg ($718 million); and Houston ($708 million).
Notice the presence of a pair of cities in Ohio – i.e., Cleveland and Cincinnati – only a rung or two short of the summit in the dollar-volume listing.
The ranking-positions of the nation’s biggest-population urban areas other than Houston for 2018 were: New York in 11th spot ($627 million); Los Angeles in 16th ($526 million); and Chicago in 18th ($483 million).
There were surprisingly far-down placements – i.e., not appearing among the Top 25 − for some of the nation’s major cities that have otherwise garnered attention for their rapid population increases or their well-regarded economic prosperity.
Included in such a grouping, noteworthy for lackluster medical facility starts in 2018, are: Austin, TX, in position number 36; Nashville, TN, 39; Jacksonville, FL, 44; San Antonio, TX, 45; San Diego, CA, 51; San Francisco-Oakland, CA, 57; Riverside, CA, 65; and San Jose, CA, 77.
There are an inordinate number of cities in California appearing in the tally of U.S. urban areas with relatively weak dollar volumes of medical facility starts in 2018.
By the way, in the City by the Bay, the dollar volume of medical facility starts in 2018 was almost exactly split 50-50 between San Francisco and Oakland.
Table 1 features only cities of a million or more each. If smaller cities of less than a million residents were included in the ranking, five would have made it into the Top 25.
Those five less-populous urban areas with exceptional levels of medical facility starts in 2018 were: Lansing, MI, $452.7 million; Fresno, CA, $397.5 million; Bloomington, Indiana, $393.4 million; Rochester, NY, $373.2 million; and Durham, NC, $360.9 million.
Map 1: Top 20 – Ranking of Major U.S. Cities by Total Value of Medical Facility Construction Starts: 2018 (in $ billions)
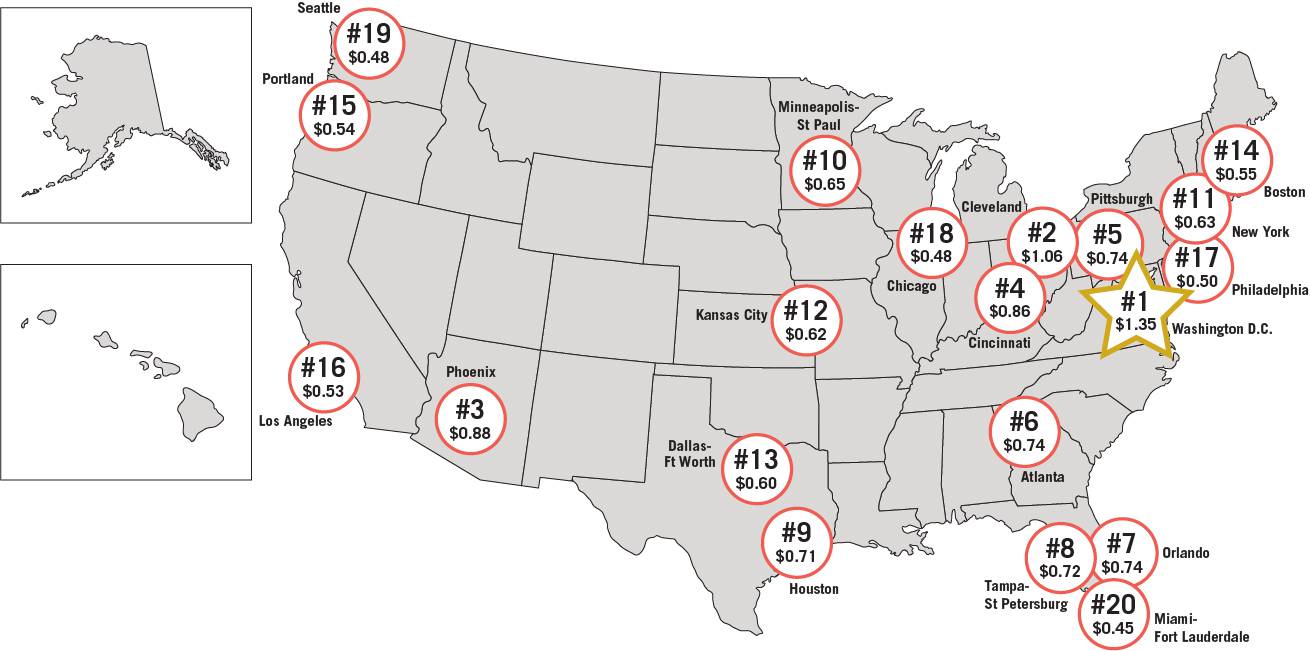
Table 1: Medical Facility Construction Starts
Top 25 Markets among Biggest U.S. Cities* – 2018
| Rank by | ||||||
| 2018 | 2017 | 2018 | % Change | |||
| $ Value | City / MSA | ($ billions) | 2018/2017 | |||
| 1 | Washington, DC-VA-MD-WV | $1.546 | $1.349 | -12.7% | ||
| 2 | Cleveland, OH | $0.146 | $1.057 | 624.6% | ||
| 3 | Phoenix, AZ | $0.652 | $0.883 | 35.4% | ||
| 4 | Cincinnati, OH-KY-IN | $0.291 | $0.858 | 195.2% | ||
| 5 | Pittsburgh, PA | $0.101 | $0.740 | 628.9% | ||
| 6 | Atlanta, GA | $0.738 | $0.736 | -0.3% | ||
| 7 | Orlando, FL | $0.994 | $0.736 | -25.9% | ||
| 8 | Tampa-St Petersburg, FL | $0.231 | $0.718 | 210.5% | ||
| 9 | Houston, TX | $0.729 | $0.708 | -2.9% | ||
| 10 | Minneapolis-St Paul, MN-WI | $0.375 | $0.650 | 73.5% | ||
| 11 | New York, NY-NJ | $0.998 | $0.627 | -37.2% | ||
| 12 | Kansas City, MO-KS | $0.431 | $0.624 | 44.9% | ||
| 13 | Dallas-Ft Worth, TX | $0.832 | $0.597 | -28.2% | ||
| 14 | Boston, MA | $0.770 | $0.550 | -28.6% | ||
| 15 | Portland, OR-WA | $0.034 | $0.537 | 1485.2% | ||
| 16 | Los Angeles, CA | $0.259 | $0.526 | 103.0% | ||
| 17 | Philadelphia, PA | $0.577 | $0.499 | -13.5% | ||
| 18 | Chicago, IL | $0.535 | $0.483 | -9.6% | ||
| 19 | Seattle, WA | $0.425 | $0.481 | 13.1% | ||
| 20 | Miami-Fort Lauderdale, FL | $0.730 | $0.449 | -38.4% | ||
| 21 | Richmond, VA | $0.388 | $0.443 | 14.2% | ||
| 22 | Denver, CO | $0.710 | $0.442 | -37.7% | ||
| 23 | Portland, OR-WA | $0.294 | $0.394 | 33.8% | ||
| 24 | Indianapolis, IN | $0.289 | $0.304 | 5.3% | ||
| 25 | Louisville, KY-IN | $0.226 | $0.297 | 31.3% | ||


Recent Comments
comments for this post are closed