Issuance of year-end data on U.S. new homebuilding activity was delayed due to the partial government shutdown which kept Census Bureau workers away from their desks.
Over the past month, however, there have been diligent catch-up efforts and December’s preliminary residential ‘starts’ and ‘permits’ numbers are now available.
There are ‘starts’ at the national level; but for states and cities, the figures are based on building permits.
This article will mainly concentrate on new home groundbreakings in America’s largest metropolitan statistical areas (MSAs). ‘Permits’ in units will be accepted as equivalent to ‘starts’.
‘Permits’ are first published by the Census Bureau, then repackaged in a more user-friendly form by the National Association of Home Builders (NAHB).
When Canadian statistics are mentioned, they have been made available by Canada Mortgage and Housing Corporation (CMHC) and they are ‘starts’.
Highlights:
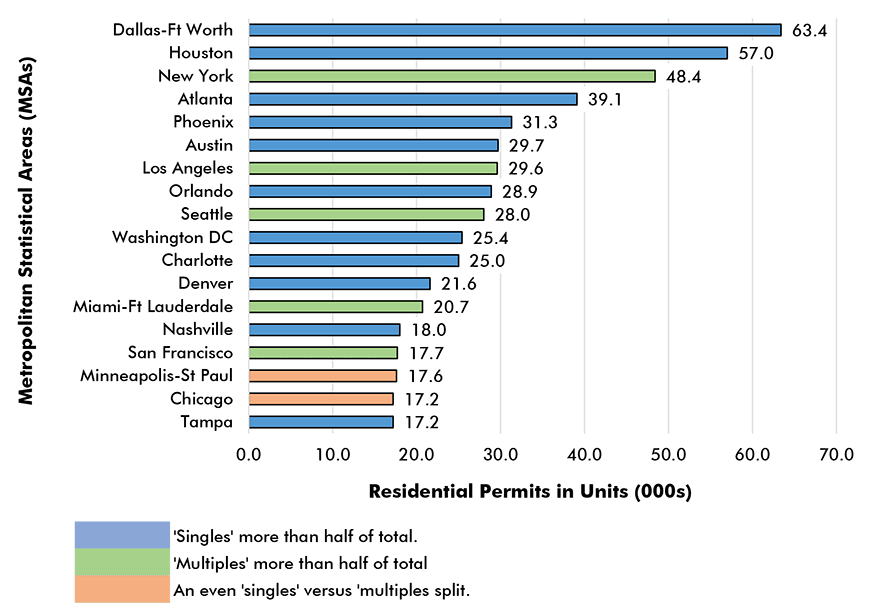
- The two strongest urban markets for laying new residential foundations in 2018 were both in Texas: Dallas-Ft Worth, at 63,400 units, and Houston, at 57,000 units. New York City (48,400 units) was a distant third. Houston’s 2018 starts were boosted by replacement projects in the aftermath of the devastation caused by Hurricane Harvey in late-August and early-September of 2017.
Ranking of Top 18 U.S. Cities for 2018 Housing Starts
Data source: Census Bureau and National Association of Home Builders (NAHB).
Chart: ConstructConnect.
- After the three frontrunners, the next ten largest MSA homebuilding markets in the U.S. in 2018 were: Atlanta (39,100 units); Phoenix (31,300); Austin (29,700); Los Angeles (29,600); Orlando (28,900); Seattle (28,000); Washington D.C. (25,400); Charlotte (25,000); Denver (21,600); and Miami (20,700).
- 2018 housing starts in Canada’s biggest-population cities were: Toronto, 41,100 units; Montreal, 25,000; and Vancouver, 23,400. In a joint-U.S.-Canada ranking for 2018, Toronto would place 4th and Montreal 12th.
- Relative to their annual levels since 2000, three U.S. MSAs reached new peaks in 2018 − Dallas-Ft Worth, Austin and Seattle. Charlotte’s 2018 total permits tied with 2006’s previous ‘best’ benchmark.
- Nashville in 2018 (18,000 units) was only slightly down from an exceptional level of residential permits (19,300) in 2017. San Francisco, which did not make it into the elite tier of cities for total starts, managed a milestone nonetheless, soaring to 17,700 units.
- There were four MSAs with populations of a million or more each where total residential permits in 2018 were unbelievably low, less than 2,000 units in each instance: Buffalo, Hartford, Pittsburgh and Providence. In a range of only 2,000 to 4,000 units were: Rochester, Cleveland, Birmingham, Milwaukee and New Orleans.
Condo and Apartment Towers:
- Of interest to developers will be the performances of multi-unit starts in the major cities of the U.S. and Canada last year. In America, New York was the standout for multi-unit residential permits in 2018, at 37,800 units. While that’s an impressive number, it falls way short (i.e., by half) of the city’s ‘gold standard’ level of 75,700 units in 2015.
- Next in line for multi-unit initiations in the U.S. in 2018 were: Dallas-Ft Worth (27,200 units); Los Angeles (19,600); Seattle (19,000); and Houston (16,900). Also, there were six MSAs with overall multi-unit structures that ranged from 12,000 to 14,000 units − Miami, San Francisco, Atlanta, Austin, Orlando and Washington D.C.
- Some of Canada’s cities have a history of embracing multi-unit starts earlier and with more relish than their American counterparts. In 2018, there were 34,700 multi-unit starts in Toronto; 22,500 in Montreal; and 18,800 in Vancouver. For U.S.-Canada combined in 2018, the ranking of multi-unit starts would be N.Y. in 1st place; Toronto 2nd; Dallas-Ft Worth 3rd; Montreal 4th; Los Angeles 5th; Seattle 6th; and Vancouver 7th.
- Just as in Canada, however, a trend away from single-family residential construction in favor of multi-family projects has become evident in many major U.S. urban centers. In 2018, there were seven U.S. MSAs in which the proportion of ‘multis’ to total unit permits was greater than 60%: New York (78.1%); San Francisco (76.8%); Seattle (67.9%); Los Angeles and Miami (both 66.2%); Boston (65.7%); and San Diego (64.3%).
- A clear dichotomy has emerged in U.S. urban residential construction markets. There are still quite a few major cities where single-family construction remains dominant. In 2018 in Detroit, Tampa, Las Vegas, Riverside, Phoenix, San Antonio, St Louis and Houston, ‘singles’ were 70% or more of total residential permits. In the first three of those cities, – Detroit, Tampa and Las Vegas, − ‘singles’ made up more than 80% of the total.
States and Provinces:
- The Lone Star State racked up an enormous number of residential building permits in 2018, 188,200 units (+11% versus 2017). Texas accounted for about one-seventh of the national figure of 1.3 million.
- In 2018, residential permits in Texas alone were only a little behind the ‘starts’ figure for all of Canada (212,800 units).
- In second and third places for residential permits among states in 2018 were Florida (142,300 units) and California (117,100). Within Florida, Orlando (28,900) beat Miami (20,700), Tampa (17,200) and Jacksonville (15,500). Within California, L.A. (29,600) was followed, in sequence, by San Francisco (17,700) and Riverside (14,600).
- Fourth spot among the states in 2018 was claimed by North Carolina (68,400 units), with Georgia (57,900), Washington State (47,400), Colorado (45,500) and Arizona (41,200) lined up behind it. New York (37,400) was well down the list.
- The positioning among Canadian provinces last year was Ontario as leader, at 78,600 units, with Quebec next, at 46,900. B.C. in 3rd spot was another step back, 40,900 units.
Dallas-Fort Worth-Arlington Residential Building Permits
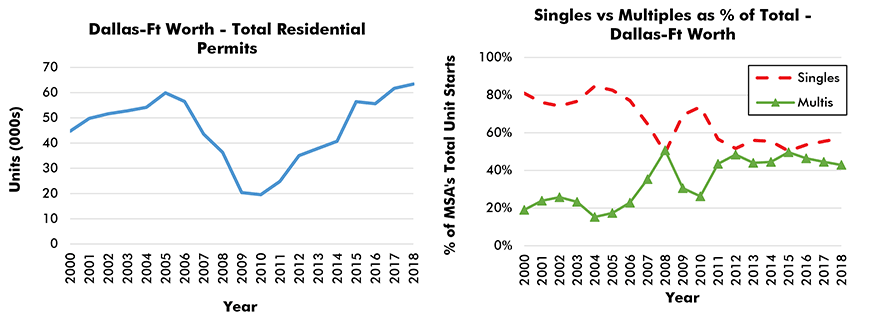
‘Residential permit’ numbers serve as a proxy for ‘housing starts’.
Data source: Census Bureau and National Association of Home Builders (NAHB).
Charts: ConstructConnect.
Houston-The Woodlands-Sugar Land Residential Building Permits
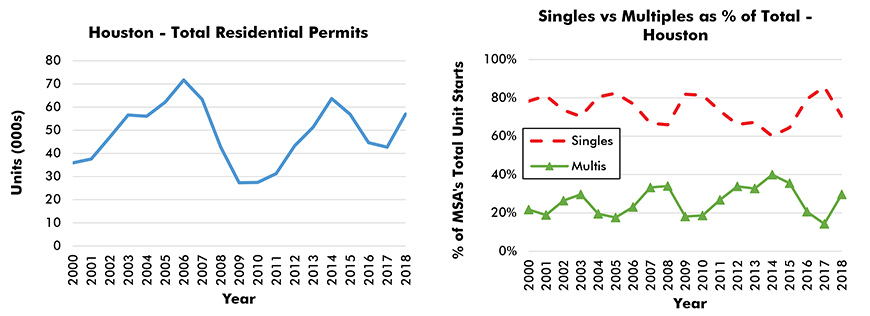
‘Residential permit’ numbers serve as a proxy for ‘housing starts’.
Data source: Census Bureau and National Association of Home Builders (NAHB).
Charts: ConstructConnect.
New York-Newark-Jersey City Residential Building Permits
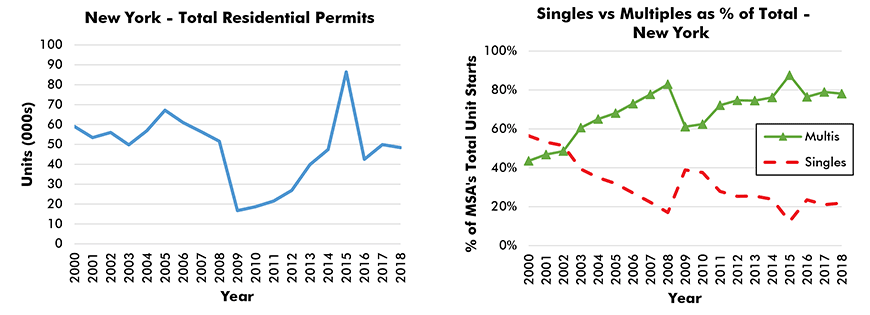
‘Residential permit’ numbers serve as a proxy for ‘housing starts’.
Data source: Census Bureau and National Association of Home Builders (NAHB).
Charts: ConstructConnect.
Atlanta-Sandy Springs-Roswell Residential Building Permits
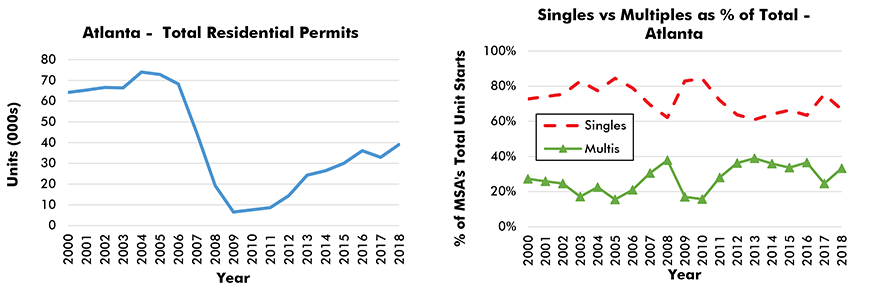
‘Residential permit’ numbers serve as a proxy for ‘housing starts’.
Data source: Census Bureau and National Association of Home Builders (NAHB).
Charts: ConstructConnect.
Phoenix-Mesa-Scottsdale Residential Building Permits
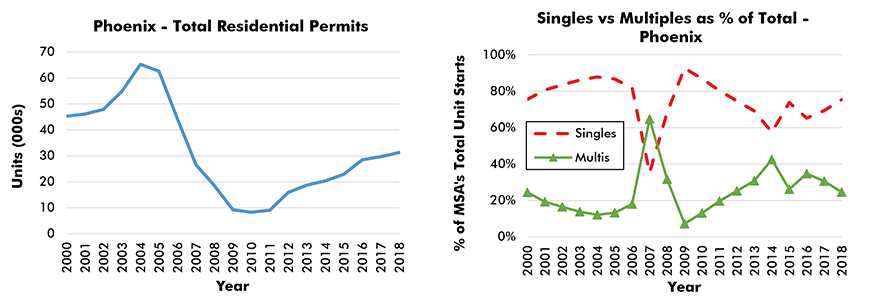
‘Residential permit’ numbers serve as a proxy for ‘housing starts’.
Data source: Census Bureau and National Association of Home Builders (NAHB).
Charts: ConstructConnect.
Austin-San Marcos Residential Building Permits
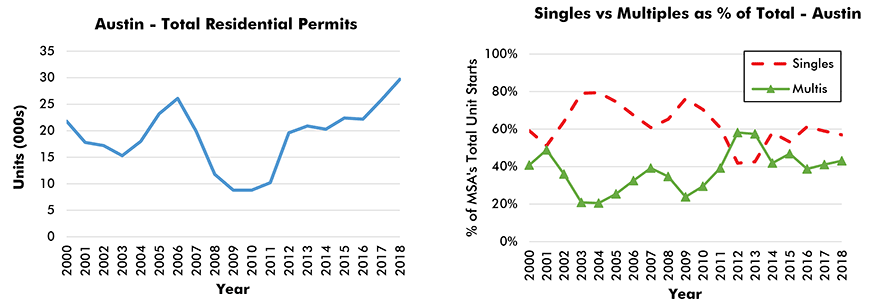
‘Residential permit’ numbers serve as a proxy for ‘housing starts’.
Data source: Census Bureau and National Association of Home Builders (NAHB).
Charts: ConstructConnect.
Los Angeles-Long Beach-Anaheim Residential Building Permits
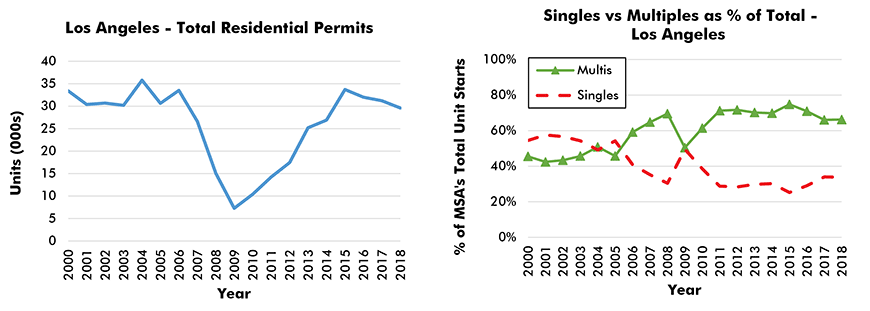
‘Residential permit’ numbers serve as a proxy for ‘housing starts’.
Data source: Census Bureau and National Association of Home Builders (NAHB).
Charts: ConstructConnect.
Orlando-Kissimmee-Sanford Residential Building Permits
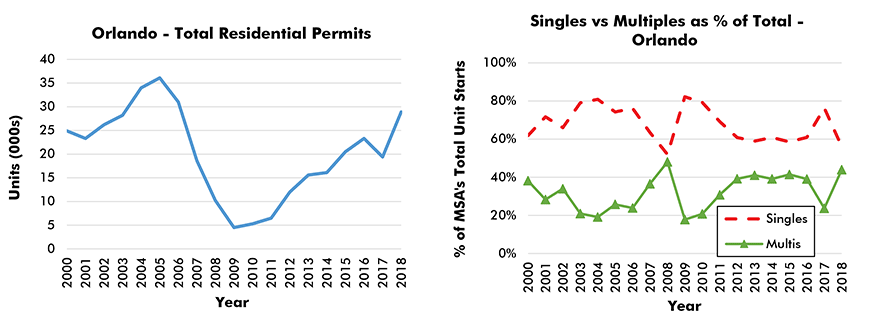
‘Residential permit’ numbers serve as a proxy for ‘housing starts’.
Data source: Census Bureau and National Association of Home Builders (NAHB).
Charts: ConstructConnect.
Seattle-Tacoma-Bellevue Residential Building Permits
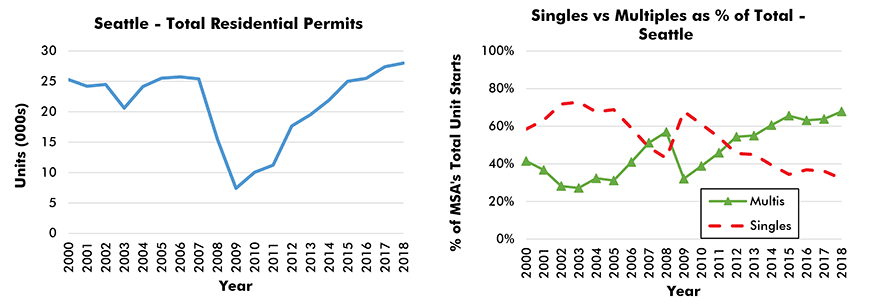
‘Residential permit’ numbers serve as a proxy for ‘housing starts’.
Data source: Census Bureau and National Association of Home Builders (NAHB).
Charts: ConstructConnect.
Washington-Arlington-Alexandria Residential Building Permits
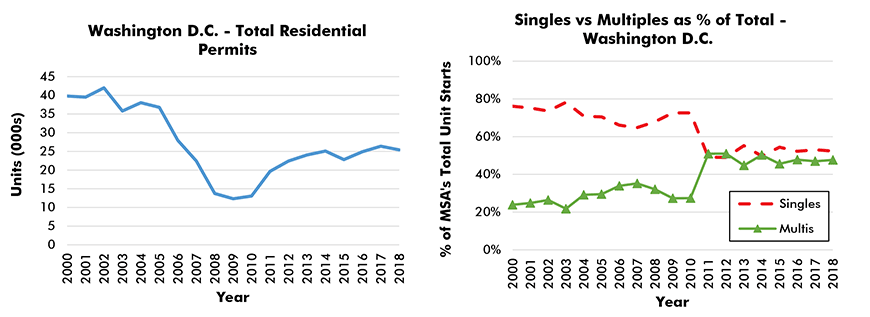
‘Residential permit’ numbers serve as a proxy for ‘housing starts’.
Data source: Census Bureau and National Association of Home Builders (NAHB).
Charts: ConstructConnect.
Charlotte-Concord-Gastonia Residential Building Permits
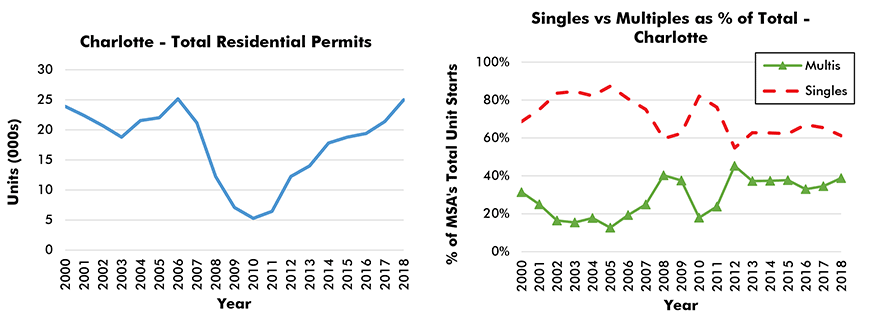
‘Residential permit’ numbers serve as a proxy for ‘housing starts’.
Data source: Census Bureau and National Association of Home Builders (NAHB).
Charts: ConstructConnect.
Denver-Aurora-Lakewood Residential Building Permits
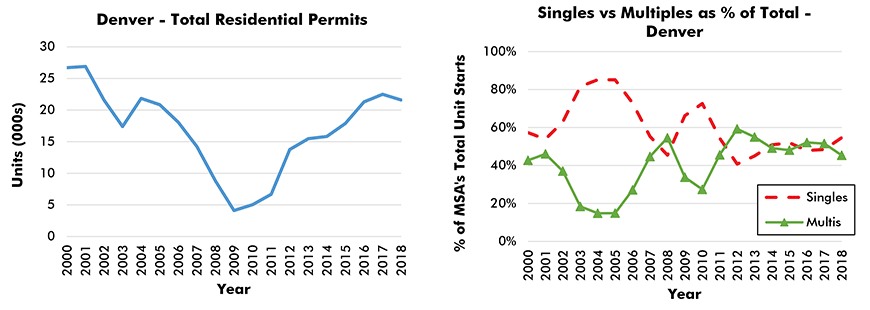
‘Residential permit’ numbers serve as a proxy for ‘housing starts’.
Data source: Census Bureau and National Association of Home Builders (NAHB).
Charts: ConstructConnect.
Miami-Fort Lauderdale-West Palm Beach Residential Building Permits

‘Residential permit’ numbers serve as a proxy for ‘housing starts’.
Data source: Census Bureau and National Association of Home Builders (NAHB).
Charts: ConstructConnect.
Nashville-Davidson-Murfreesboro-Franklin Residential Building Permits
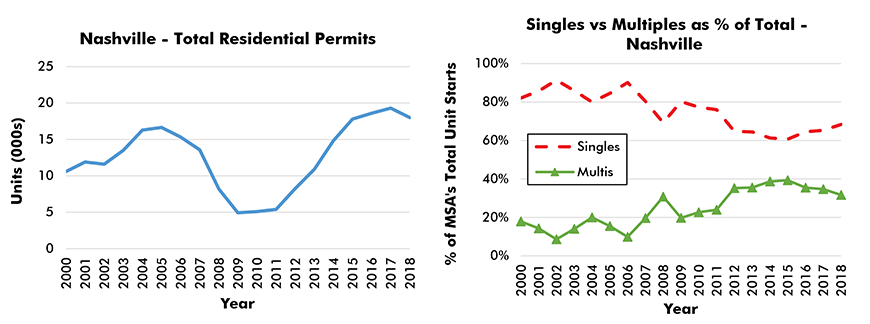
‘Residential permit’ numbers serve as a proxy for ‘housing starts’.
Data source: Census Bureau and National Association of Home Builders (NAHB).
Charts: ConstructConnect.
San Francisco-Oakland-Hayward Residential Building Permits
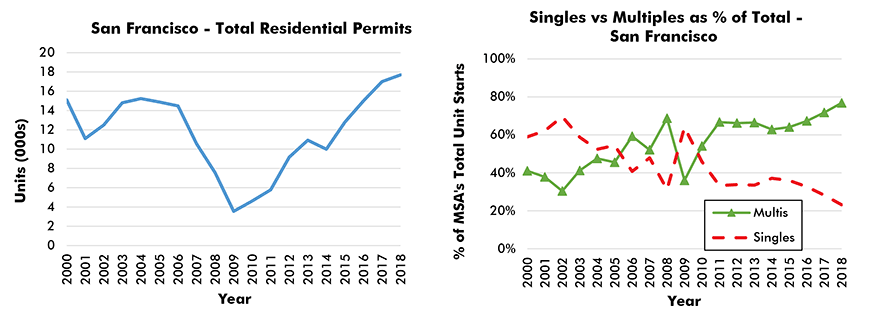
‘Residential permit’ numbers serve as a proxy for ‘housing starts’.
Data source: Census Bureau and National Association of Home Builders (NAHB).
Charts: ConstructConnect.






Recent Comments
comments for this post are closed