The table and maps accompanying this article feature comparisons of highway, street and roadwork construction starts in all the states, plus District of Columbia, in two ways: (1) by dollar-volume level, taking the annual average over the past two years (2017 and 2018); and (2) per capita (i.e., the dollar volume in (1) divided by each individual state’s population).

In some states, there can be considerable variation in the dollar volume of roadwork starts from one year to the next. Therefore, it seems only fair to smooth the series out a bit, and hence the reason for utilizing a latest-two-years average.
On the left-hand side of Table 1, there is a ranking of all states and D.C. according to their level of roadwork construction starts. Sixteen states have exceeded an annual average of $1.0 billion over the past two years and they are highlighted in Map 1. Washington state, at $995 million, and New Jersey, at $980 million, just missed the cut.
| Ranking of States by 2017-2018 Annual Average | Ranking of States by 2017-2018 Annual Average | ||||||||
| Levels of Highway, Street & Roadwork | Dollars of Highway, Street & Roadwork | ||||||||
| Construction Starts | Construction Starts Per Capita* | ||||||||
| 1 | Texas | $8,041,753,275 | 1 | North Dakota | $741 | ||||
| 2 | California | $5,722,588,987 | 2 | Alaska | $526 | ||||
| 3 | Florida | $3,729,082,766 | 3 | South Dakota | $444 | ||||
| 4 | New York | $2,438,711,468 | 4 | Wyoming | $431 | ||||
| 5 | Pennsylvania | $2,350,967,100 | 5 | Minnesota | $358 | ||||
| 6 | Illinois | $2,271,898,790 | 6 | Iowa | $334 | ||||
| 7 | Ohio | $2,270,383,526 | 7 | Wisconsin | $304 | ||||
| 8 | North Carolina | $2,016,908,136 | 8 | Texas | $280 | ||||
| 9 | Minnesota | $2,006,717,874 | 9 | West Virginia | $251 | ||||
| 10 | Georgia | $1,782,739,194 | 10 | Utah | $242 | ||||
| 11 | Wisconsin | $1,765,416,305 | 11 | Montana | $236 | ||||
| 12 | Virginia | $1,262,820,233 | 12 | Vermont | $234 | ||||
| 13 | Arizona | $1,200,301,579 | 13 | Arkansas | $227 | ||||
| 14 | Michigan | $1,178,775,640 | 14 | Hawaii | $225 | ||||
| 15 | Indiana | $1,137,711,303 | 14 | Maine | $225 | ||||
| 16 | Iowa | $1,052,855,324 | 16 | Rhode Island | $220 | ||||
| 17 | Washington | $994,610,037 | 17 | Nebraska | $206 | ||||
| 18 | New Jersey | $980,354,334 | 18 | Nevada | $198 | ||||
| 19 | South Carolina | $924,461,791 | 19 | North Carolina | $194 | ||||
| 20 | Missouri | $859,255,063 | 19 | Ohio | $194 | ||||
| 21 | Maryland | $846,006,039 | 21 | Mississippi | $184 | ||||
| 22 | Colorado | $776,400,932 | 21 | Pennsylvania | $184 | ||||
| 23 | Utah | $765,947,282 | 23 | South Carolina | $182 | ||||
| 24 | Tennessee | $761,159,307 | 23 | Oklahoma | $182 | ||||
| 25 | Massachusetts | $742,190,700 | 25 | Illinois | $178 | ||||
| 26 | Alabama | $742,097,479 | 26 | Florida | $175 | ||||
| 27 | Oklahoma | $716,017,982 | 27 | Delaware | $174 | ||||
| 28 | Louisiana | $684,259,157 | 28 | Indiana | $170 | ||||
| 29 | Arkansas | $683,093,996 | 29 | Georgia | $169 | ||||
| 30 | Kentucky | $633,662,673 | 30 | Arizona | $167 | ||||
| 31 | Nevada | $599,818,689 | 31 | Idaho | $159 | ||||
| 32 | North Dakota | $562,916,471 | 31 | Kansas | $159 | ||||
| 33 | Mississippi | $549,024,328 | 33 | Alabama | $152 | ||||
| 34 | Oregon | $467,100,160 | 34 | Virginia | $148 | ||||
| 35 | Kansas | $462,431,902 | 35 | Louisiana | $147 | ||||
| 36 | West Virginia | $454,096,255 | 36 | New Hampshire | $146 | ||||
| 37 | Nebraska | $398,204,792 | 37 | California | $145 | ||||
| 38 | South Dakota | $391,481,445 | 38 | Kentucky | $142 | ||||
| 39 | Alaska | $387,622,429 | 39 | Missouri | $140 | ||||
| 40 | Hawaii | $320,016,248 | 39 | Maryland | $140 | ||||
| 41 | Maine | $301,298,463 | 41 | New Mexico | $139 | ||||
| 42 | New Mexico | $291,953,653 | 42 | Colorado | $136 | ||||
| 43 | Idaho | $279,638,389 | 43 | Washington | $132 | ||||
| 44 | Connecticut | $255,504,855 | 44 | New York | $125 | ||||
| 45 | Montana | $251,056,538 | 45 | Michigan | $118 | ||||
| 46 | Wyoming | $249,056,766 | 46 | Tennessee | $112 | ||||
| 47 | Rhode Island | $232,304,985 | 47 | Oregon | $111 | ||||
| 48 | New Hampshire | $198,249,520 | 48 | New Jersey | $110 | ||||
| 49 | Delaware | $168,339,247 | 49 | Massachusetts | $108 | ||||
| 50 | Vermont | $146,660,351 | 50 | Connecticut | $72 | ||||
| 51 | District of Columbia | $37,804,615 | 51 | District of Columbia | $54 | ||||
| TOTAL U.S. | $58,343,728,360 | TOTAL U.S. | $178 | ||||||
When the ranking numbers are the same, the states are tied.
Table: ConstructConnect.
There is a tight correlation between population and the dollar volume of roadwork starts. For 13 of the 16 states shown in the map, their rankings for roadwork starts are either identical with, or quite close to, their rankings according to population (calculated as of July 1, 2018). For example, Texas is number 1 for starts and number 2 for population; California is 2 for starts and 1 for population; Florida is 3 and 3; New York, 4 and 4; Pennsylvania, 5 and 5; Illinois, 6 and 6; Ohio, 7 and 7; and so on.
There are, however, three outliers. Minnesota is ninth for roadwork starts but only 22nd for population; Wisconsin is 11th for starts, but 20th for population; and Iowa is 16th for starts, but 31st for population. It might be concluded that those three states are taking their roadbuilding commitments seriously.
As for large-population states that have been bumped out of the Top 16 for roadwork starts, they all appear between positions 17 and 25 in the rankings. New Jersey is 11th for population and 18th for starts; Washington state is 13th for population and 17th for starts; and Massachusetts is 15th for population and 25th for starts.
Map 1: States with 2017-2018 Annual Average Levels of
Highway, Street & Roadwork Construction Starts
Greater than $1.0 Billion
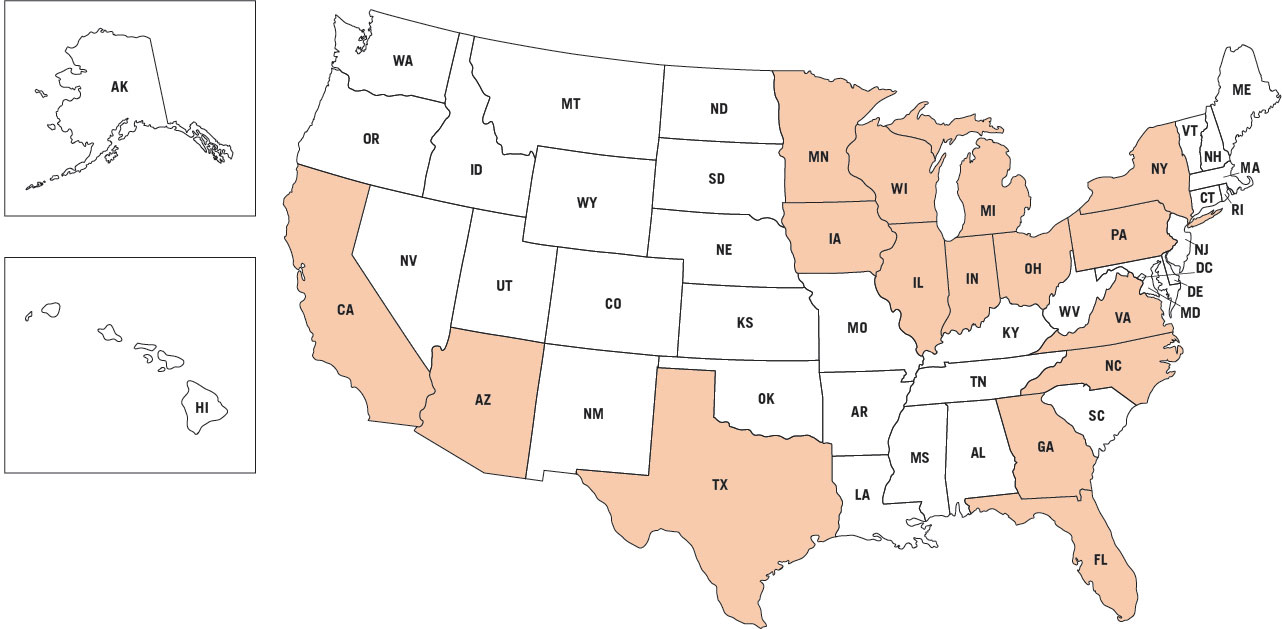
Data sources: ConstructConnect & Census Bureau / Map: ConstructConnect.
The right-hand side of Table 1, which provides a ranking of states and D.C. according to per capita value of roadwork starts, takes the analysis down a different pathway. The four states at the summit of the per-capita ranking – North Dakota, Alaska, South Dakota and Wyoming – all have quite low resident counts. Their populations range from a high of 880,000 for South Dakota to a low of 580,000 for Wyoming.
Minnesota is the first somewhat-large-population state (5.6 million people) to appear near the top in the per-capita ranking, in spot number 5.
The four largest-population states in the country are spread far apart in the per-capita roadwork- starts ranking. Texas, at $280 per person, makes a fine showing in 8th place. Florida ($175), though, is in 26th place; California ($145) in 37th; and New York ($125), in 44th.
Not only population level, but rate of population change seems to have a bearing on the per-capita value of roadwork construction starts. For example, among the four largest-population states, Texas and California are seeing their resident counts increase faster, +1.3% and +1.5% annually, than California and New York, +0.4% and -0.2% annually.
More population and a rising demand for housing, often in the suburbs, will drive greater infrastructure needs. Nevertheless, tying roadwork starts to population growth is not an exact fit.
What is helpful, though, is to distinguish between youthful ‘upstarts’ and older established regions. Other already built-up states in addition to New York appearing near the bottom in the roadwork starts ranking are Michigan, New Jersey, Massachusetts and Connecticut.
Map 2: States with 2017-2018 Annual Average Highway,
Street & Roadwork Construction Starts Per Capita
Greater than Total U.S.-Wide Figure of $178
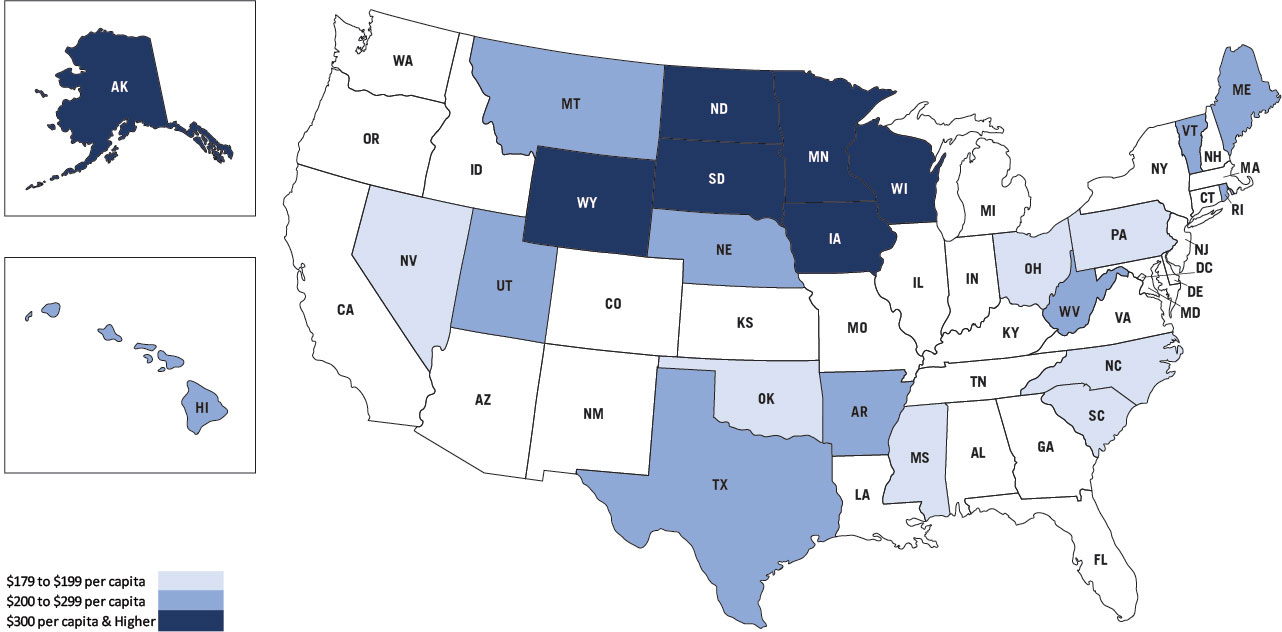
Data sources: ConstructConnect & Census Bureau / Map: ConstructConnect.
Of course, there can be other reasons for roadwork construction to be prioritized in a specific state. A severe weather event, causing washouts, may necessitate damage repair. Or there may be instances when such construction is stimulated by a strong rural-to-urban shift.
Alternatively, in some less populated areas, large dollar spending may be required to gain access, for equipment and labor, to remote resource sites.
In today’s highly competitive world, economies everywhere are striving to deliver goods and people faster and cheaper. New and well-maintained highways and roads are a key means to achieve productivity enhancements on the logistics grid.
Canada:
In Canada, Ontario has been the leader among the provinces for latest two-year average roadwork starts, at $2.5 billion CAD. Quebec ($2.4 billion) fell short of first place by only the smallest of margins. Also, it’s worth noting that the Atlantic Region recorded a surprisingly upbeat $1.6 billion on average in 2017-2018.
Alberta ($864 million) was ahead of B.C. ($658 million), Saskatchewan ($319 million) and Manitoba ($291 million). The total Canada figure was $8.6 billion.
The Atlantic Region ($644) was the frontrunner on a per capita basis. In positions two through seven were Quebec ($289); Saskatchewan ($274); Manitoba ($215); Alberta ($201); Ontario ($172); and B.C. ($129).
As a final observation, there’s another standout number to showcase. The total Canada per capita figure was $231. Applying a 0.75 currency conversion rate, $231 CAD becomes $174 USD – which is almost exactly the same as the total U.S. per capita number of $178 USD.


Recent Comments