On behalf of individuals, the task of monitoring changes in the cost of purchasing everyday products and bigger ticket items is assigned to the Consumer Price Index (CPI).
For business managers, however, the cost measurements that have the most relevance are the Producer Price Index (PPI) figures.
Both the CPI and PPI are calculated and published by the Bureau of Labor Statistics. (In Canada, PPI equivalents appear in Statistics Canada’s Industrial Product Price Index (IPPI) and Raw Materials Price Index (RMPI) series.)
A price index takes a dollar cost in a specified starting period, or what is termed a ‘base’ period, and assigns it the value of 100.0. Each subsequent monthly dollar value is calculated as a ratio of the ‘base’ value, but it is expressed relative to 100.0. For example, if the price doubles in two years versus its base, the index figure after two years will be 200.0. The advantage of adopting an index methodology is that numerous diverse items can all be assigned the same starting value (e.g. January 2000 = 100.0) to determine how they perform relative to each other over time.
Each month, the BLS issues thousands of PPI updates. Table 1 gathers together most of the PPI data series that have the most meaning for the construction sector. The top shaded portion of the table shows ‘final demand’ indices – i.e., the cost to owners of undertaking capital spending projects – while the bottom shaded portion concentrates on non-labor ‘input’ costs for various kinds of construction.
In the middle portion of the table, are indices for specific services, building materials and forms of energy. PPI indices measure prices in effect as products/services leave ‘the front gate’ of domestic producers. Costs of ‘alternative’ imports are excluded. Therefore, the new tariffs on lumber, steel and aluminum won’t be having direct impacts on the PPI series; but to the extent they are changing the competitive environment, they are playing a role in costing.
In January 2019, the cost of ‘final demand construction’ was +4.9% year over year (y/y), with private projects increasing faster than public/government projects, +5.1% compared with +4.5%. Among the five type-of-building categories shown in the top shaded section of Table 1, the y/y cost increases ranged from a low of +3.9% for warehouses to a high of +5.8% for industrial structures.
The y/y gains for ‘inputs to new construction’ indices (which exclude machinery and equipment purchases, labor and imports) at the bottom of Table 1, however, have been more modest. Inputs to all new construction in January were +2.8%, with residential at +3.0%; nonresidential, +2.8%; and maintenance and repair, +2.3%.
% Change in the Janaury 2019 Index from:
| 3 Years | 1 Year | 6 months | 3 months | 1 month | |||||
| Ago | Ago | Ago | Ago | Ago | |||||
| Final Demand/Service/Commodity/Energy/Input: | |||||||||
| Final Demand Construction | 10.1% | 4.9% | 3.0% | 1.0% | 0.6% | ||||
| Construction for private capital investment | 10.3% | 5.1% | 3.0% | 1.1% | 0.7% | ||||
| Construction for Government | 9.3% | 4.5% | 2.9% | 0.7% | 0.6% | ||||
| New warehouse building construction | 10.1% | 3.9% | 2.6% | 1.0% | 0.6% | ||||
| New school building construction | 10.2% | 5.2% | 3.5% | 0.7% | 0.7% | ||||
| New office building construction | 10.3% | 5.2% | 2.6% | 1.1% | 0.6% | ||||
| New industrial building construction | 11.4% | 5.8% | 3.8% | 0.9% | 0.8% | ||||
| New health care building construction | 9.5% | 4.8% | 2.7% | 1.2% | 1.0% | ||||
| Architectural & engineering services | 6.8% | 2.3% | 1.2% | 1.2% | 0.8% | ||||
| Construction machinery & equipment | 5.7% | 6.1% | 4.8% | 4.1% | 1.0% | ||||
| Asphalt | 72.0% | 31.9% | -13.9% | -18.6% | 4.1% | ||||
| Plastic construction products | 9.0% | 3.9% | 1.9% | 1.1% | 0.8% | ||||
| Softwood lumber | 10.9% | -10.4% | -21.4% | -2.9% | -0.8% | ||||
| Hardwood lumber | 5.3% | 0.0% | -2.9% | -1.3% | -2.0% | ||||
| Millwork | 10.1% | 3.7% | -0.1% | 0.0% | 0.2% | ||||
| Plywood | 9.4% | -3.8% | -11.7% | -7.8% | -0.7% | ||||
| Particle board & oriented strandboard (OSB) | 1.7% | -8.8% | -19.6% | -14.9% | -2.8% | ||||
| Gypsum | 13.0% | 0.0% | -3.8% | -3.1% | -0.8% | ||||
| Insulation materials | 7.6% | 6.4% | 5.2% | 0.8% | 1.7% | ||||
| Construction sand, gravel & crushed stone | 12.1% | 5.4% | 3.2% | 2.9% | 2.5% | ||||
| Cement | 9.7% | 2.2% | 0.7% | 0.6% | 0.9% | ||||
| Ready-mix concrete | 10.2% | 2.5% | 0.8% | 1.2% | 0.9% | ||||
| Precast concrete products | 11.3% | 6.8% | 3.8% | 2.9% | 0.9% | ||||
| Prestressed concrete products | 19.1% | 4.8% | 0.7% | 0.6% | 0.8% | ||||
| Brick (clay) | 4.0% | 1.3% | 0.8% | 1.0% | 0.7% | ||||
| Coal | 10.2% | 3.9% | 2.7% | 3.5% | 1.7% | ||||
| Iron ore | 25.9% | 16.6% | -0.9% | 1.2% | 1.2% | ||||
| Iron & steel scrap | 88.3% | -3.2% | -10.6% | 1.4% | -6.6% | ||||
| Steel bars, plates & structural shapes | 35.8% | 23.7% | 3.9% | 1.5% | 1.9% | ||||
| Steel pipe & tube | 40.2% | 18.3% | 2.2% | -0.8% | -0.2% | ||||
| Fabricated structural metal products | 13.1% | 7.7% | 1.3% | 0.3% | 0.7% | ||||
| Prefabricated Metal Buildings | 21.4% | 11.4% | -0.8% | -1.4% | 0.5% | ||||
| Metal valves | 10.8% | 5.8% | 2.4% | 0.4% | -0.1% | ||||
| Aluminum mill shapes | 23.6% | 6.1% | -3.8% | -1.4% | 0.5% | ||||
| Sheet metal ducting | 2.9% | 0.6% | 0.5% | 0.0% | 0.0% | ||||
| Flat glass | 5.7% | 1.6% | 0.8% | 0.7% | 1.0% | ||||
| Paints, architectural coatings | 11.7% | 7.4% | 4.5% | 4.2% | 0.5% | ||||
| Lighting fixtures | 7.0% | 4.6% | 3.2% | 0.2% | -0.1% | ||||
| Plumbing fixtures & fittings | 7.1% | 3.8% | 2.4% | 2.1% | 0.3% | ||||
| Elevators & escalators | 8.4% | 3.5% | 2.4% | 2.1% | 1.9% | ||||
| Heating equipment | 10.2% | 6.2% | 2.6% | 1.7% | 1.4% | ||||
| Air conditioning equipment | 10.3% | 4.9% | 2.0% | 1.3% | 1.4% | ||||
| Copper wire & cable | 24.1% | 2.2% | -6.1% | -1.1% | 0.0% | ||||
| Fiber optic cable | -1.4% | -0.5% | -0.7% | 0.0% | 0.0% | ||||
| Regular gasoline unleaded | 17.7% | -21.4% | -34.3% | -35.3% | -7.8% | ||||
| Diesel Fuel | 68.5% | -12.5% | -21.8% | -25.9% | -14.6% | ||||
| Jet Fuel | 62.1% | -10.3% | -19.7% | -24.6% | -8.4% | ||||
| Natural gas | 44.6% | 20.2% | 28.4% | 28.1% | -32.2% | ||||
| Natural gas to electric utilities | 14.4% | 17.8% | 13.8% | 9.8% | -21.0% | ||||
| Commercial electric power | 2.3% | -1.9% | -7.5% | -3.0% | 0.7% | ||||
| Industrial electric power | 18.3% | -0.2% | -6.1% | 0.1% | 1.1% | ||||
| Residential electric power | 5.0% | 0.2% | -3.4% | -0.2% | 1.3% | ||||
| Commercial natural gas | 17.4% | 5.3% | 9.8% | 10.2% | -1.1% | ||||
| Industrial natural gas | 13.7% | 4.5% | 9.2% | 8.6% | -6.1% | ||||
| Residential natural gas | 15.4% | 3.6% | 5.7% | 6.6% | 0.3% | ||||
| Inputs to new construction | 10.8% | 2.8% | -1.7% | -2.0% | -0.1% | ||||
| Inputs to new construction, goods | 10.7% | 1.7% | -3.6% | -4.1% | -0.7% | ||||
| Inputs to new construction, services | 10.9% | 4.3% | 0.7% | 0.8% | 0.7% | ||||
| Inputs to new residential construction | 10.7% | 3.0% | -1.4% | -1.5% | 0.1% | ||||
| Inputs to single-family res construction | 10.6% | 2.5% | -1.7% | -1.7% | 0.0% | ||||
| Inputs to multi-family res construction | 11.2% | 3.3% | -1.6% | -1.5% | 0.1% | ||||
| Inputs to new non-res construction | 10.7% | 2.8% | -1.8% | -2.2% | -0.2% | ||||
| Inputs to commercial construction | 11.3% | 3.4% | -1.4% | -1.8% | -0.1% | ||||
| Inputs to healthcare structures | 10.6% | 3.1% | -1.5% | -1.5% | -0.1% | ||||
| Inputs to industrial structures | 9.9% | 3.1% | -0.2% | -0.9% | 0.2% | ||||
| Inputs to highways & streets | 11.7% | 2.7% | -2.6% | -3.7% | -0.6% | ||||
| Inputs to power & communication structures | 11.1% | 2.1% | -2.6% | -2.8% | -0.5% | ||||
| Inputs to educational & vocational structures | 10.5% | 3.3% | -1.1% | -1.2% | 0.0% | ||||
| Inputs to maintenance & repair construction | 10.6% | 2.3% | -2.1% | -2.3% | -0.2% | ||||
| Construction materials (PPI ‘Special Index’) | 13.2% | 6.0% | -0.1% | 0.1% | 0.5% |
The ‘service’, ‘commodity’ and ‘energy’ indices (in the middle section of the table) are based on ‘factory-gate’ sales prices.
The ‘input’ indices (at bottom) reflect costs faced by contractors. They exclude capital investment (i.e., machinery & equipment), labor & imports.
The ‘input’ indices are built up from the ‘service’ (design, legal, transport & warehousing, etc.) ‘commodity’ and ‘energy’ indices.
Table: ConstructConnect.
Among the service, building material and forms of energy items in the middle section of Table 1, some of the biggest y/y changes in the latest month were recorded in: asphalt, +31.9%; steel bars, plates and structural shapes, +23.7%; natural gas, +20.2%; steel pipe and tube, +18.3%; iron ore (as a key component in steelmaking), +16.6%; prefabricated metal buildings, +11.4%; paints and architectural coatings, +7.4%; precast concrete products, +6.8%; insulation materials, +6.4%; heating equipment, +6.2%; and aluminum mill shapes, +6.1%;
On the downside were: regular unleaded gasoline, -21.4%; diesel fuel, -12.5%; softwood lumber, -10.4%; particle board and oriented strand-board (OSB), -8.8%; and plywood, -3.8%.
The following graphs set out the historical records of the PPI series for nine material components/commodities that are crucial in the residential and/or nonresidential building process. Supplementing the index value curve in each graph are trend lines. The trend lines derive from exponential growth rates between starting and ending points. Even when they appear straight, they have some curvature.
Softwood Lumber:
From January 2000 to January 2019, the annual compounding increase in softwood lumber prices in America has been only +0.4%. Since the 2008-2009 recession, though, the annualized rate of gain has been a more assertive +4.7%.
In 2016 and 2017, softwood lumber prices sprinted rapidly higher. Throughout most of 2018, however, they retreated markedly. On a most recent y/y basis (from Table 1), they have been -10.4%, with some other woods-based building materials also drooping significantly: plywood, -3.8%, and particle board/OSB, -8.8%.
Housing starts, a big source of demand for forestry products, have been less bullish than might be expected, given the high degree of pent-up demand which has accumulated. With the climb in interest rates now not likely to be as steep as originally expected, new residential groundbreakings in 2019 and beyond should resume their upward march.
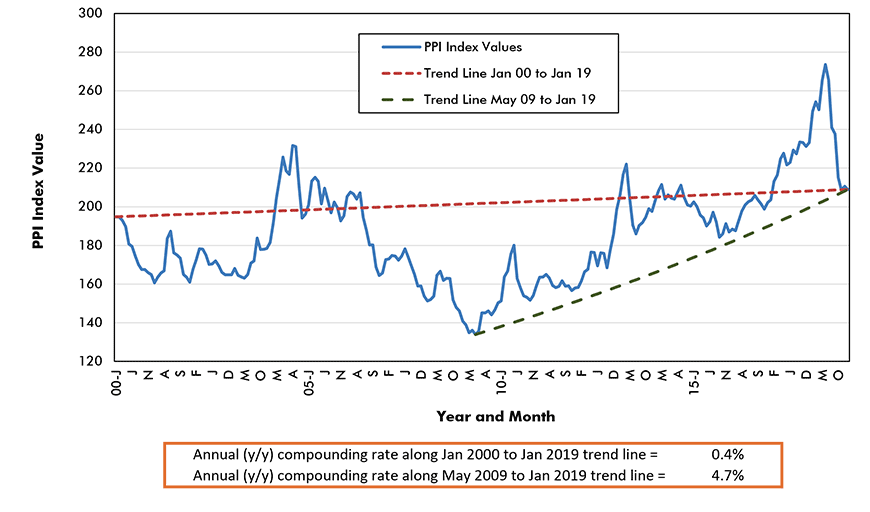
Chart: ConstructConnect.
Steel Bars, Plates and Structural Shapes:
Three trend lines have been calculated for the ‘steel bars, plates and structural shapes’ PPI series. The annualized price increases for the whole period, January 2000 to January 2019, and for the post-recession period, May 2009 to January 2019, have been not too dissimilar, +4.3% versus +3.3%. Since March 2016, however, the ‘steel bars, plates and shapes’ index has been soaring upwards at a much faster pace, +12.5% annualized.
Most recently, and as is shown in Table 1, the y/y PPI increase for ‘steel bars, plates and structural shapes’ has been +23.7%. Caught up in the same rapid current have been steel pipe and tube products, +18.3% y/y, and prefabricated metal buildings, +11.4%.
Graph 2: Steel Bars, Plates and Structural Shapes Price Index – U.S. PPI
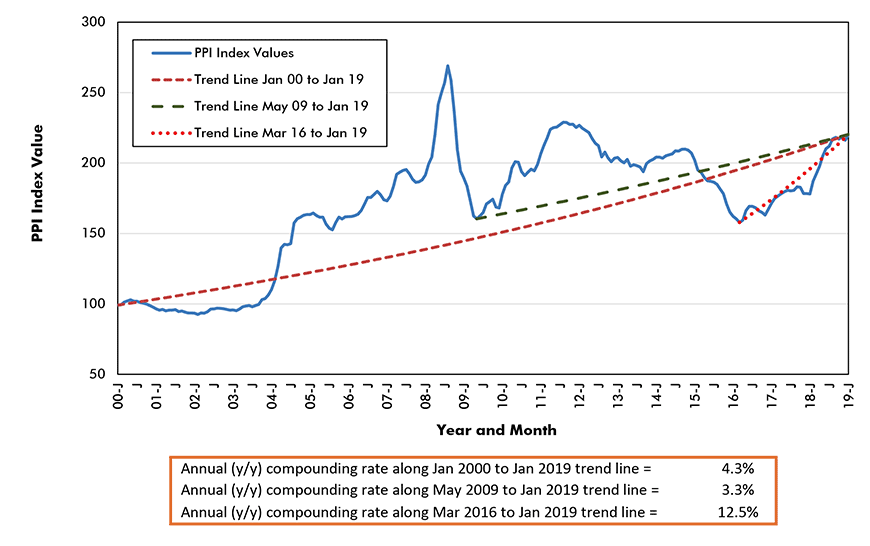
Chart: ConstructConnect.
Iron and Steel Scrap:
Since final-product steel is now mainly rendered from re-used steel melted down in electric arc furnaces, it’s important to keep an eye on scrap prices. Graph 3 shows iron and steel scrap prices rising at an annual compounding rate of +5.7% between January 2000 and January 2019.
But it’s also interesting to note that there can be periods of intense movement in iron and steel scrap prices. Between November 2001 and July 2008, the annualized rate of increase was +34.6% − i.e., a gain of more than one third per annum extending for more than six-and-a-half years.
From Table 1, the latest y/y change in the price of iron and steel scrap has been -3.2%; but iron ore as a standalone input has been making some waves. Its most recent y/y jump has been +16.6% y/y. A dam disaster at a Vale S.A. iron ore mine in Brazil has constrained supply.
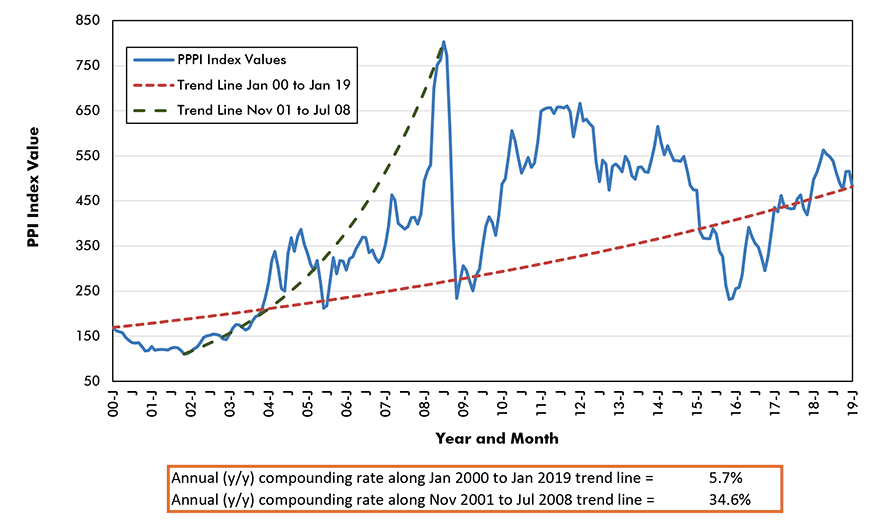
Chart: ConstructConnect.
Ready-mix Concrete:
Ready-mix concrete is a building material that has shown remarkable price-increase consistency over the past 19 years. Yes, as can be seen in Graph 4, there was some weakness in ‘actuals’ versus trend-line from 2001 to 2004, followed by over-correction in 2006-2009, but from 2011 to the present, the index-value line and the trend line have almost exactly overlapped.
For the entire period, January 2000 to January 2019, the annualized increase in ‘ready-mix concrete’ prices, according to the PPI measure, has been +3.4%. Over a somewhat shorter, but still eight-year-plus span of time, from November 2011 to January 2019, the y/y rate of price increase has been +3.6%, nearly the same as for the full 19 years.
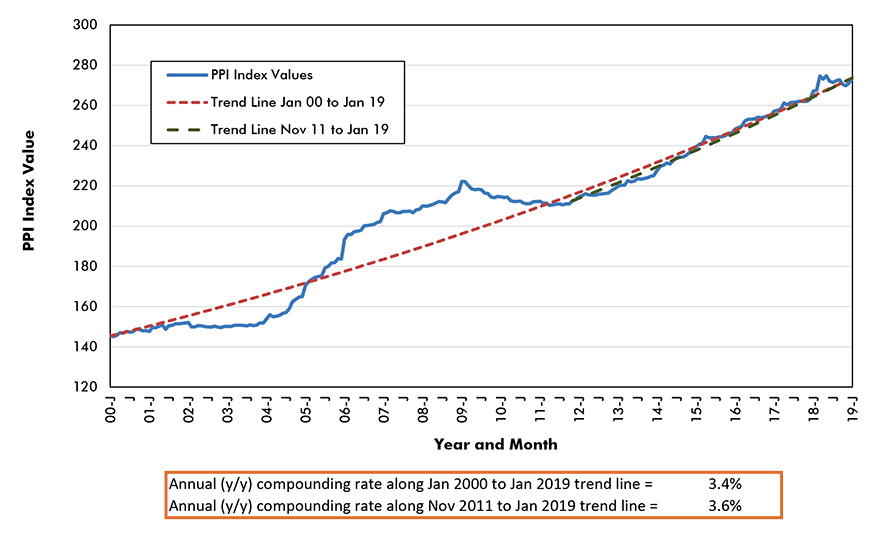
Chart: ConstructConnect.
Cement:
Underlying the cost of ready-mix concrete, of course, is the price of cement. Over the past 19 years, the annualized increase in the price of cement, as captured in the exponential growth rate curve in Graph 5, has been +2.8%. (Again, the long dashed-line from January 2000 to January 2019 may appear flat, but it has some curvature on accounting of compounding.)
During the recession and in its immediate aftermath, the price of cement pulled back by more than 10%, but since November 2011, it has been ascending at a +4.6% per annum rate. Over the most recent year, as set out in Table 1, the PPI for prestressed concrete products is +4.8% and for precast concrete products, +6.8%.
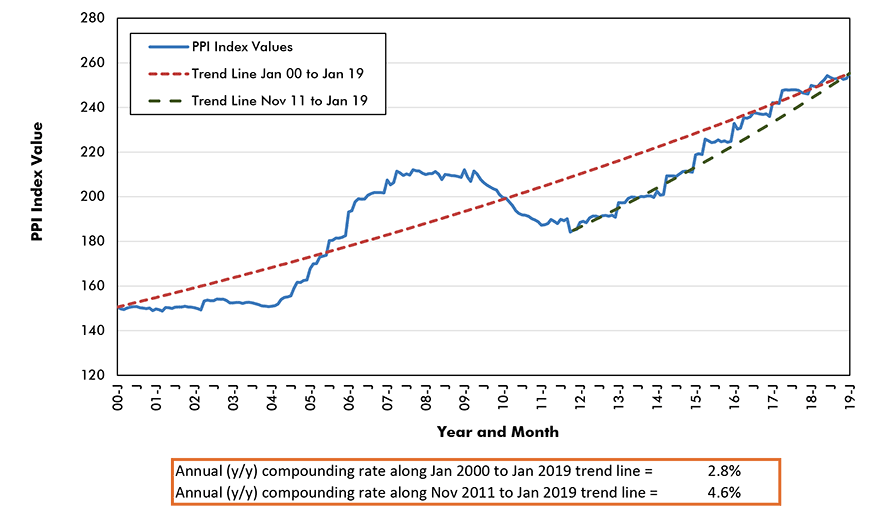
Chart: ConstructConnect.
Gypsum:
Gypsum has been among the building materials with livelier price movements since the Great Recession. Simply plotting a trend line from January 2000 to January 2019 yields a relatively modest +2.0% annual rate of increase, with lengthy periods (2001-2004 and 2008-2012) when the ‘actual’ cost was well below trend.
The trend line over the past seven-plus years, however, has turned sharply higher. Since September 2011, the annualized increase in the price of gypsum has been +7.3%. The shorter trend line doesn’t tell the whole story, though. From Table 1, the latest year-over-year change in the price of gypsum has been 0.0%.
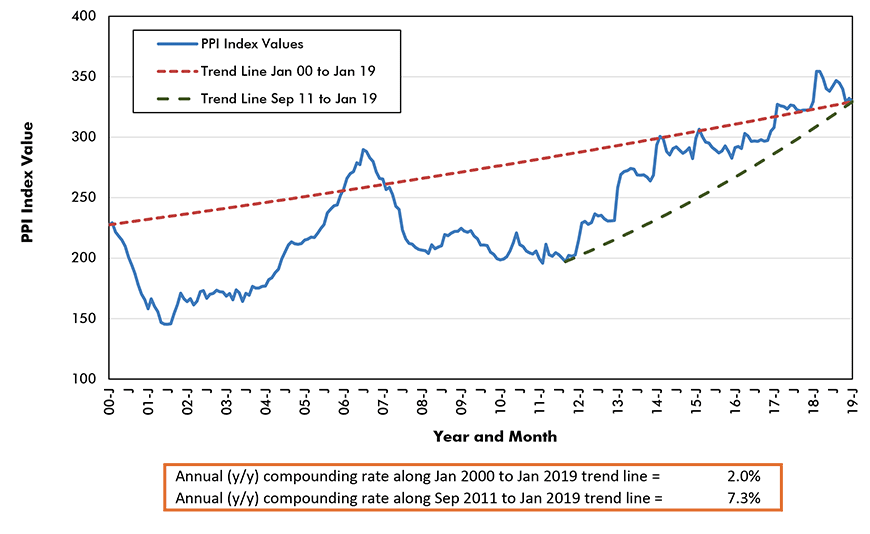
Chart: ConstructConnect.
Flat Glass:
The flat glass PPI did display some up and down variability from early 2000 into the spring of 2010, but it essentially ended the period at the same point where it had begun ten years earlier. Soon afterwards, there was an escape from that pattern of inertia, during the sprightlier ‘run’ from mid-2010 to the present.
Since August 2010, the trend line for the price of flat glass has been moving upwards at a +2.7% annualized rate. That’s still a pretty restrained price-increase path, but it’s faster than the +1.3% per annum gain from the beginning of 2000 to a minor peak in late 2008 and over the extended time frame from January 2000 to January 2019.
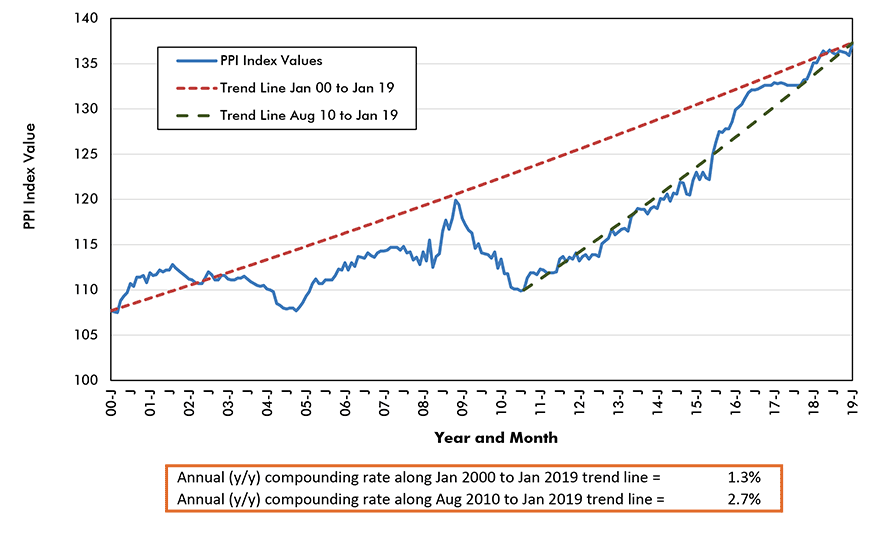
Chart: ConstructConnect.
Aluminum Mill Shapes:
Three trend lines have been superimposed on the Graph 8 monthly PPI results for ‘aluminum mill shapes’. Furthermore, those three trend lines, of longer and shorter durations, but all ending January 2019, have become progressively steeper.
The annual compounding rate of increase has moved up from +1.7% (for January 2000 to January 2019), to +3.3% (April 2009 to January 2019), and then to +7.6% most recently (from February 2016 to the present).
From Table 1, aluminum mill shapes are currently +6.1% y/y, but -3.8% versus six months ago. The latter percentage change indicates a diminishing impact from the new tariffs.
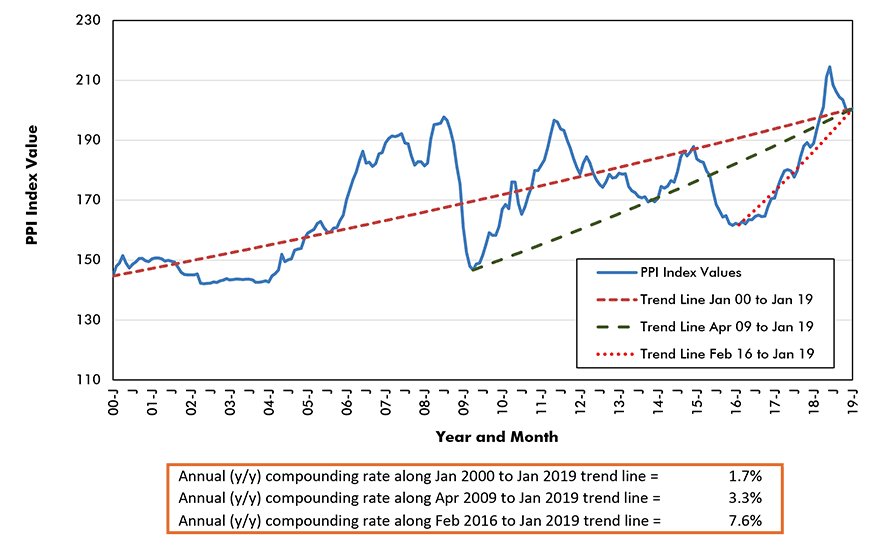
Chart: ConstructConnect.
Copper Wire and Cable:
The usage of copper is so widespread, especially in the auto sector and in construction, that it has become a global bellwether commodity. Economic growth worldwide has still not regained the vitality it exhibited prior to the recession and for many years, lack of excitement on the foreign trade front had an adverse impact on the price of copper as well.
From April 2011 to June 2016, the annualized change in the price of copper wire and cable was -10.6%. Since June 2016, however, there has been a reversal or ‘flipping’ of the percentage-change number of exactly the same order, and it has been climbing by +10.6% per year.
For the entire time frame shown in Graph 9, from January 2000 to January 2019, the PPI for copper wire and cable has moved higher at a +4.4% annual rate.
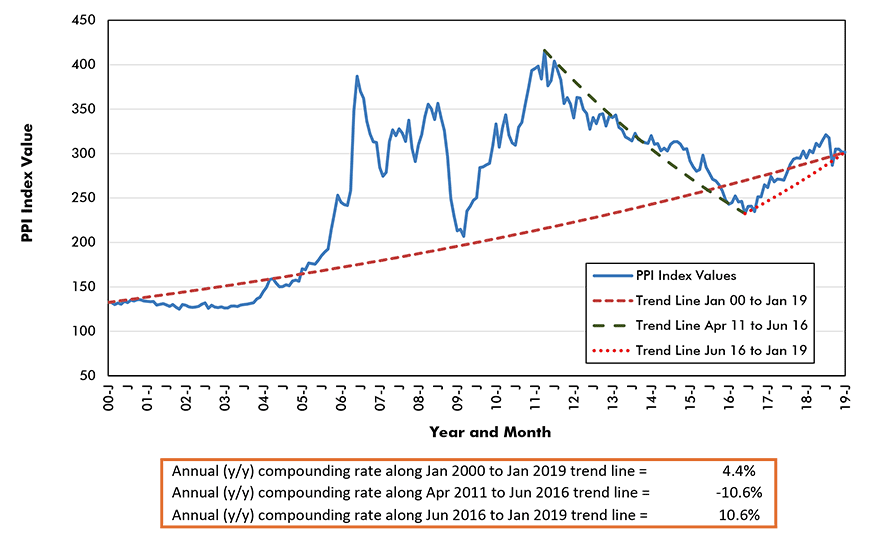
Chart: ConstructConnect.







Recent Comments
comments for this post are closed