Minimal Canadian GDP Growth in Q1 2019
Canadian ‘real’ (i.e., inflation-adjusted) gross domestic product (GDP) figures were released by Statistics Canada at the end of May and they weren’t pretty. Thankfully, the quarter-to-quarter change was still positive, but only by the smallest of margins. Q1 2019 versus Q4 2018 was +0.1%, or +0.4% when annualized.
For the latest two quarters, annualized Canadian GDP growth has been +0.3% and +0.4%. The comparable gains for the U.S. economy have been much better, at +2.2% and +3.1%.
The Q1 2019 weakness in the Canadian results originated in ‘residential structures’ investment (-6.1% annualized) and in export sales (-4.1% annualized). The problem with the latter was exacerbated by a large pickup in imports (+7.7% annualized), which widened the foreign trade deficit. A deficit in foreign trade (i.e., imports greater than exports) reduces GDP’s bottom line.
There’s been no reason to complain about Canadian consumers and their shopping habits. They have stayed fully engaged. Versus Q4 2018, household consumption expenditures in Q1 2019 were +3.5% annualized, providing a more than solid boost to domestic demand.
There’s a statistic that clearly shows how much Canada’s foreign trade woes are taking away from national output growth. Consider that while GDP growth in Q1 was only +0.4% annualized, the advance in ‘final domestic demand’, which omits trade, was +3.4%.
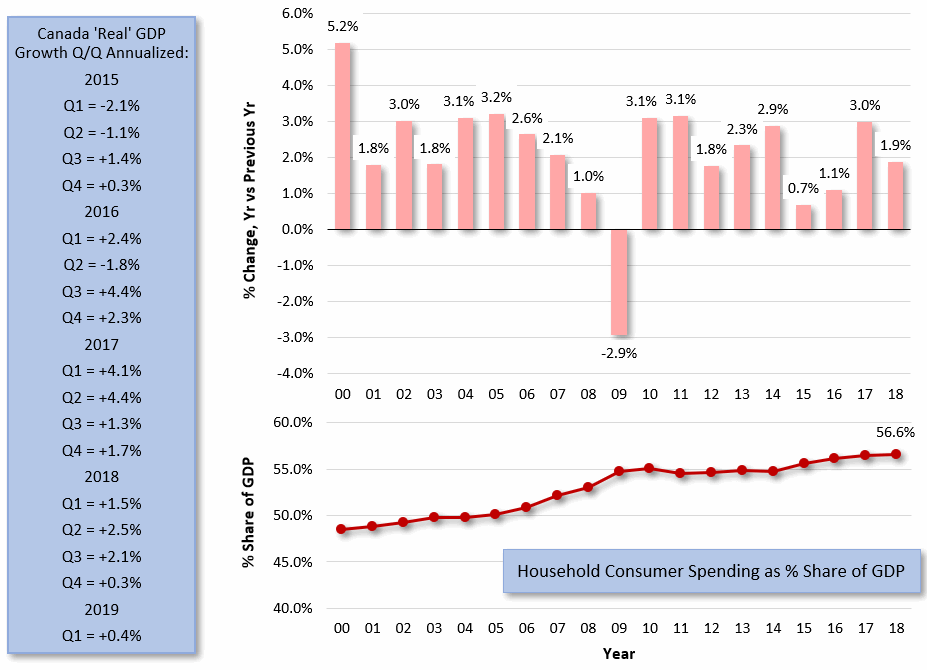
Chart: ConstructConnect.
U.S. Q1 GDP Growth of +3.1% Close to Optimal
The U.S. ‘second estimate’ Q1 2019 GDP growth rate was recently lowered slightly from the ‘first estimate’, by the Bureau of Economic Analysis (BEA), to +3.1% from +3.2%.
Nevertheless, +3.1% remains healthy and sits above the +3.0% benchmark considered to be close to a full-potential expansion path.
Unlike Canada, the U.S. in Q1 benefitted from developments on the foreign trade front. U.S. export sales of both goods and services were +4.8% annualized, while import purchases of both goods and services, were -2.5%.
The tariffs on goods from China have been taking a bite out of shipments from across the Pacific.
The U.S. is still running a substantial overall foreign trade deficit, but China’s share of that shortfall in March fell to just 35%. A one-third portion of the deficit is a lot less than the nearly one-half proportion that China has been customarily taking over the past many years.
Now, the administration in Washington is saying it may impose a base level tariff of 5% on all imports from Mexico, with the option of ratcheting up the rate further down the road.
President Trump believes such a tariff plan will provide the leverage needed to force Mexico’s compliance in curbing migration to the U.S. from countries further south.
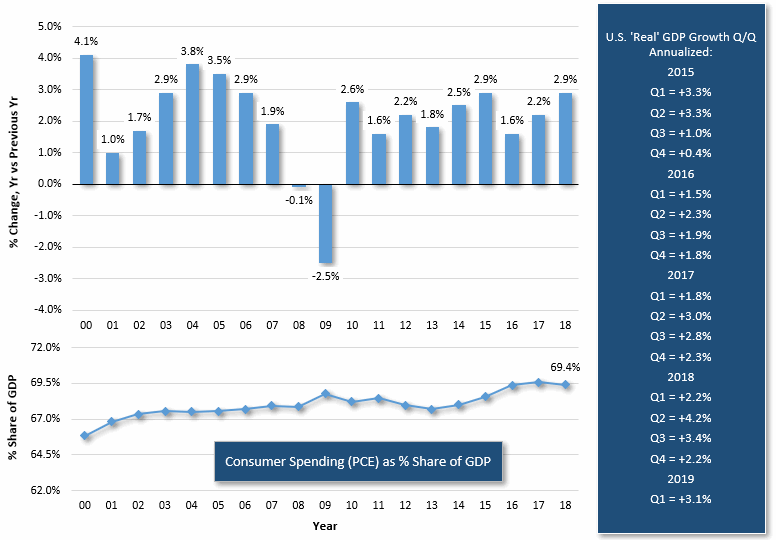
Chart: ConstructConnect.
U.S. GDP Growth Rate Advantage over Canada Stretches to 7 Quarters
Graph 3 highlights the divergences between U.S. and Canadian quarter-to-quarter ‘real’ GDP growth rates. The top half of the chart records the U.S. percent change minus the Canadian percent change. The bottom half sets out the inverse (i.e, the Canadian percent change versus the American).
The two sets of columns are mirror images of one another. For example, when there is a +1.0% column in the top half of the chart, because the U.S. growth rate has been faster by one percentage point (e.g., +3.0% compared with +2.0%), it will be matched by a -1.0% column in the bottom Canadian half. And vice versa.
Canada has been trailing the U.S. with respect to Q/Q GDP growth for the past seven quarters. No other period of similar lengthy dominance by one country or the other appears in the chart which has a starting point of Q1 2000, dating back nearly 20 years.
Furthermore, the gap in Q/Q GDP growth rates, with the U.S. ahead of Canada, has lately been widening.
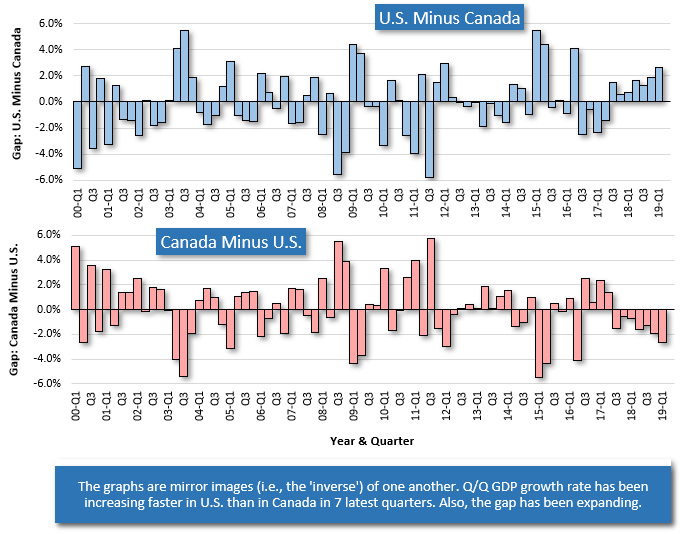
Chart: ConstructConnect.
Tariffs as Leverage, but also a Tax on the American People
Table 1 below establishes the relative importance of foreign trade for the economies of the U.S. and Canada. By far, Canada is more dependent on back-and-forth dealings with partners outside its own borders.
Canadian total exports as a share of GDP in 2018 were nearly one-third. In the U.S., they were around 12%.
A similar pattern emerges for imports. Canada’s imports as a proportion of GDP last year were 34.0%. In the U.S., they were less than half that figure, at 15.4%.
America’s lesser reliance on foreign trade has a major implication. There has always been the impression that, if need be, the U.S. economy can go it alone. It is perhaps this logic that has led President Trump to be more freewheeling in his approach to trade policy and the imposition of tariffs.
There’s a side to tariffs, however, that is probably being misunderstood by most people. Since they are meant to be punitive, a common misconception is that China, as well as any other country targeted for attention, is footing the bill.
That’s not the case. Yes, the access of Chinese and perhaps soon Mexican firms to the U.S. marketplace is inhibited. The duties, however, are paid by American importers, who then try to pass on as much of the cost increase as they can to American consumers.
Therefore, with respect to how they play out, tariffs are essentially sales taxes with the difference being that the monies collected go into federal rather than state coffers.
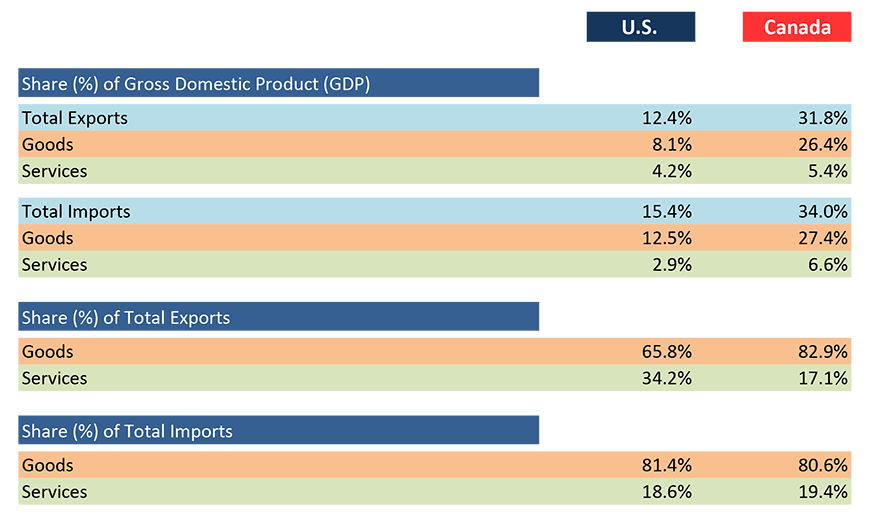
Table: ConstructConnect.
Hard-knock Life for Canadian Oil Producers Exaggerated?
Canada’s economy may be suffering from a foreign trade malaise that is largely centered in resources, but there is at least one major success story that has gone mostly unobserved.
There’s no denying that life would be better for Canadian oil exporters if they had more access to west coast tidewater ports so that they could sell their crude to customers in Asia.
But the hard-knock life for Canadian oil producers that is often being depicted in headlines these days is somewhat exaggerated.
Graph 4 below documents an amazing gain in U.S. market penetration that has been realized by Canadian oil companies over the past ten years. Furthermore, it has been accomplished at the expense of OPEC.
The Canadian share of U.S. oil imports has risen from 15% in 2000 and about 20% in 2019 to more than 50% year to date in 2019. From 2000 to the present, OPEC’s share has dropped from 50% to 26%.
Also, while U.S. oil imports have been falling of late, to be replaced by a ramping up of domestic production at new shale-rock wellheads, imports from Canada have kept climbing.
Through the first quarter of this year, U.S. total crude imports, in barrels, were -9.9% year over year. Some of the volume losses by major supplier nations or groupings were as follows: all OPEC nations, -28.4%; Saudi Arabia alone, -6.1%; and Mexico, -16.0%.
Moving in the opposite direction, the number of barrels imported from Canada in Q1 2019 was +3.6% y/y.
Sourced from OPEC and Canada
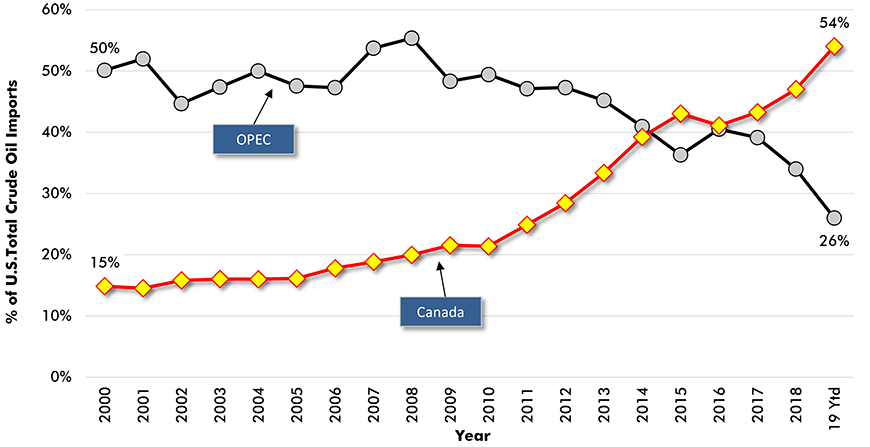
Chart: ConstructConnect.


Recent Comments
comments for this post are closed