To help analysts better assess the state of economic affairs, there are several measures of confidence that are widely studied. Consumer confidence and corporate executive confidence are the two that immediately come to mind.
There’s another, however, that is so omnipresent with daily, hourly and even minute-by-minute availability and media coverage, it can easily be overlooked. It’s investor confidence as captured in the performances of stock market indices.
Table 1 shows that as of June 2019’s ‘closing’, the three major U.S. indices, plus Canada’s Toronto stock exchange, were all within 2% of their 52-week highs. Moreover, the 52-week highs for the DJI, S&P500, NASDAQ and TSX are all at or near historical all-time peaks. For longer-term views,see Graphs 5 through 8 in the final section of this article.
| INDEX | 52-WEEK LOW | 52-WEEK HIGH | YEAR AGO (JUN 29, 2018) |
MONTH AGO (MAY 31, 2019) |
Latest Month-end Closing Prices (JUN 28, 2019) |
PER CENT CHANGE, LATEST VERSUS |
|||
| 52-WEEK LOW | 52-WEEK HIGH | YEAR AGO | MONTH AGO | ||||||
| Dow Jones Industrials NYSE (^dji) |
Dec 26 18 21,713 |
Jun 21 19 26,907 |
24,271 | 24,815 | 26,600 | 22.5% | -1.1% | 9.6% | 7.2% |
|
S & P 500 |
Dec 26 18 2,347 |
May 1 19 2,954 |
2,718 | 2,752 | 2,942 | 25.4% | -0.4% | 8.2% | 6.9% |
| NASDAQ (^ixic) |
Dec 24 18 6,190 |
Apr 29 19 8,176 |
7,510 | 7,453 | 8,006 | 29.3% | -2.1% | 6.6% | 7.4% |
| S & P/TSX Composite TSX (^gsptse) |
Dec 24 18 13,777 |
Apr 23 19 16,673 |
16,278 | 16,037 | 16,382 | 18.9% | -1.7% | 0.6% | 2.2% |
Securities Dealers Automated Quotations (NASDAQ), Toronto Stock Exchange (TSE) and Reuters.
Table: ConstructConnect.
Stock Markets on Roller Coaster Ride Since Last June
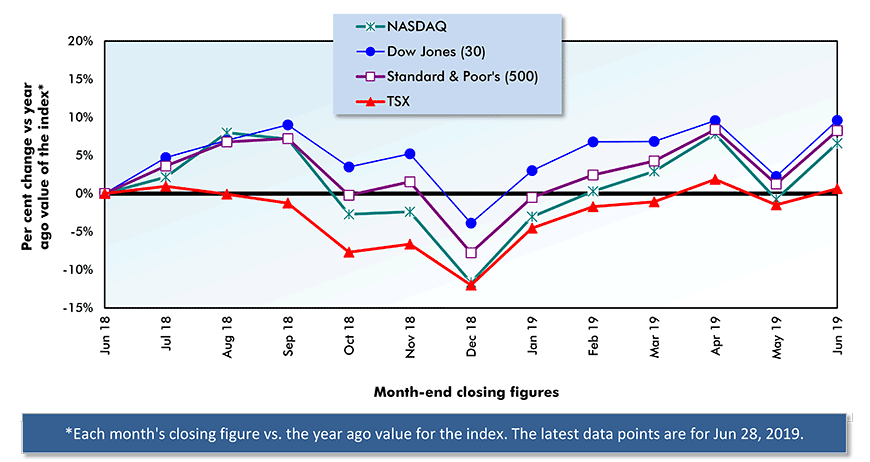
Graph 1 demonstrates, however, that it hasn’t been all peaches and cream for North America’s major stock market indices over the past 12 months. Rather, it’s been a bumpy ride.
Versus June 2018, share prices soared through September 2018. Moves by the Federal Reserve and the Bank of Canada last fall to hike interest rates, however, soon sent a chill through markets. The result was a steep drop in equity price by the end of last year. December’s closing numbers were either in ‘correction’ territory or hovering nearby. A ‘correction’, in stock market parlance, is -10%; a ‘bear’ market is -20%.
Moving into 2019, share prices recovered and improved through April, as central bank interest rate moves were put on hold. But concerns on the foreign trade front, with the U.S. and China locking horns, caused another stutter in May. Most recently, good news from the G-20 summit meeting in Osaka, Japan, has been met positively. There are indications of significant progress in the U.S.-China trade talks. The fond wish is that another round of tariff strikes will be avoided.
1) New York Stock Exchange – Dow-Jones Industrials (30);
2) New York Stock Exchange – Standard and Poor’s (S & P) (500);
3) National Association of Securities Dealers Automated Quotations – NASDAQ Composite Index;
4) Toronto Stock Exchange – S & P/TSX Composite.
Securities Dealers Automated Quotations (NASDAQ), Toronto Stock Exchange (TSE) and Reuters.
Chart: ConstructConnect.
Huge Gains in Stock Prices Since Last Trough
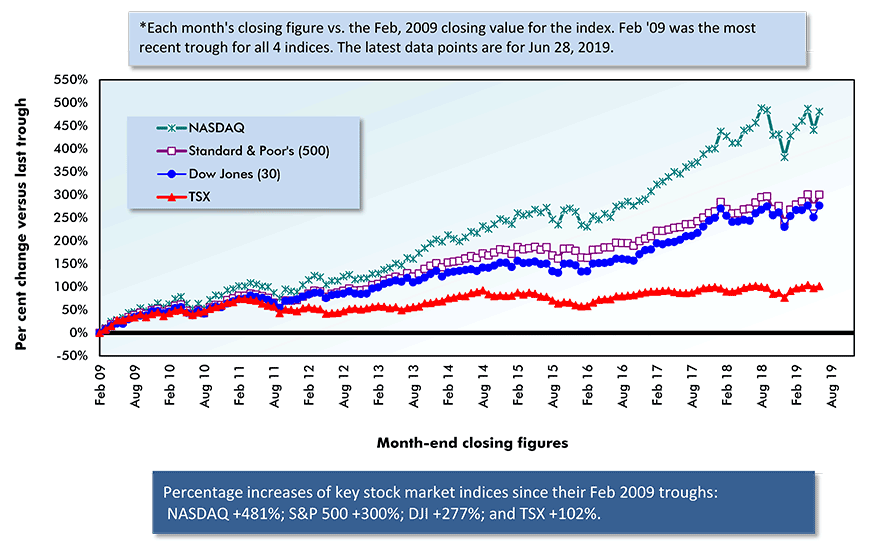
Even with the volatility in share prices over the past year, it’s worth keeping in mind the extraordinary gains that have been achieved in equity markets since the Great Recession. February 2009 was ‘rock bottom’ for all four of North America’s major indices. Since February 2009, the DJI is +277%; the S&P500, +300%; and NASDAQ, +481%.
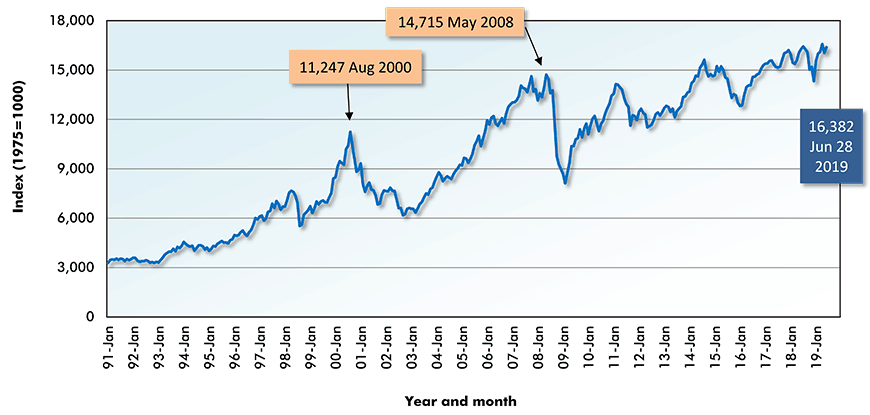
The Toronto stock exchange (TSX) is the laggard in the group. Its June 2019 ‘closing’ value was only +102% compared with its February 2009 level. The TSX has been burdened with weak profit performances from its resource-based companies. In a lackluster world trading environment, commodity prices have been slow to pick up and still sit below their peaks reached in the 00s.
The price of oil, though, has been climbing of late. Escalating geopolitical tensions between the U.S. and Iran in the Middle East are viewed as a threat to the global supply of crude.
Securities Dealers Automated Quotations (NASDAQ), Toronto Stock Exchange (TSE) and Reuters.
Chart: ConstructConnect.
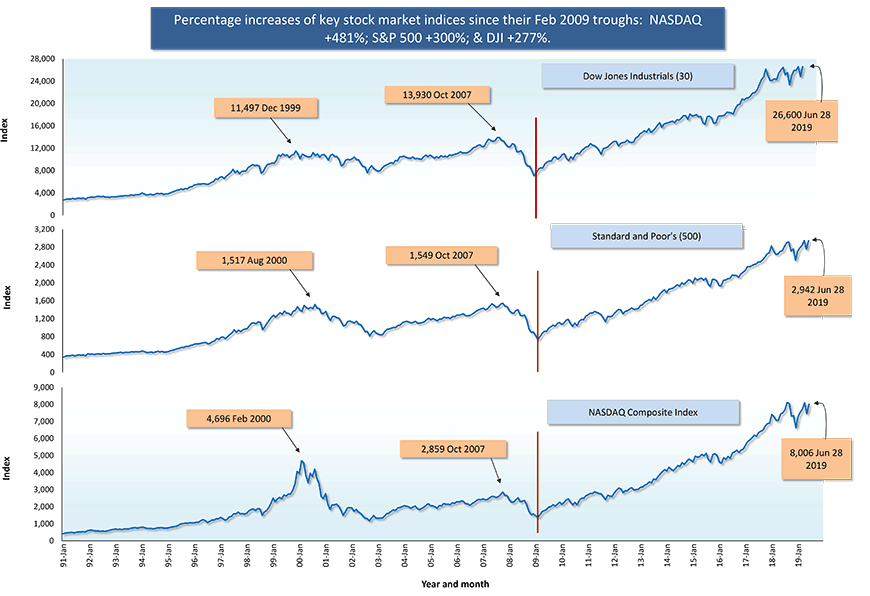
Chart: ConstructConnect.
World Stock Market Action Still Hottest in U.S.
Graph 4 establishes that the hottest stock market action, at least on a year-over-year basis, still resides in America. No other international indices are keeping up with the y/y climbs of +9.6% for the DJI, +8.2% for the S&P 500 or +6.6% for NASDAQ.
The Shanghai composite index is doing next best, at +4.6%. But the trading that drives China’s premier index is nothing like as freewheeling as what occurs elsewhere. There are only large institutional (i.e., government-backed) investors. There are no lively hedge fund or private equity fund managers, or potentially activist smaller investors, to stir the pot.
Hong Kong’s Hang Seng index is -1.4% y/y. Such a decrease is rather sedate given that the local citizenry has been protesting by the hundreds of thousands. They’re opposed to a proposed government measure that would allow extradition of accused criminals to mainland China. The potential for persecution of dissent has set off alarm bells.
London, U.K.’s FTSE index is only -2.8%. That minimal decline is despite a Brexit brouhaha that has forced Theresa May to resign as Prime Minister and sent the Conservative Party on a contentious search for a replacement.
Year over Year as of Month-end Closings, Jun 2019
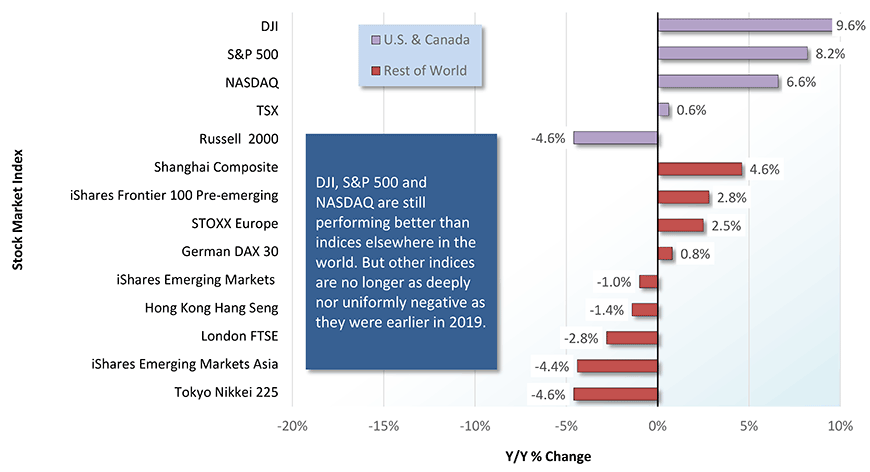
Chart: ConstructConnect.
| Month-end | ||||||||
| Closing Value | Month/ | Year/ | ||||||
| Stock Index: | JUN 28 2019 | Month/ | Year | |||||
| Russell 2000 | 1,567.00 | 7.0% | -4.6% | |||||
| iShares MSCI Emerging Markets Index (EEM): | 42.91 | 5.4% | -1.0% | |||||
| iShares MSCI Emerging Markets Asia Index (EEMA): | 66.16 | 5.7% | -4.4% | |||||
| London FTSE 100 (^FTSE): | 7,426.00 | 3.7% | -2.8% | |||||
| German DAX 30 (^GDAXI) | 12,399.00 | 5.7% | 0.8% | |||||
| STOXX Europe | 38.28 | 3.3% | 2.5% | |||||
| Hong Kong Hang Seng (^HSI): | 28,543.00 | 6.1% | -1.4% | |||||
| Tokyo Nikkei 225 (^N225): | 21,276.00 | 3.3% | -4.6% | |||||
| Shanghai Composite Index (000001.SS) | 2,979.00 | 2.8% | 4.6% | |||||
| iShares MSCI Frontier 100 ETF for pre-emerging markets (FM): | 29.62 | 3.2% | 2.8% | |||||
Table: ConstructConnect.
North America’s Four Major Stock Market Indices Near Historical Highs
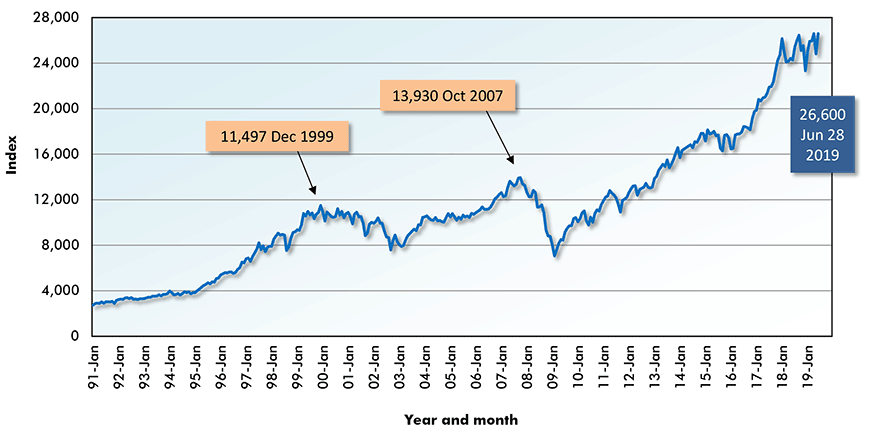
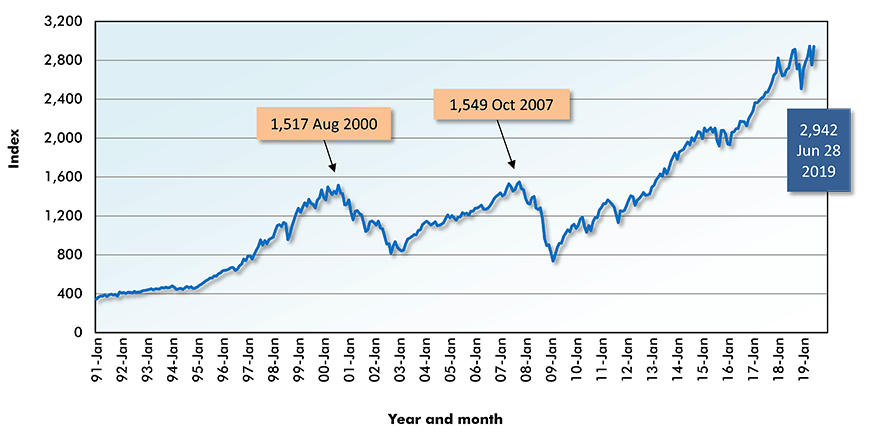
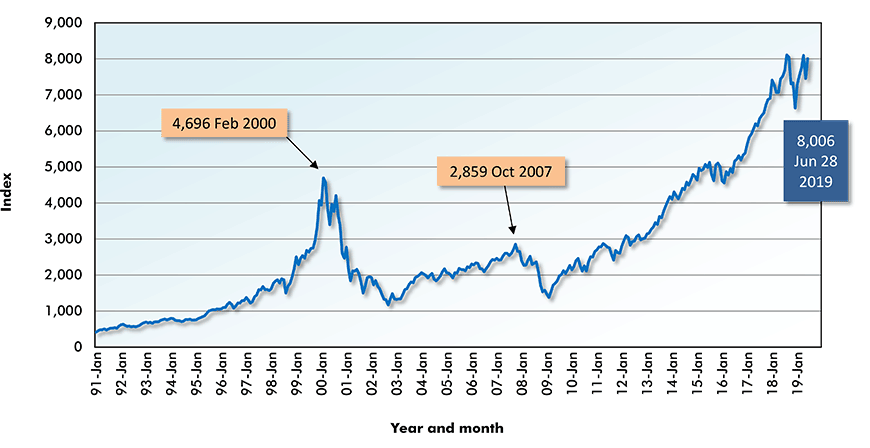
For the sake of reference, Graphs 5 through 8 show the history of index values for the DJI, S&P 500, NASDAQ and TSX since January 1991. The shapes of the curves for the three U.S. indices over the latest ten years look like rocket launches. The Toronto Stock Exchange (TSX), on the other hand, is taking its own sweet time about finding the stratosphere.
Securities Dealers Automated Quotations (NASDAQ), Toronto Stock Exchange (TSE) and Reuters.
Chart: ConstructConnect.
Securities Dealers Automated Quotations (NASDAQ), Toronto Stock Exchange (TSE) and Reuters.
Chart: ConstructConnect.
Securities Dealers Automated Quotations (NASDAQ), Toronto Stock Exchange (TSE) and Reuters.
Chart: ConstructConnect.
Toronto Stock Exchange
Securities Dealers Automated Quotations (NASDAQ), Toronto Stock Exchange (TSE) and Reuters.
Chart: ConstructConnect.


Recent Comments
comments for this post are closed