Tariff Walls are not Fixing America’s Trade Deficit
While it has become the case that consumer spending now accounts for, by far, the major portion of U.S. gross domestic product (GDP), at 70%, foreign trade does still play an important role. Unfortunately, that role ‒ because it is a net figure of a smaller export number minus a bigger import number ‒ is currently a negative or repressive one.
Net foreign trade is a line item in GDP. Fronted by a ‘minus’ sign (-), it detracts from the total. GDP would be much higher if the trade balance was closer to zero, let alone if it was strongly positive.
The problem originates in ‘goods’ trade rather than ‘services’ trade. America’s ‘goods’ foreign trade balance in September was -$860 billion annualized. It was alleviated somewhat by a ‘services’ surplus of +$231 billion.
Graph 1 shows a ‘goods and services’ trade balance that has worsened over the past year and a half and is now in depths close to what was being experienced from 2006 to 2008, immediately before the Great Recession.
Particularly concerning is the fact that trade deterioration has occurred even as restrictive trade measures, in the form of tariff barriers on imports, have been set in place. Clearly, this strategy has not been working.
Graph 1: United States’ Foreign Trade: Goods and Services Balance − September 2019
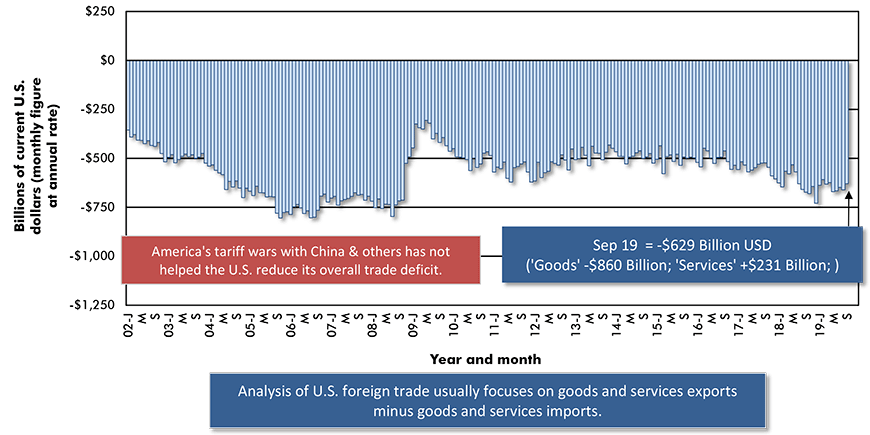
The last data point is for September 2019.
Based on seasonally adjusted monthly figures, projected at an annual rate.
Data source: Bureau of Economic Analysis (BEA).
Chart: ConstructConnect.
An End in Sight to U.S.-China Trading Tiff?
Projections of world economic growth are being revised downwards, with the increased presence of restrictive trade measures sourced as a primary cause. Two export-dependent nations, China and Germany, are displaying economic weakness, with growth slowing significantly in the former and flatlining in the latter.
When major economies falter, unfortunate ripple effects are felt everywhere. Other nations, especially ones with large natural resource sectors, are unable to realize their full potential due to languishing demand for and prices of commodities.
America’s trading relationship with China has taken numerous interesting turns of late. For several months in the spring of this year, the proportion of the U.S. ‘goods’ trade deficit that was tied to China dropped below 40%. More recently, however, it has risen again. In September it was 43.8% (Graph 2).
The Trump Administration and China’s government have announced a first-phase agreement to ease their trade tensions. Stock markets have reacted with glee. But this game has been played before. Are circumstances truly different now as opposed to previous occasions?
Will the recent positive pronouncements lead to lasting progress? The likelihood does seem greater. Neither the U.S. nor China can afford a prolongation of their trading tiff.
Graph 2: Geographic Sources of Total U.S. Foreign Trade Deficit in Goods − September 2019
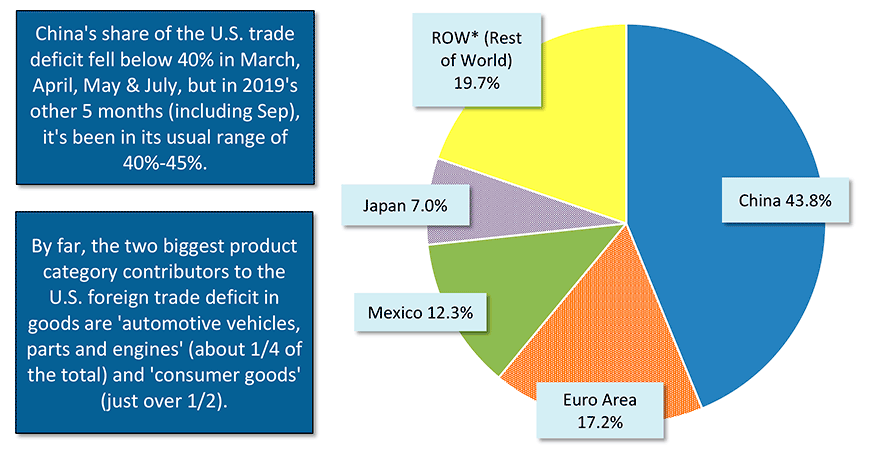
*Major contributors to ROW deficit are South Korea, Taiwan, India and Malaysia.
Data source: U.S. Census Bueau and Bureau of Economic Analysis (BEA).
Chart: ConstructConnect.
U.S. Trade Shortfall in Autos Arises Mainly with Mexico and Japan
By product categories, half of the U.S. trade deficit is in consumer goods and that’s where trade with China is most problematic. Next in line, as a contributor to America’s trading shortfall, is the ‘motor vehicles and parts’ designation. One-quarter of the U.S. trade deficit arises in the automotive sector.
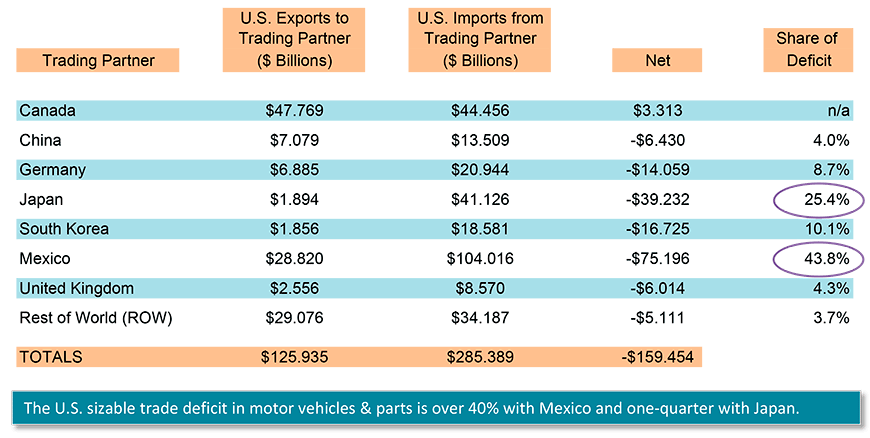
Graph 3 makes clear that most of the U.S. trading shortfall in motor vehicles and parts is with just two countries, Mexico and Japan. As a proportion of the combined negative figure from all countries with which the U.S. is running an auto sector deficit, Mexico’s share is 43.8%.
Japan’s slice of America’s total auto sector trading deficit is presently 25.4%, or one-quarter.
South Korea and Germany account for 10.1% and 8.7% respectively. China, with 4.0%, is barely a factor. It’s on a par with the United Kingdom, 4.3%.
Then there’s Canada. The Canadian auto sector often came under fire from Washington and was threatened with U.S. tariffs during the tough negotiations leading up to the new USMCA pact to replace NAFTA.
Graph 3 asks, “What was all the fuss about?” The U.S. is currently running a slight surplus in its motor vehicle and parts trade with its northern neighbor.
Provisions within the USMCA should reduce the trading disparity between the U.S. and Mexico in the auto sector. Interestingly, Mexico, among the three signing nations, is closest to ratifying the new trading arrangement.
Graph 3: U.S. Foreign Trade in Motor Vehicles & Parts − September 2019 Ytd
Data source: Census Bureau and Bureau of Economic Analysis (BEA).
Chart: ConstructConnect.
Oil No Longer the Culprit in U.S. Foreign Trade Woes
Consumer goods and auto-related products have been the main areas where the U.S. is encountering its steepest exports-to-imports shortfalls. Surprisingly absent is oil.
The U.S. economy used to be hugely dependent on foreign crude. In the ‘old days’, U.S. oil imports, especially from OPEC, and specifically from the Middle East, were enormous.
But in the mid-00s, U.S. oil imports reached their peak (Graph 4) and they’ve been declining dramatically ever since. They’re presently down by about one-third from their all-time high.
Through tapping new reserves, most notably in shale rock, America’s own domestic supplies of oil and natural gas have been greatly expanded. Conservation efforts have also been critical in reducing the U.S. need for outside sources of energy.
Graph 4: Canada vs OPEC as Source of U.S. Annual Oil Imports
From Time of 1973 OPEC Oil Embargo
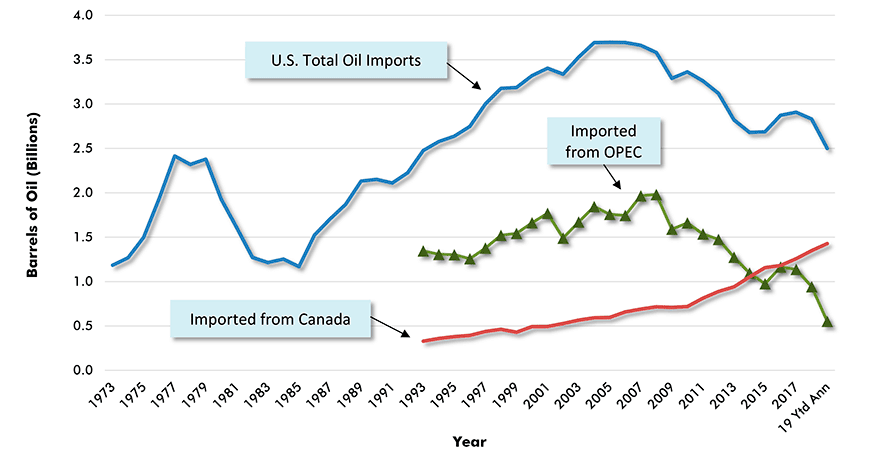
“19 Ytd Ann” is 2019 year to date annualized. Other major sources not shown include Mexico, Colombia, Russia and Brazil. Individual country data is not available prior to 1993.
Data sources: Census Bureau, Bureau of Economic Analysis (BEA) & Energy Information Administration (EIA).
Chart: ConstructConnect.
Canada and Russia Escape U.S. Oil Import Downdraft
To date in 2019, versus January-September 2018, U.S. oil imports, in number-of-barrels, from some key supplier countries have been: Mexico, -13.5%; Saudi Arabia, -38.0%; Iraq, -40.6%; Nigeria, -7.6%; Brazil, -8.7%; and Venezuela, -77.5% (Chart 5).
Total U.S. oil imports are -11.7%. From OPEC, they’re -41.4%.
One country stands out for surviving the downdraft. U.S. year-to-date oil imports from Canada are +5.9%. Canada’s share of the U.S. import total has climbed above half to sit at 55.0% (Graph 6). Second-place Mexico and third-place Saudi Arabia are far back, at 8.7% and 7.7% respectively.
Another country with a big jump in oil shipments to the U.S. has been Russia, +91.2% (i.e., a doubling), although its share of total imports, at 2.1%, remains minor.
America has become an international energy powerhouse, with more thought being given to export potential than import concerns. Several of the largest construction projects being carried out in the nation at this time ‒ e.g., Golden Pass LNG export terminal in Texas ($10 billion) and Calcasieu Pass LNG project in Louisiana ($4.5 billion) have foreign customers foremost in mind.
Graph 5: Top Dozen Suppliers of U.S. Oil Imports − September 2019
Year-to-date (Ytd)
| Ytd 2019 | Ytd 2019 | ||
| Barrels | versus | ||
| Rank | Country | (000s) | Ytd 2018 |
| 1 | Canada | 1,001,978 | 5.9% |
| 2 | Mexico | 157,962 | -13.5% |
| 3 | Saudi Arabia* | 139,907 | -38.0% |
| 4 | Iraq* | 89,550 | -40.6% |
| 5 | Colombia | 84,719 | 7.2% |
| 6 | Ecuador* | 48,810 | 8.0% |
| 7 | Nigeria* | 47,090 | -7.6% |
| 8 | Brazil | 40,004 | -8.7% |
| 9 | Russia | 38,545 | 91.2% |
| 10 | Venezuela* | 27,133 | -77.5% |
| 11 | United Kingdom | 20,321 | 21.7% |
| 12 | Norway | 18,361 | 36.5% |
| Imports from the 12 above: | 1,714,380 | -9.5% | |
| Imports from OPEC | 409,055 | -41.4% | |
| All U.S. oil imports: | 1,820,240 | -11.7% | |
* Denotes OPEC nations.
Data source: U.S. Bureau of Economic Analysis (BEA).
Chart: ConstructConnect.
Graph 6: Foreign Sources of U.S. Imported Oil
% of Total Barrels Year to Date − Jan-Sep 2019
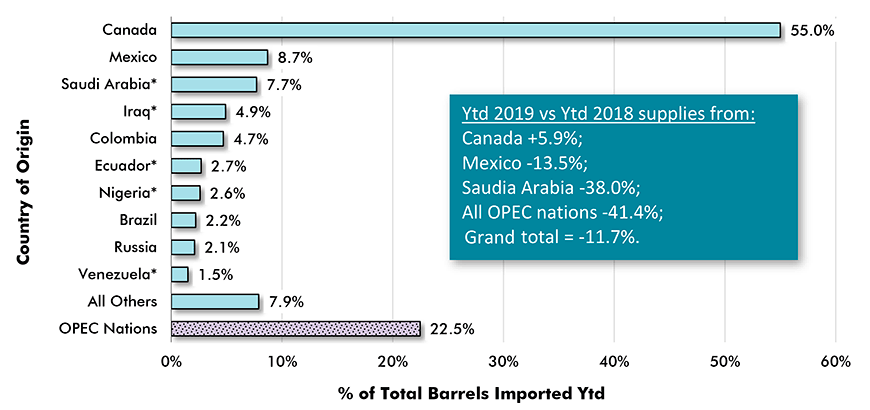
* Asterisk indicates the country is an OPEC member.
Data source: Census Bureau & Bureau of Economic Analysis (BEA).
Chart: ConstructConnect.
Export Sales Strength in Texas and South Carolina
In the current climate of lessened expectations concerning foreign trade, some states have fared more poorly than others. There have also been some others that have managed to still do okay.
Graph 7 ranks states by their export sales, year-to-date in 2109 compared with the same January-to-September period of 2018.
After frontrunner Texas (+4.9%), ‒ which owes its uptick mainly to exports of energy products, but also to ‘aircraft/spacecraft’ products ‒ the next eight states have all experienced declines.
Among the eight states with year-to-date declines, the one beaten up the most has been Washington, -22.2%. Washington’s export difficulties are primarily to be found in the ‘aircraft/spacecraft’ sector.
Production at Boeing’s Washington plant has been adversely affected by the U.S.-China trade conflict. Beijing is Boeing’s biggest foreign buyer. Moreover, longer than expected delays in obtaining recertification for the company’s accident-prone 737 Max jet have hindered sales to airlines based in other corners of the world.
The result for one other state pops out in Graph 7, South Carolina’s +21.7%. The surge in South Carolina export sales has come in ‘aircraft/spacecraft’, +82.5%, with a hearty assist from ‘vehicles’, +13.3%. Boeing Co. has a Charleston plane-making campus and BMW in Spartanburg has produced the most vehicles for export among all U.S. car plants since 2014.
In nominal dollars, Texas ($244 billion through 2019’s Q3) leads all states for export sales by a vast margin. Even next-place California ($129 billion) has only a little more than half of the volume generated by Texas. Then it’s another big step down to third-ranked New York ($55 billion).
Graph 7: Origins of U.S. Goods Exports by State ‒ Top Dozen
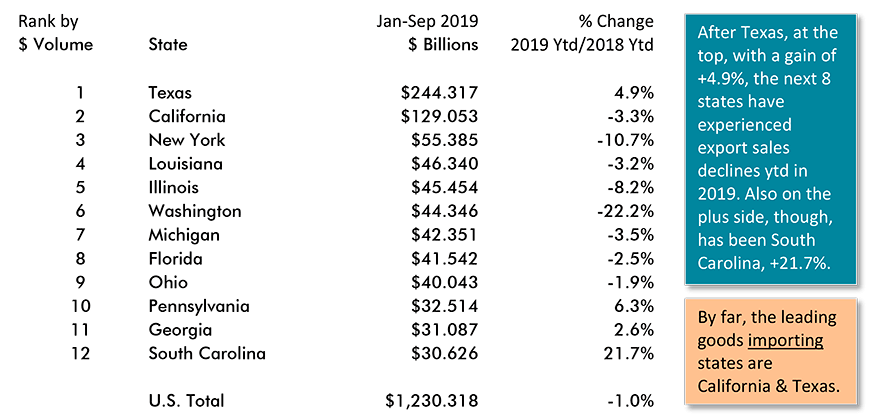
Falling just short of making the list is Indiana, at $30.1 billion and +2.0%.
Data source: U.S. Bureau of Economic Analysis (BEA).
Chart: ConstructConnect.
Underperforming Global Trade Places Straitjacket on Canada’s Economy
From Graph 8, Canada’s foreign trade difficulties also appear entrenched and serious. Prior to the recession, Canada consistently ran a sizable surplus. Since the recession, the nation’s merchandise trade balance has registered almost nothing but deficits.
Weak commodity prices resulting from underperforming global trade have placed a straitjacket on how well Canada’s economy can perform.
The world price of oil once soared to $140 USD per barrel. Most recently, it’s been less than half that level, near $60 USD per barrel.
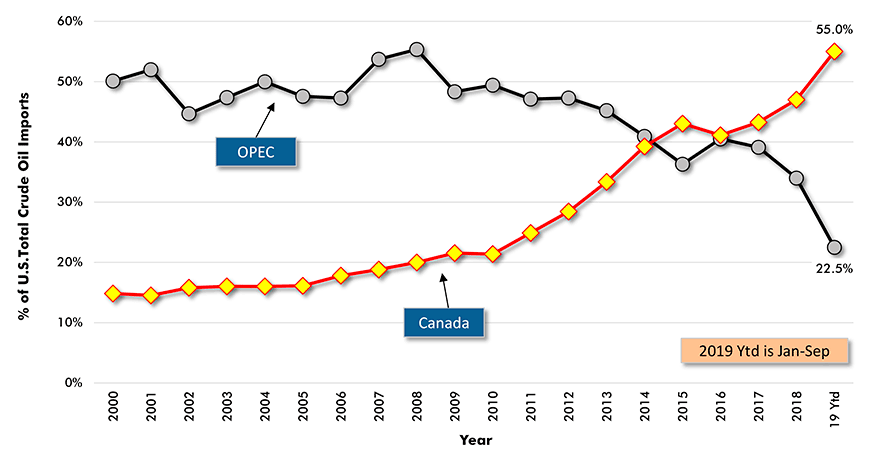
It would be ungracious for Canadian crude producers to complain about the share of U.S. oil imports they are being allotted. Chart 9 spotlights that their share of U.S. total oil imports has risen from just under 15% in 2000 to 55% at present. Meanwhile, OPEC’s share has diminished from 50% to 22.5%.
Furthermore, the number of barrels of Canadian oil shipped across the border, now often by railcar, has been climbing steadily ‒ a positive development independent of price.
Nevertheless, for much of Canada’s investing community, the prospect of shipping more oil south through the proposed northern portion of the Keystone XL pipeline and/or Enbridge’s Line 3 is tantalizing. But enthusiasm must be restrained by the realization that all such endeavors, these days, inevitably face delays and sidelining by protests and court challenges.
The Trans Mountain oil pipeline expansion from Edmonton, Alberta to Burnaby, B.C. is set to get underway, but only time will tell if it can successfully navigate the ‘rapids’ posed by ongoing native land claim issues and the disapproval of environmentalists.
Graph 8: Canada’s Foreign Trade: The Merchandise Trade Balance − September 2019
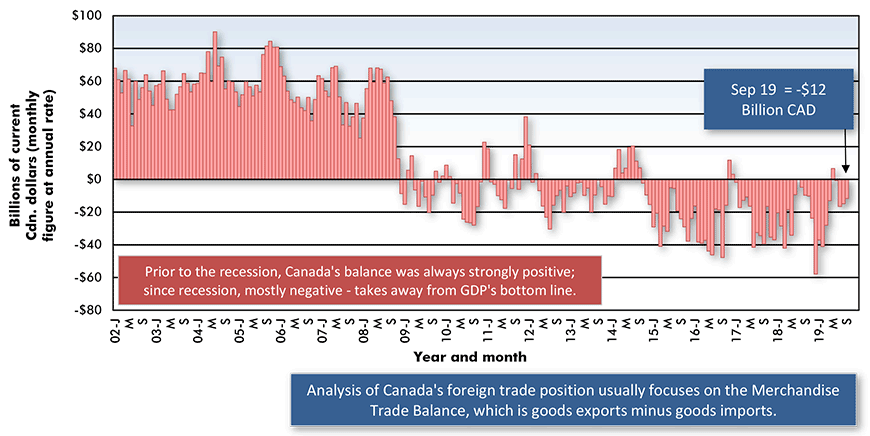
The last data point is for September 2019.
Based on seasonally adjusted monthly figures, projected at an annual rate.
Data source: Statistics Canada.
Chart: ConstructConnect.
Graph 9: Shares of U.S. Total Oil Imports (Barrels)
Sourced from OPEC and Canada
Data sources: Census Bureau, Bureau of Economic Analysis (BEA) & Energy Information Administration (EIA).
Chart: ConstructConnect.
Provincial Struggles with Energy and Forestry Product Exports
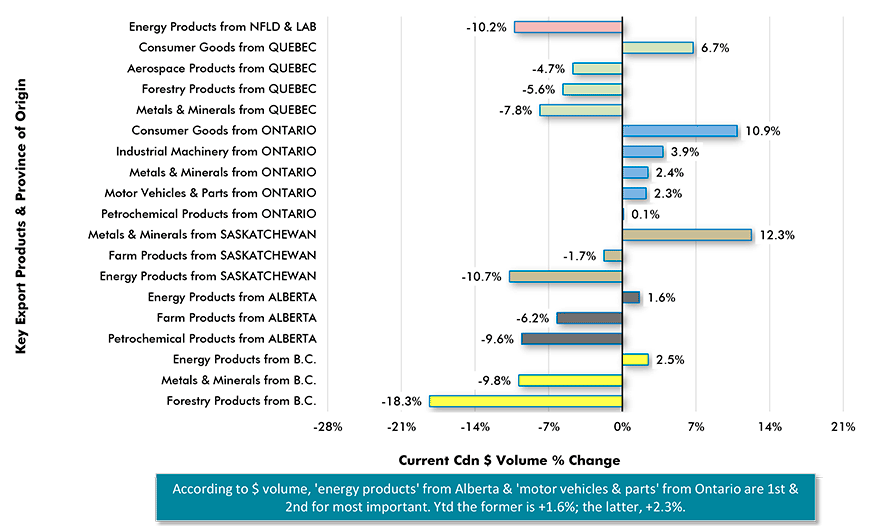
Graph 10 focuses attention on Canada’s key export products by province of origin. The horizontal bars record percentage changes, either positive or negative, for year-to-date 2019 over year-to-date 2018.
The biggest percentage increases, both in double digits, have been registered by ‘metals and minerals’ (i.e., potash) from Saskatchewan, +12.3%, and ‘consumer goods’ from Ontario, +10.9%.
The steepest percentage drops have been recorded in ‘energy products’ from Newfoundland and Labrador, -10.2%; ‘energy products’ from Saskatchewan, -10.7%; and ‘forestry products’ from British Columbia, -18.3%.
B.C.’s foreign lumber sales have been facing headwinds from U.S. import restrictions (i.e., with expiry of the ‘softwood lumber agreement’), a relatively soft U.S. new homebuilding market, and supply limitations caused by insect infestation (i.e., the infamous pine beetle).
Quebec’s forestry product exports are also down, -5.6%.
By dollar volume, the two most important provincial export categories are ‘energy products’ from Alberta and ‘motor vehicles and parts’ from Ontario. The former is currently +1.6% and the latter, +2.3%.
Graph 10: Canada’s Key Export Product Sales by Province Ytd −
Jan-Sep 2019 vs Jan-Sep 2018
Data source: Statistics Canada Table 12-10-0119-01.
Chart: ConstructConnect.
Export Shares to Population Shares ‒ Cheers for Alberta; Laments for Quebec & B.C.
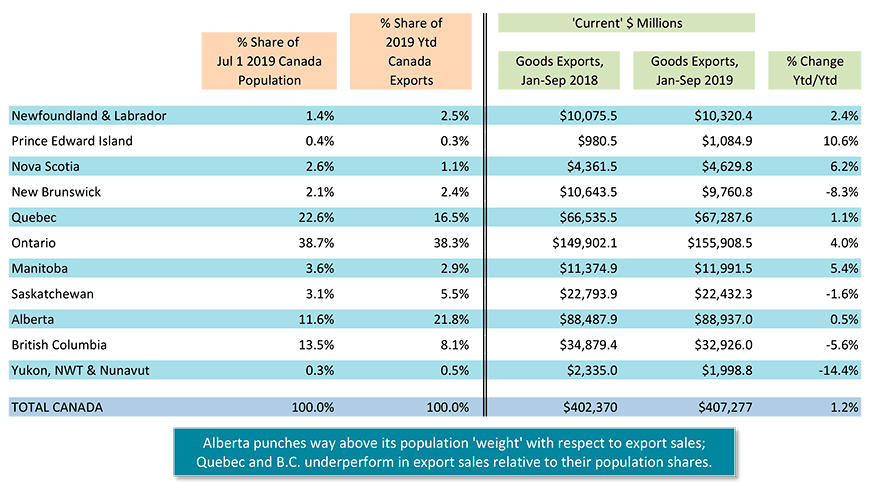
The right-hand side of Graph 11 shows total export sales to date this year versus January-September of last year for each province. The four winners are Prince Edward Island, +10.6%; Nova Scotia, +6.2%; Manitoba, +5.4%; and Ontario, +4.0%.
But it’s the first two columns of Graph 11 that may be of most interest. Columns one and two set out, for each province, its share of the nation’s total population side-by-side with its share of the nation’s total exports.
One province is ‘punching’ way above its weight in exports relative to its population, Alberta (21.8% for exports to 11.6% for population).
Two provinces are not claiming export shares commensurate with their populations, Quebec (only 16.5% for exports to 22.6% for population) and B.C. (only 8.1% for exports to 13.5% for population).
To improve its export game, the government of Quebec wants to sell more electricity to American northeastern states.
B.C.’s hopes for more export sales are heavily tied to creation of LNG terminal facilities near Kitimat along the province’s Pacific Coast.
Graph 11: Total Goods Exports by Province and Region
‘Current’ $s are unadjusted for inflation (i.e., as opposed to ‘constant’ $s).
Data Source: Statistics Canada Table 12-10-0119-01
Chart: ConstructConnect.
Alex Carrick is Chief Economist for ConstructConnect. He has delivered presentations throughout North America on the U.S., Canadian and world construction outlooks. Mr. Carrick has been with the company since 1985. Links to his numerous articles are featured on Twitter @ConstructConnx, which has 50,000 followers.


Recent Comments
comments for this post are closed