Participation Rate Uptick
Similar to the U.S., Canada managed a big increase in total employment in May, +290,000 jobs according to Statistics Canada. Unlike the U.S., however, Canada’s unemployment rate (seasonally adjusted) climbed rather than fell, reaching 13.7% versus April’s figure of 13.0%.

Contributing to the rise in the unemployment rate was an uptick in the ‘participation rate’ to 61.4% from 59.8%. A higher participation rate means more people who formerly weren’t looking for work (and therefore weren’t counted as unemployed) were back in the jobs hunt.
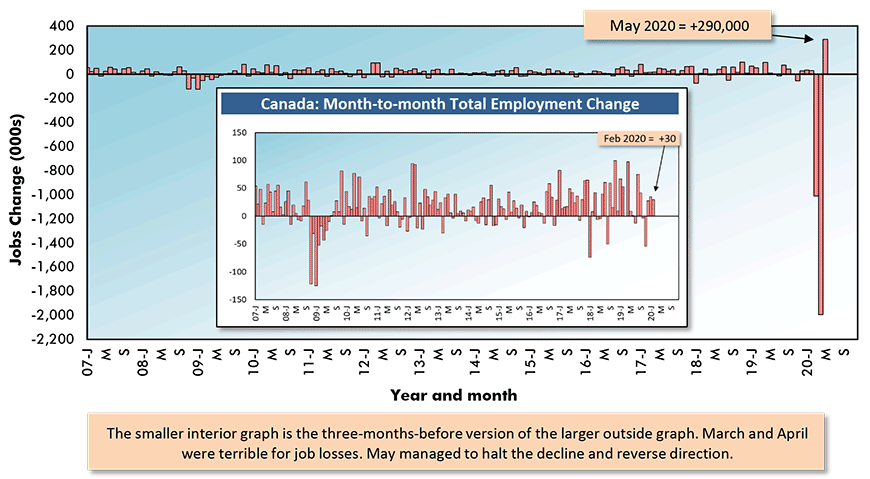
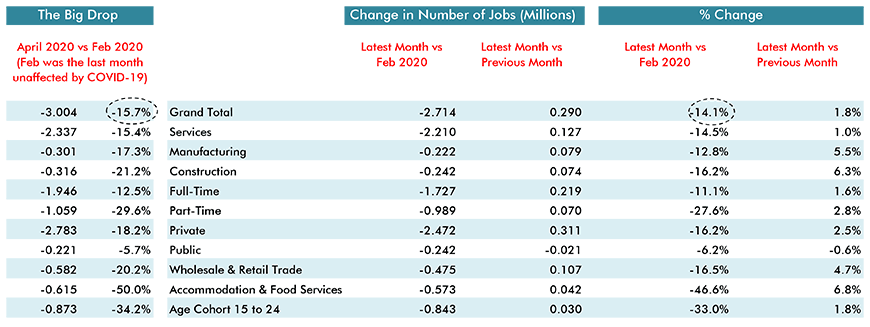
The huge job-count drops resulting from coronavirus-related shutdowns occurred in March and April. Those two months were brutal. But beginning with May, a primary task will be to monitor how much of March-April’s jobs slide is being retrieved. That’s what Table 1 is specifically designed to do.
Graph 1: Canada: Month-to-month Total Employment Change

Chart: ConstructConnect.
Interactive Visual
Baby Steps Towards Reducing Job Losses
The two columns on the left-hand side of Table 1 show the benchmark figures ‒ i.e., the March-April declines in jobs both in terms of level and percent change. The base period in the calculation is February 2020, since that was the most recent month left untouched by COVID-19 staffing cutbacks.
Whereas the total jobs loss from February to April in the U.S. was -20.5 million, in Canada it was -3.0 million. The U.S. percentage decline was -13.5%. Canada’s was slightly more outrageous at -15.7%.
In both countries, it was hotels/motels and restaurants/bars ‒ categorized within the ‘leisure and hospitality’ sector in the U.S. and ‘accommodation and food services’ in Canada ‒ which shed personnel to a previously unimaginable degree, -46.8% in America and -50.0% in Canada. In other words, half of such employment vanished within two months in both countries. No other sector was dealt with as harshly.
Also noteworthy from Table 1 was the one-third (-34.2%) plummet in jobs held by young people, aged 15 to 24, from February to April. Young adults were particularly susceptible to the staffing reductions undertaken by hotel/motel and restaurant/bar owners.
With the nearly-three-hundred-thousand gain in total Canadian jobs in May, the shortfall versus February has now improved from -15.7% to -14.1%.
Surprisingly, manufacturing has taken a commendable stab at restoring employment, moving from -17.3% to -12.8%. Construction has also managed a decent reduction in its decline, going from -21.2% to -16.2%.
May’s month-to-month jobs changes in manufacturing and construction were +5.5% and +6.3%.
Table 1: Monitoring the Canadian Employment Recovery ‒ May 2020

Table: ConstructConnect.
Manitoba and New Brunswick Labour Markets Best among Provinces
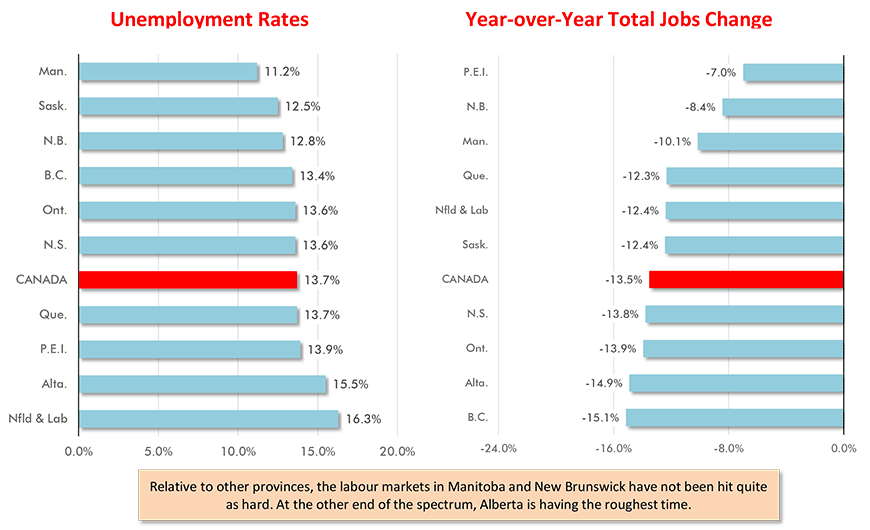
In May, Manitoba (+11.2%) recorded the lowest unemployment rate among the provinces. At the other end of the spectrum, Alberta (15.5%) and Newfoundland and Labrador (16.3%) had alarmingly high jobless rates.
Volatility in resource sectors (fisheries, mining and offshore oil) can often drive Newfoundland and Labrador’s unemployment rate sky high. As an extra negative, though, tourism traffic to The Rock has dried up. (No-one’s been traveling anywhere with the coronavirus on the prowl.)
Alberta’s high unemployment rate is unusual and signals deep distress in the energy sector.
As for year-over-year employment changes, none of the provinces recorded an increase in the latest month. Prince Edward Island pulled off the smallest decline, -7.0%. British Columbia and Alberta were nearly tied for worst, with the former at -15.1% and the latter, -14.9%.
On a month-over-month jobs change basis, all provinces except Ontario registered increases. Ontario was -1.0% m/m. Quebec had the strongest advance, +6.5% m/m, followed by New Brunswick, +5.4%.
Among all provinces, the coronavirus hamstrung the economies of Ontario and Quebec the most in March-April. The severity of the outbreak was greater in Quebec than in Ontario, but it’s Quebec that is allowing day-to-day business operations to rev up again faster.
Graph 2: Canada’s Provincial Labour Markets – May 2020

Chart: ConstructConnect.
Alex Carrick is Chief Economist for ConstructConnect. He has delivered presentations throughout North America on the U.S., Canadian and world construction outlooks. Mr. Carrick has been with the company since 1985. Links to his numerous articles are featured on Twitter @ConstructConnx, which has 50,000 followers.


Recent Comments