High Tech Stocks Ride to the Rescue
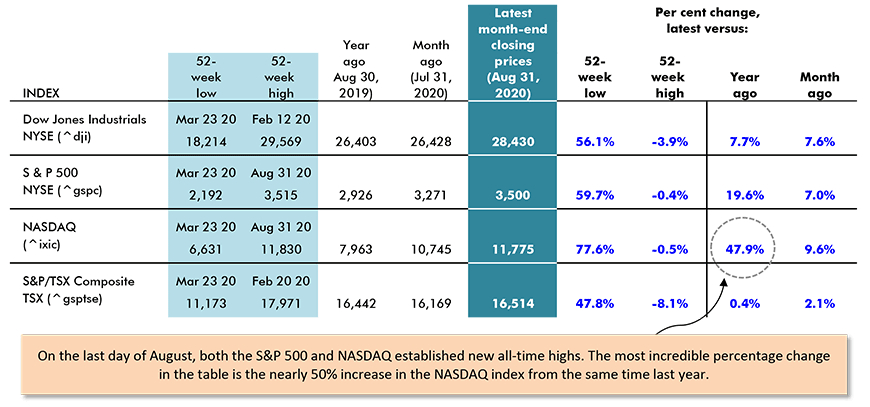
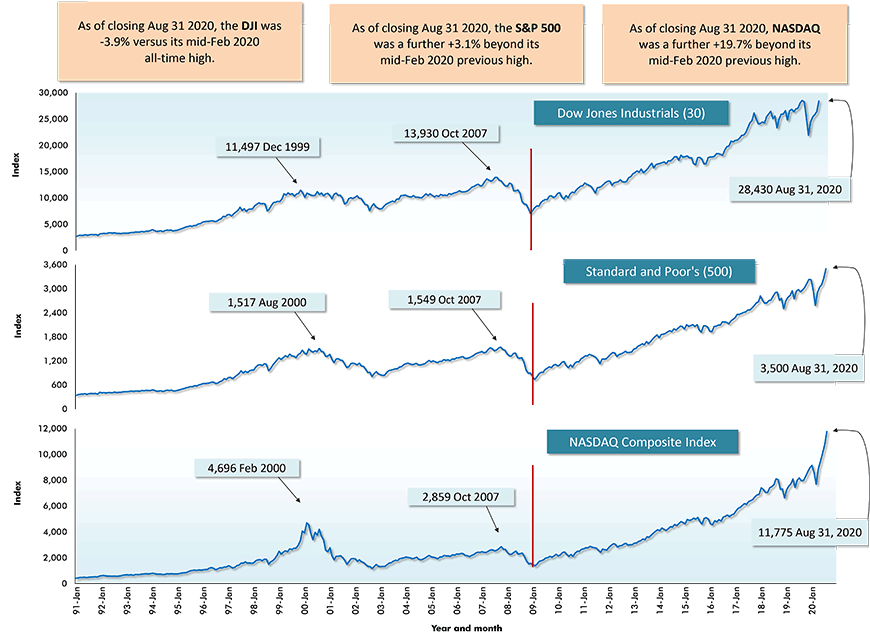
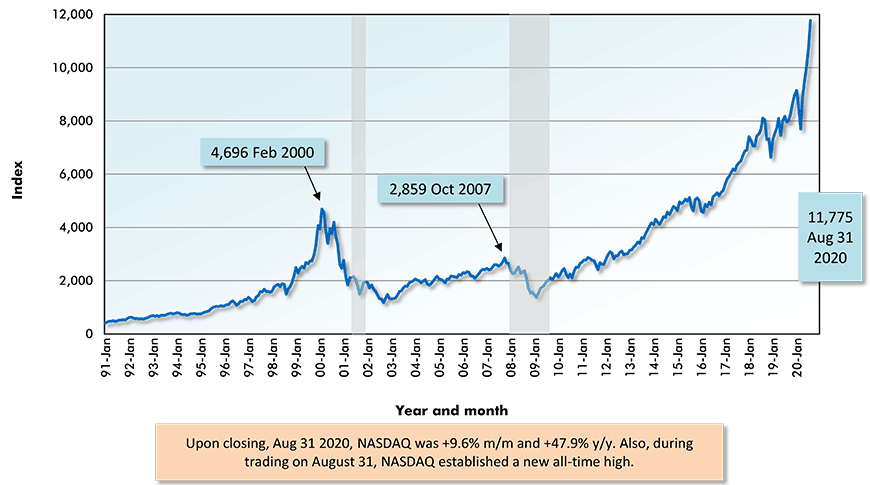
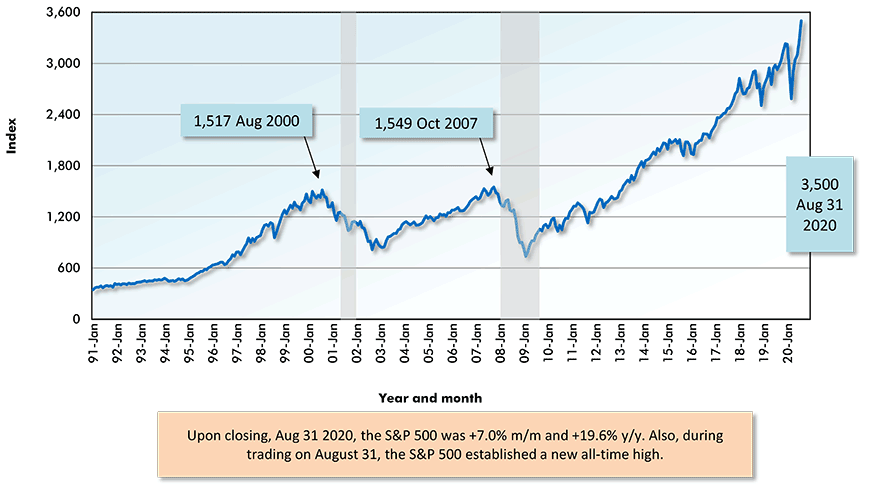
Table 1 below shows several of the key metrics for four major U.S. and Canadian stock market indices. In August, two of the four indices managed to soar to new all-time highs, the S&P 500 and NASDAQ. Furthermore, they reached those summits during trading on the final day of the month, indicating that further upward movement might be expected in early September at least.
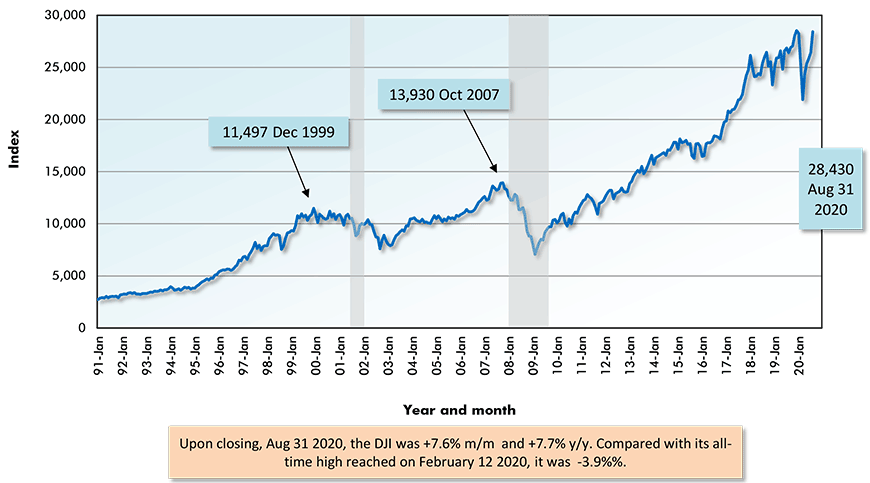
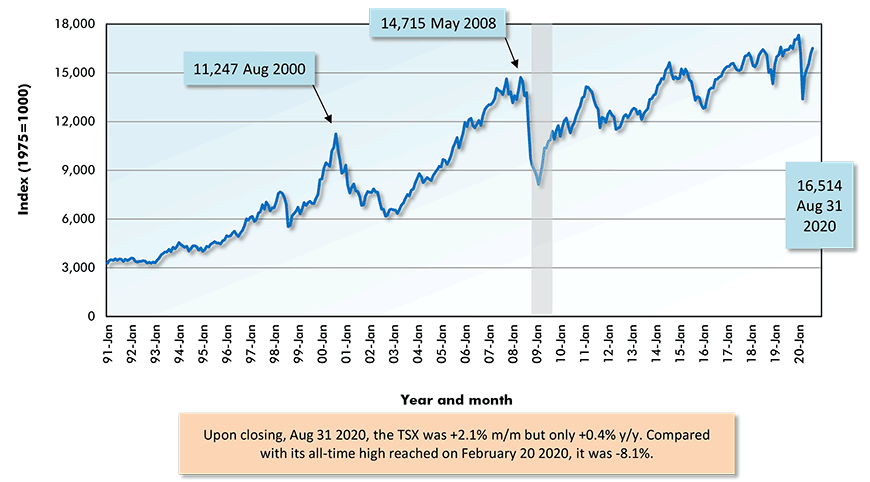
As of closing on August 31, the DJI was -3.9% compared with its all-time peak, which isn’t much of a gap. The Toronto stock exchange was a little further behind relative to its record high achieved on February 20, 2020, -8.1%.
The most astonishing number in Table 1 is NASDAQ’s climb of nearly +50% compared with August 30th of a year ago. Second best for year-over-year increase was the S&P 500, at a jump of about one-fifth (+19.6%). But a one-fifth gain, while impressive on its own, falls considerably short of a one-half gain. NASDAQ has truly been a phenomenon.
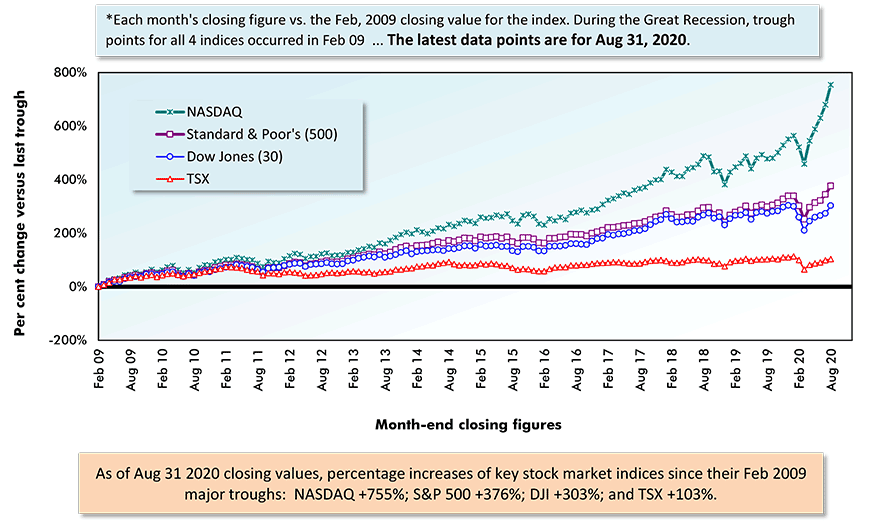
Also, consider the following (and see Graph 1). Since February 2009, which marked the last major trough point for all the indices, NASDAQ is currently +755%; the S&P 500 is +376%; DJI, +303%; and the TSX, +103%.
The economy has taken a battering from the coronavirus incursion but consider how much worse matters would be without the tools now available to the community at large as a result of high-tech innovation.
Many of the companies that have been on the cutting edge of those innovations are listed on NASDAQ. Moreover, they have their head offices in the U.S., giving America a tremendous advantage over other international economies, but more on that subject in a moment.
Securities Dealers Automated Quotations (NASDAQ), Toronto Stock Exchange (TSE) and Reuters.
Table: ConstructConnect.
Securities Dealers Automated Quotations (NASDAQ), Toronto Stock Exchange (TSE) and Reuters.
Chart: ConstructConnect.
Explosive Success of FAAMG Stocks and of Zoom
The biggest high-tech firms by market capitalization are the FAAMG group of companies. FAAMG is comprised of Facebook, Apple, Amazon, Microsoft and Google (which is more accurately Alphabet, but that wrecks the acronym).
All five companies are in NASDAQ. Furthermore, as Graph 2 shows, four of the five FAAMG companies have experienced year-over-year equity value increases even stronger than the overall NASDAQ index (+47.9%). Apple has registered +163.4%; Amazon, +95.4%; Microsoft, +68.1%; and Facebook, +63,0%. Only Google/Alphabet has fallen short, +41.7%, but who’s going to quibble long about that kind of leap.
Not so far back there was a race to determine which company would become the first to reach a market valuation of $1 trillion. Apple has taken that to the next level. It has surpassed $2 trillion. Also, Apple has just implemented a 4-for-1 share split.
With all the emphasis currently being placed on high-tech advances, a surge in start-up IPOs in the sector might be expected.
Also interesting to note is that Zoom, which facilitates video conferencing, has just reported a revenue increase of +350% and a net profit advance of +3,300%, Q2 versus Q1.
Zoom Video Communications (ZM) is listed on NASDAQ. The company has grown from having 10 million users per day at the beginning of this year to 300 million presently.
Here’s a perfect illustration of how the pandemic has turned the economy on its head. Zoom’s success has not gone unnoticed by investors. Its valuation now exceeds the combined market value of America’s four largest airlines.
(Each day’s closing value compared with Sept. 3 2019 (i.e., year-ago) value)
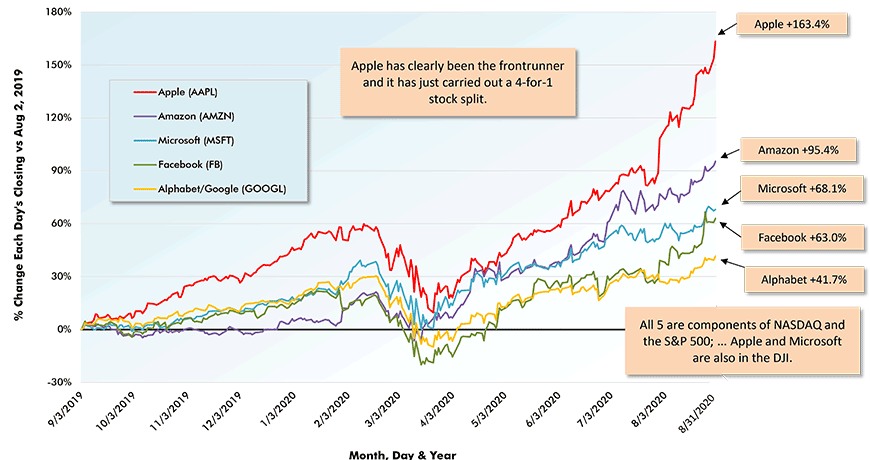
Chart: ConstructConnect.
Role of Savings Rate in Equity Prices and New Home Construction
Another explanation for why U.S. share prices have been doing so well lies in the ‘savings’ rate.
Household expenditures on services (e.g., personal care, restaurant meals, trips out of town, nights out at the theater or a concert, etc.) have declined markedly. ‘Savings’ are a residual, incomes minus expenditures. Simple math says savings must be heftier than previously.
In fact, that’s what the statistics verify. The official annual U.S. savings rate over the past many decades has averaged between 8% and 9%. In April of this year, with the economy in a self-induced coma, it shot up to 34%. In the two summer months of 2020, and with the economy re-opening somewhat, the savings rate has eased a bit, but remains elevated at just under 20%.
The extra cash on hand represented by the high savings rate, when used to buy shares and mutual funds, has helped push stock prices upwards. It has also aided potential home buyers to accumulate the amounts needed for a down payment in the residential real estate market, boosting resale home buying and new home groundbreaking activity.
Securities Dealers Automated Quotations (NASDAQ), Reuters & Yahoo.
Chart: ConstructConnect.
Globally, U.S. Stocks No Longer the Only Game in Town
Leaving aside the NASDAQ index, which is in an upbeat class of its own, some other stock market indices around the world have been competing favorably with the S&P 500 and the DJI.
From Table 2, double-digit percentage increases have been recorded by the ‘iShares Emerging Markets Asia’ index, +21.2%; the Shanghai Composite, +17.7%; ‘Tokyo Nikkei 225’, +11.8%; and ‘iShares Emerging Markets’, +10.8%. The ‘German DAX 30’ has also been making some noise, +8.4%.
The U.S. continues to struggle in its efforts to contain the coronavirus outbreak. Consequently, some other major economies have realized more advanced stages of recovery than America. China is the prime example.
The delayed recovery is one factor that may dampen the value of the U.S. dollar in international currency markets. Another will be the ultra-low interest rate regime promised over the long haul by the Federal Reserve. Plus, there’s also the matter of the huge government debt that is being rung up in the U.S., and which many currency traders find worrisome.
There’s a flip side to a diminishment of U.S. dollar strength. It will provide an incentive for foreign customers to buy more of what American firms have to offer.
Year over Year as of Month-end Closings, August 31, 2020
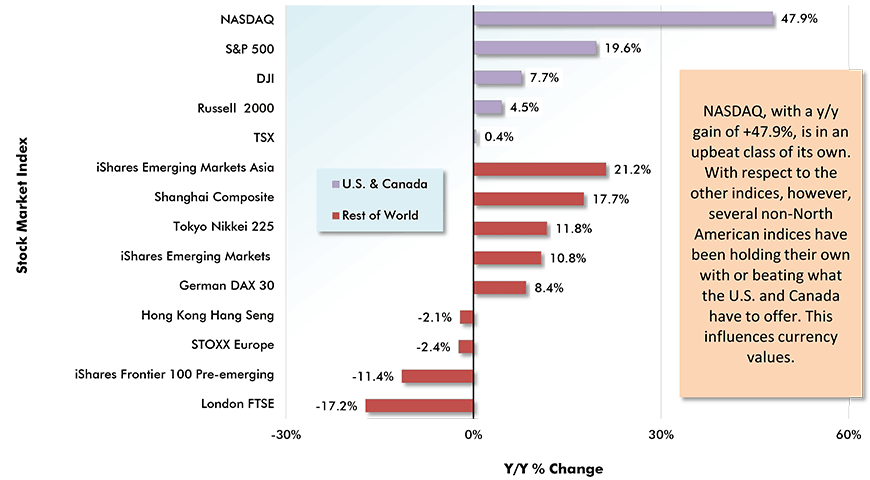
Chart: ConstructConnect.
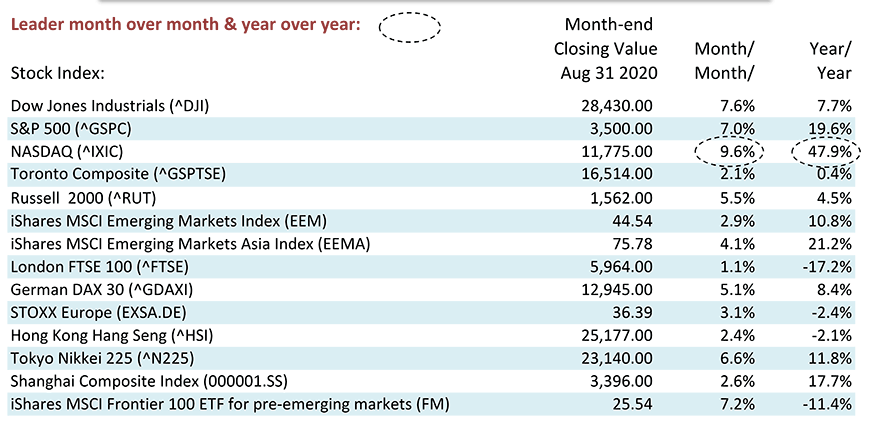
Table: ConstructConnect.
Political Uncertainty Nearly Everywhere
Concerning where to invest these days, politics isn’t providing any easy answers. There is uncertainly nearly everywhere. In continental Europe, the continuity of steady leadership provided by Angela Merkel will soon be tested as she steps away from center stage.
In the United Kingdom, Brexit came into effect on January 31 of this year, but there’s a hard deadline of January 1, 2021 to reach a trade agreement with the European Union, and not much progress has been apparent.
Japan will soon have a new Prime Minister, as Shinzo Abe, the country’s longest serving PM and the man who rescued the nation from debilitating stagflation, has resigned for health reasons.
China now has a ruler for life in President Xi, but human rights issues are spilling over into the foreign trade arena. Criticism of China for treatment of its Muslim/Uighur population, or for the clamping down on freedoms in Hong Kong, brings retaliation against the imports of some foreign nations.
China still ‘owns’ approximately 40% of the very large U.S. foreign trade deficit. Also, Beijing has displayed a disturbing propensity to block Canadian agricultural exports to its shores and to lock up Canadian citizens in retaliation for perceived slights.
Speaking of Canada, the WE Foundation scandal has led to replacement of the country’s Finance Minister and has damaged the standing of Prime Minister Justin Trudeau, who is facing a newly installed opposition leader. Mr. Trudeau is head of a minority government that can be called to account at any moment.
And then there’s the granddaddy of all political events upcoming, the November U.S. Presidential election. Anyone who says they know how that will turn out with certainty is more likely to be met with derision or laughter than a nod of agreement.
Securities Dealers Automated Quotations (NASDAQ), Toronto Stock Exchange (TSE) and Reuters.
Chart: ConstructConnect.
Securities Dealers Automated Quotations (NASDAQ), Toronto Stock Exchange (TSE) and Reuters.
Chart: ConstructConnect.
Securities Dealers Automated Quotations (NASDAQ), Toronto Stock Exchange (TSE) and Reuters.
Chart: ConstructConnect.
Securities Dealers Automated Quotations (NASDAQ), Toronto Stock Exchange (TSE) and Reuters.
Chart: ConstructConnect.
Alex Carrick is Chief Economist for ConstructConnect. He has delivered presentations throughout North America on the U.S., Canadian and world construction outlooks. Mr. Carrick has been with the company since 1985. Links to his numerous articles are featured on Twitter @ConstructConnx, which has 50,000 followers.


Recent Comments
comments for this post are closed