Canada’s Jobs Claw-Back Ratio Above Three-Quarters
In September, the U.S. economy experienced a fourth month of slowing jobs increase. In other words, new jobs creation decelerated. North of the border, according to Statistics Canada, there was an improvement in hiring (or re-hiring) in the latest month, versus the period before (+378,000 compared with +246,000), bringing a little more excitement to the recovery party (Graph 1).
Canada’s total jobs ‘claw-back’ ratio has improved to a quite respectable 76.1% (Table 1). More than three-quarters of the positions that disappeared from February to April, due to the coronavirus-related lockdowns, have been re-acquired.
Canadian manufacturing’s jobs recovery ratio is an impressive 95.3%. Canadian auto manufacturers decided to forego their usual summer shutdowns this year. Also, there has been expanded production of personal protective equipment (PPE) to combat the health crisis.
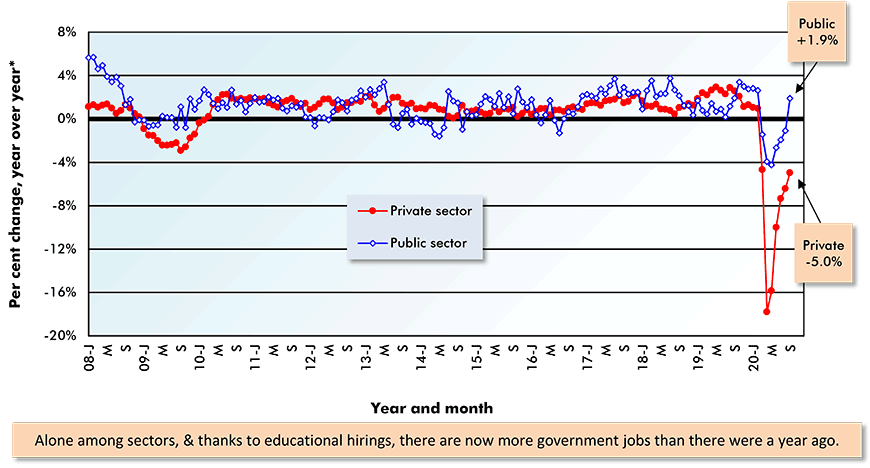
Also stand-outs in the final column of Table 1 are the employment claw-back ratios of 91.1% for part-time work and 124.0% for public sector staffing. On the heels of a +3.8% increase in hiring month-over-month in September, mainly in the field of education, there are presently +1.9% more people working for Canada’s government sector now than there were a year ago.
Canada’s jobs claw-back ratio in construction, despite recent expectations-shattering high levels of housing starts, currently stands at a lukewarm 61.7%.
Graph 1: Canada Month-to-Month Total Employment Change
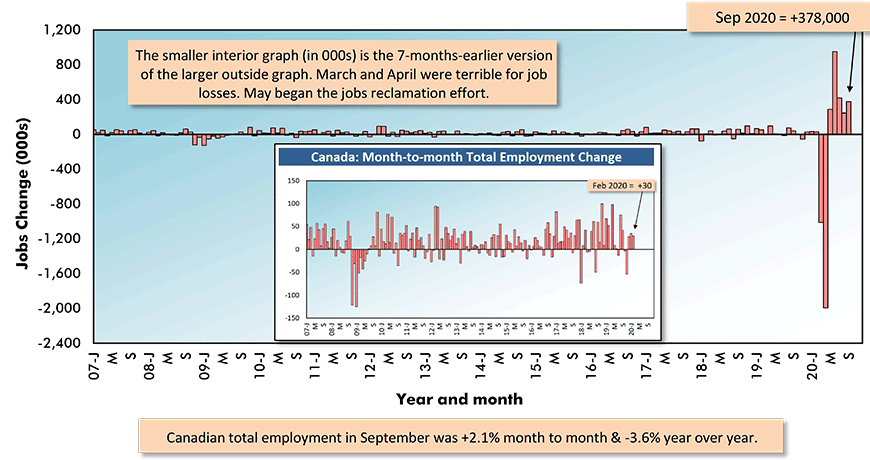
Chart: ConstructConnect.
Table 1: Monitoring the Canadian Employment Recovery ‒ September 2020
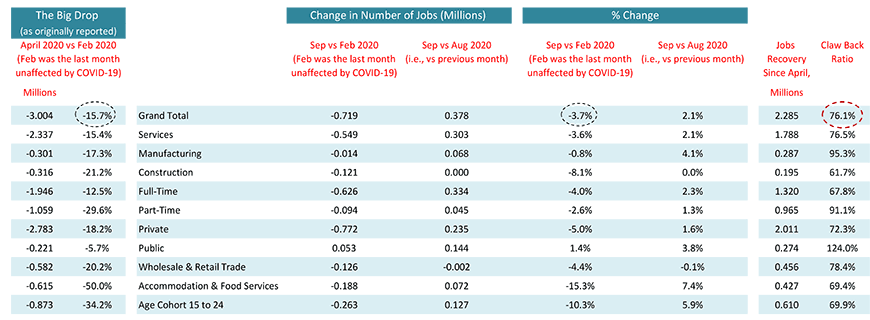
Table: ConstructConnect.
Comparing ‘Apples to Apples’ in Unemployment Rates
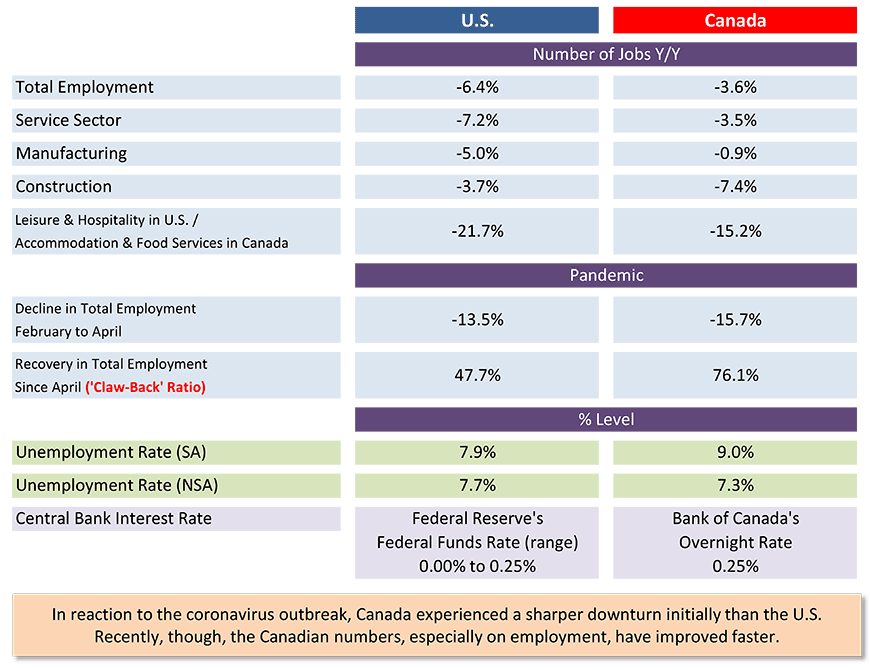
Canada is beating the U.S. according to four out of the five year-over-year employment metrics featured in the top section of Table 2. Canada is out front ‒ although, at this time, being ‘out front’ means being less negative ‒ in ‘total’ jobs (-3.6% to -6.4%); services-providing jobs (-3.5% to -7.2%); manufacturing posts (-0.9% to -5.0%); and restaurant/bar and hotel/motel positions (-15.2% versus -21.7%).
Where Canada has fallen behind is in construction (-7.4% being worse than -3.7%).
From Graph 2, Canada’s ‘headline’ unemployment rate of 9.0% in September does not show well when compared with the 7.9% figure for America. But the seasonally adjusted (SA) ‘headline’ rate is not an ‘apples-to-apples’ comparison. The U.S. is stricter in assessing who among out-of-work individuals is trying their ‘darndest’ to be hired somewhere.
When the Canadian number is adjusted to match U.S. calculation methodology, the not seasonally adjusted (NSA) results align closely, as can be seen in Graph 3. On an NSA same methodology basis, Canada’s September jobless rate of 7.3% was a little under the 7.7% level for the U.S.
Table 2: U.S. and Canadian Jobs Markets – September 2020
U.S. labor data is from a ‘payroll survey’ / Canadian labour data is from a ‘household survey’.
Canadian NSA unemployment rate ‘R3’ is adjusted to U.S. concepts (i.e., it adopts U.S. equivalent methodology).
Table: ConstructConnect.
Graph 2: Canada vs U.S. Monthly Unemployment Rate (Percent)
Seasonally Adjusted (SA) Data
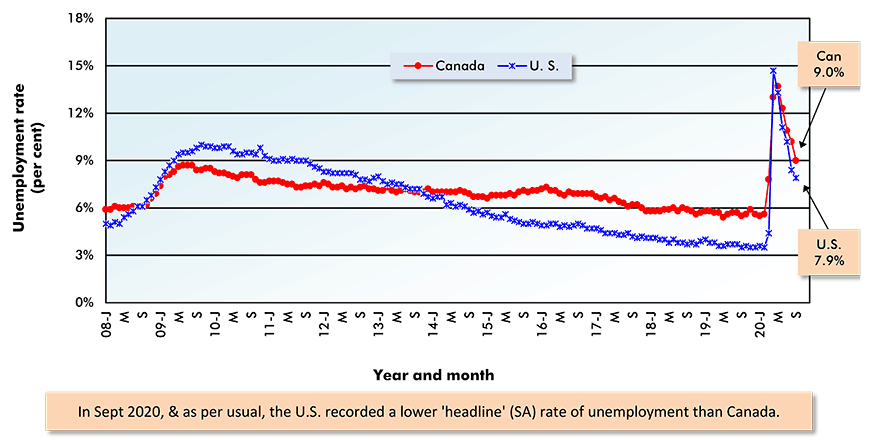
Chart: ConstructConnect.
Graph 3: Canada ‘R-3’ Unemployment Rate vs U.S. Unemployment Rate
Not Seasonally Adjusted (NSA) Data
(Statistics Canada calculates ‘R-3’ on same basis as U.S. rate)
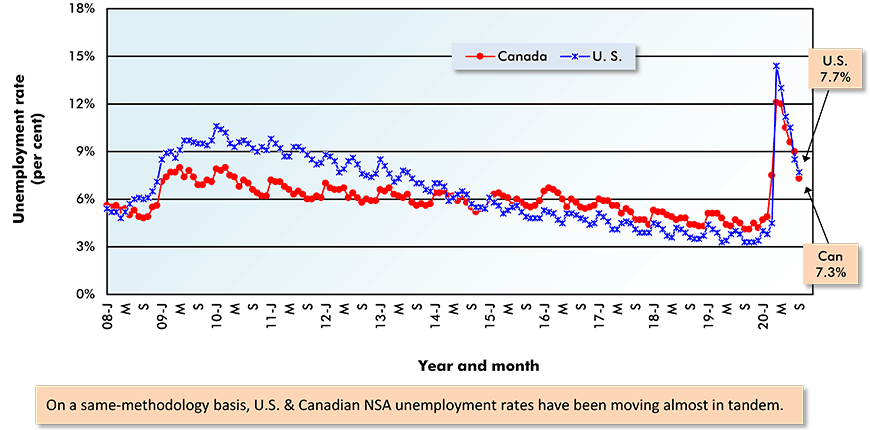
Chart: ConstructConnect.
Returns from the Depths for Canadian Manufacturing and Construction
From Graphs 4 and 5, similar pictures emerge for two key sectors within the Canadian and U.S. economies. The year-over-year jobs collapses this past Spring in both manufacturing and construction were far more severe in Canada than in the U.S.
For Canada, the year-over-year jobs drops were -18% for manufacturing and -20% for construction. Remember that Quebec, and Ontario to a lesser extent, took hard line stands for a while against work proceeding at construction sites.
Since April, year-over-year employment in Canadian manufacturing and construction have sprung back nicely, although it’s fair to say that the former has made a more impressive return from the depths than the latter.
Graph 4: Change in Manufacturing Employment – Canada vs U.S.
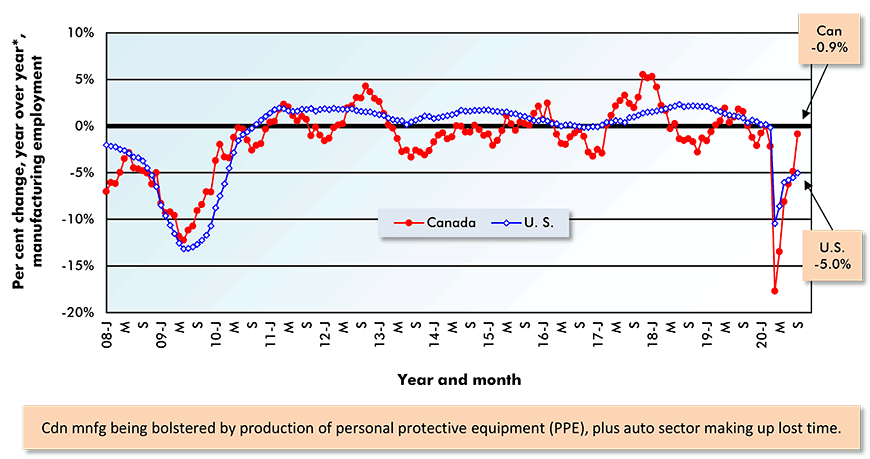
“Year over year” is the monthly figure versus the same month of the previous year.
Chart: ConstructConnect.
Graph 5: Change in Construction Employment – Canada vs U.S.
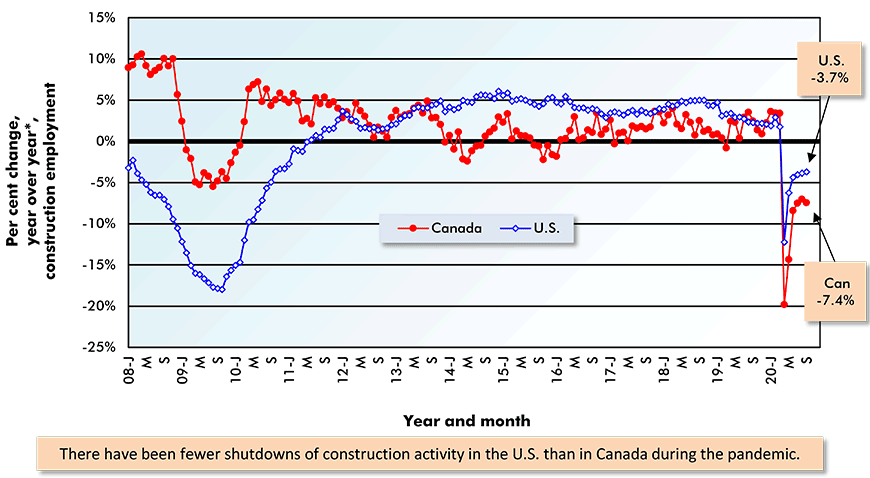
“Year over year” is the monthly figure versus the same month of the previous year.
Chart: ConstructConnect.
Part-time and Public Sector Jobs on Steroids
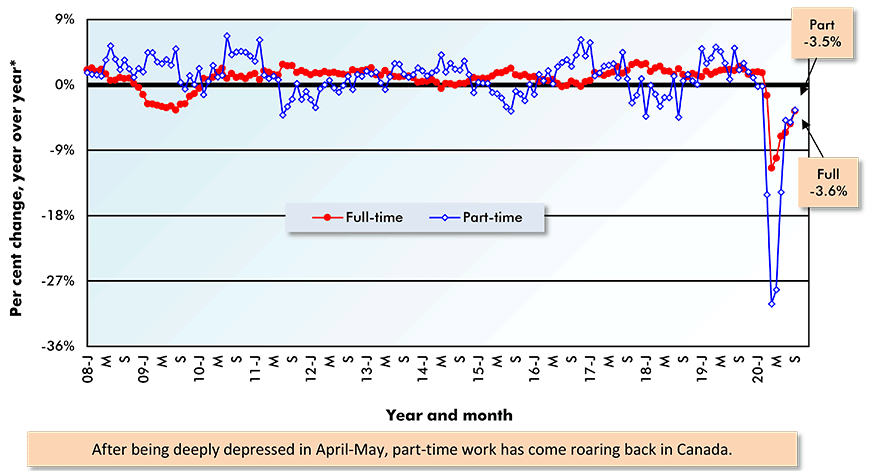
From Graph 6, the number of Canadian part-time positions sank by -30% y/y in April. Full-time postings, in their direst moment, were -12% y/y. The federal government stepped in with income supplement plans to provide support for the consumer spending that is the backbone of gross domestic product (GDP).
By September, with the rebound in part-time jobs on steroids, the year-over-year shortfall in both full-time and part-time work was almost equal, at or near -3.5%.
From Graph 7, private sector jobs, which bottomed out at -18% year over year in the Spring, are still down to a significant degree, -5.0%. But public sector jobs, which were never off by more than -4% year over year, are extra plentiful compared with September 2019, +2%.
Graph 6: Change in Full-time versus Part-time Employment in Canada
“Year over year” is the monthly figure versus the same month of the previous year.
Chart: ConstructConnect.
Graph 7: Change in Private Sector versus Public Sector Employment in Canada
“Year over year” is the monthly figure versus the same month of the previous year.
Chart: ConstructConnect.
Manitoba’s Moment to Shine
Provincially, and from Table 3, the best jobs claw-back ratios are in Manitoba (86.7%) and Quebec (86.2%). In the shadows, at the other end of the scale, are Prince Edward Island (54.9%), Alberta (65.1%) and Ontario (70.8%).
As an aside, five of Canada’s six largest urban centers – i.e., the ones with populations exceeding a million ‒ are currently recording unemployment rates that are in double-digit percentages. The nation’s capital, Ottawa-Gatineau, is the lone Canadian metropolis with an unemployment rate below 10.0%.
From Graph 8, there are four provinces currently claiming both unemployment rates lower than the national average and year-over-year jobs declines less than the national benchmark. Those four provinces are Saskatchewan, Manitoba, Quebec and Nova Scotia.
Table 3: Provincial Employment ‘Claw-Back’ Ratios – September 2020
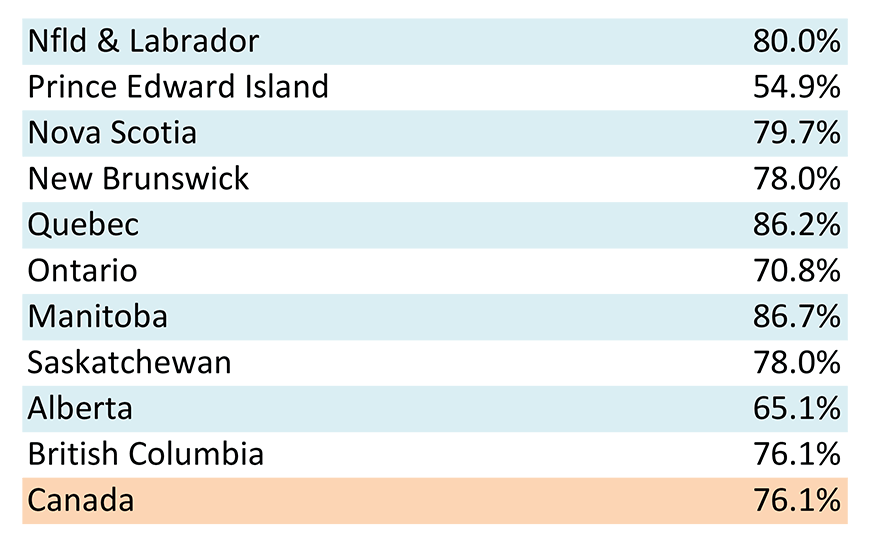
Table: ConstructConnect.
Graph 8: Canadian Provincial Labour Markets – September 2020
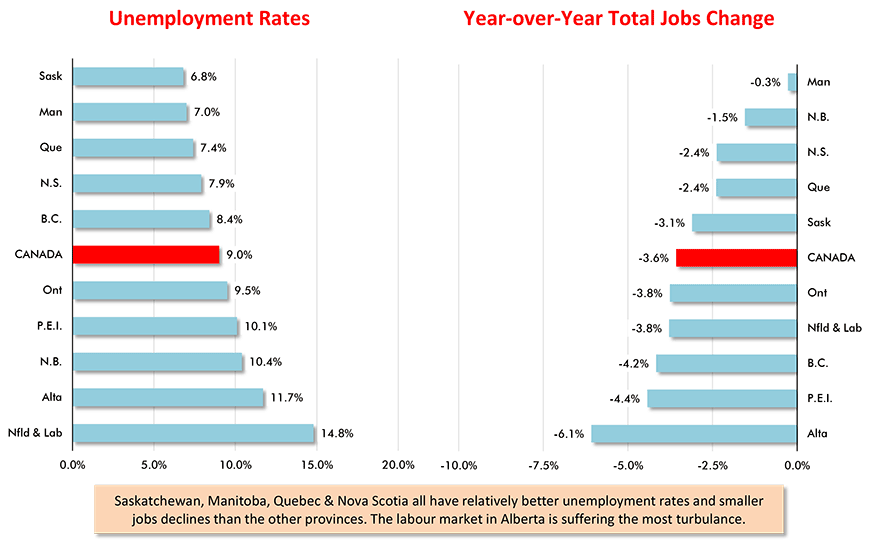
Chart: ConstructConnect.
Table 4: Canadian Provincial Labour Markets – September 2020
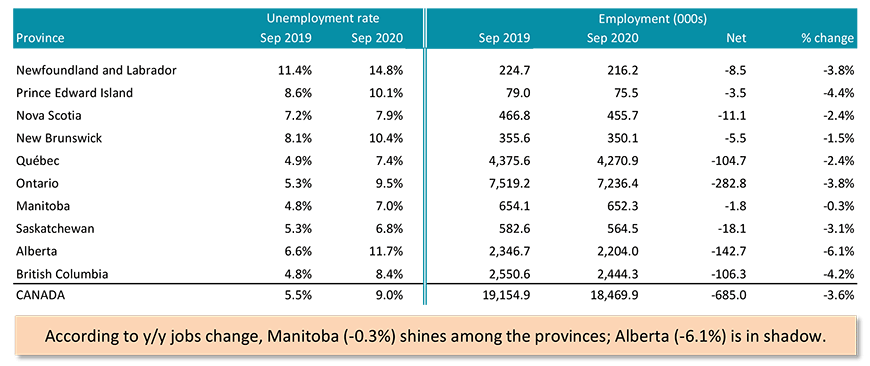
Table: ConstructConnect.
Alex Carrick is Chief Economist for ConstructConnect. He has delivered presentations throughout North America on the U.S., Canadian and world construction outlooks. Mr. Carrick has been with the company since 1985. Links to his numerous articles are featured on Twitter @ConstructConnx, which has 50,000 followers.


Recent Comments
comments for this post are closed