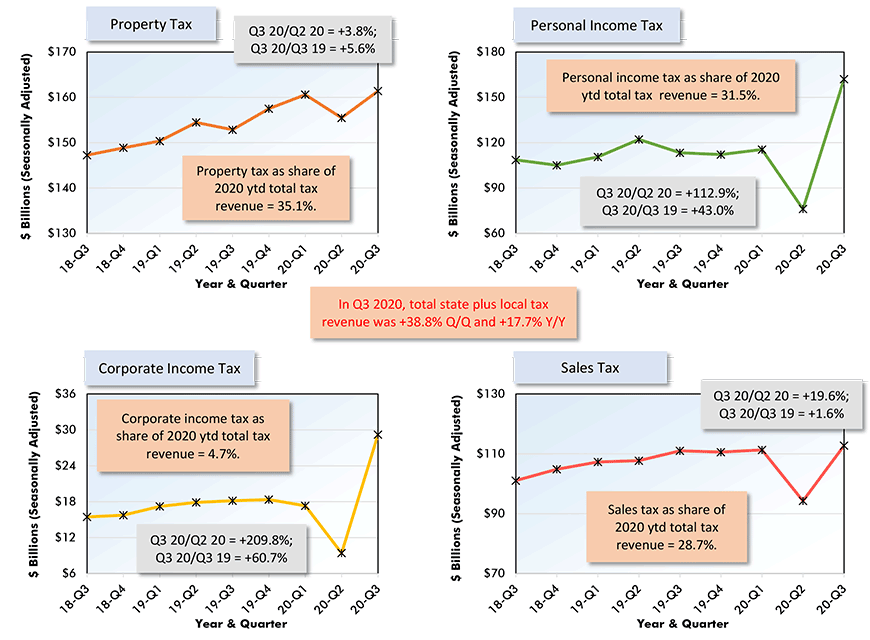
Here are 3 (standalone) graphs on U.S. state and local government finances. No doubt, and as is apparent from Graph 1, there were some sharp tax revenue declines in Q2 of 2020, especially in personal and corporate income taxes. Sales tax receipts also took quite a nosedive.

But in Q3, there were stunning recoveries. (Q4, when it is reported, is likely to suffer from the fall flare-up in coronavirus cases that continues to this day and which has forced significant abandonment of economic re-opening plans.)
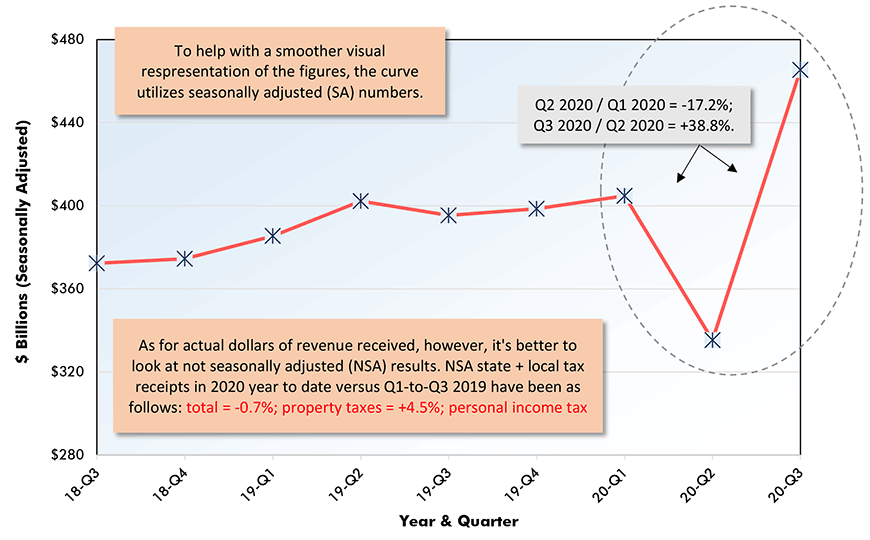
From Graph 2, year to date total tax receipts in Q3 2020 were down by only -0.7%, with ‘property taxes’ (crucial for funding school projects) not just treading water, but ahead by +4.5%.
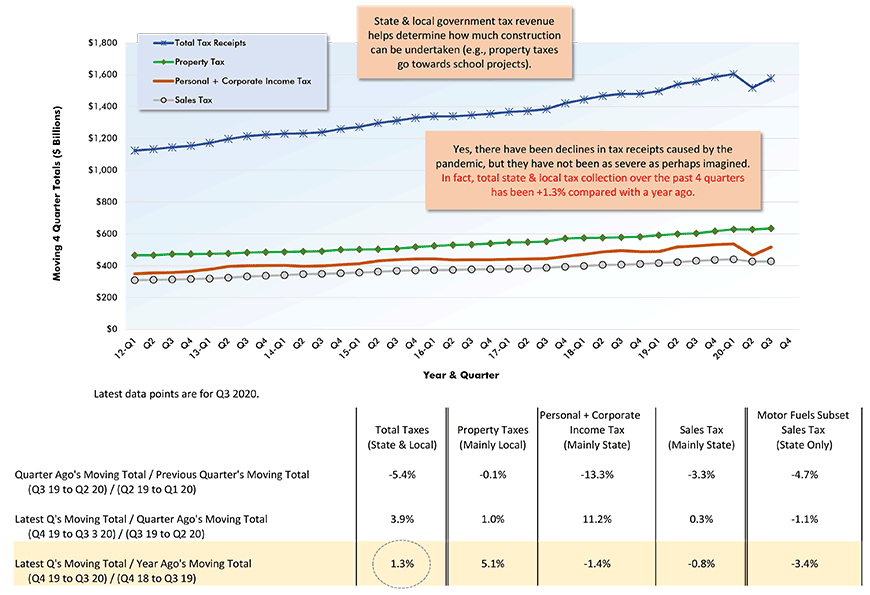
From Graph 3, on a 4-quarter moving total basis, Q3 2020 total tax receipts were +1.3%, with property taxes +5.1%. ‘Sales’ and ‘personal + corporate income’ taxes were almost flat, -0.8% and -1.4% respectively.
With ‘working from home’ becoming the at-least-temporary ‘norm’, reducing or eliminating the commute grind, the ‘motor fuels’ sub-component of sales taxes has remained soft, -3.4%.
Overall, though, and especially considering that states are not allowed to run deficits, the financial picture on the sub-federal level does not appear to be quite as dire as was feared back in mid-year 2020.

Chart: ConstructConnect.
Total Tax Receipts – Through Third Quarter, 2020

Chart: ConstructConnect.
Not Seasonally Adjusted (NSA) Current $s, Moving 4-Quarter Totals

Chart: ConstructConnect.
Alex Carrick is Chief Economist for ConstructConnect. He has delivered presentations throughout North America on the U.S., Canadian and world construction outlooks. Mr. Carrick has been with the company since 1985. Links to his numerous articles are featured on Twitter @ConstructConnx, which has 50,000 followers.


Recent Comments
comments for this post are closed