To tackle a +6.8% year over year CPI inflation rate, the Federal Reserve has stated it will be pursuing QT rather than QE in the year ahead, quantitative tightening rather than easing, and that there may be as many as three upwards adjustments to interest rates. On the residential construction side, the expectation of higher interest rates may counterintuitively speed up groundbreakings for a while as prospective new homeowners try to beat the financing cost increases.

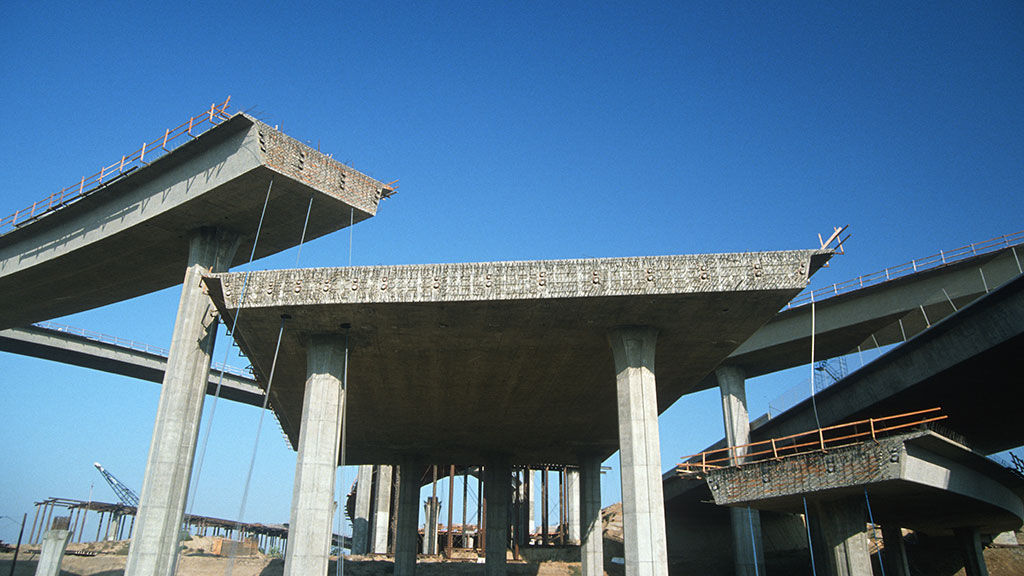
Engineering construction has been solid and flat during the pandemic to date. It’s about to receive quite a boost, however, from the recently enacted infrastructure spending bill.
Six and a half years of normal annual spending on mostly ‘hard’ infrastructure (roads, sewers, transit) is about to be compressed into the next five years. Plus, there are numerous major projects in the works that are mostly new to the construction scene, including carbon capture and storage facilities, utility-sized battery storage stations, and hydrogen extraction plants.
Download this article as a PDF.
Given climate change and the devastation being caused by wildfires and violent weather, the new buzzword being applied to civil projects underway and planned is that they must be resilient; in other words, capable of being brought back onstream quickly after being knocked out due to an extreme event.
Never mind inflation; conducting business is simply growing more expensive, given demands to convert to ‘green’ production processes and the need to adopt latest technological advances to stay competitive. Funds are being diverted away from expansions for other purposes. But on the positive side for construction, shortages in almost all areas of the economy, computer chips currently being most apparent, will warrant expenditures to up output.
Also serving to skew the statistics on the economy at present is an excess of demand, arising from cash accumulated while nearly everyone was staying indoors in the early stages of the coronavirus infection. Retail sales, for example, are way back above where they would be based on an extension of their pre-virus trend line. There’s a lot of stimulus to be released on the private spending side (e.g., on goods, services, travel, etc.) once the health crisis recedes, and this will promote a significant improvement in non-residential building construction.
‘Starts’ versus Put-in-place (PIP) Statistics
‘Starts’ compile the total estimated dollar value of all projects on which ground is broken in any given month. By way of contrast, put-in-place capital spending statistics are analogous to work-in-progress payments as the building of structures proceeds to completion.
Consider a $60 million office tower for which ground is broken in June 2021. For the ‘starts’ series, the entire estimated value ($60 million) will be entered in June 2021. In PIP numbers, it will be captured as spending of approximately $15 million in 2021; $25 million in 2022; and the final $20 million in 2023.
Table 1: U.S. Construction Spending (put-in-place investment)
(billions of “current” $s)
| Actuals | Forecasts | |||||||
| Type of Construction: | 2019 | 2020 | 2021 | 2022 | 2023 | 2024 | 2025 | |
| Grand Total | 1,391.1 | 1,469.2 | 1,569.7 | 1,673.8 | 1,814.7 | 1,925.0 | 2,008.6 | |
| (year vs previous year) | 4.3% | 5.6% | 6.8% | 6.6% | 8.4% | 6.1% | 4.3% | |
| Total Residential | 553.4 | 638.1 | 776.9 | 836.8 | 905.4 | 964.3 | 1,007.7 | |
| -1.9% | 15.3% | 21.7% | 7.7% | 8.2% | 6.5% | 4.5% | ||
| Total Non-residential | 837.6 | 831.1 | 792.9 | 837.0 | 909.3 | 960.7 | 1,000.9 | |
| 8.9% | -0.8% | -4.6% | 5.6% | 8.6% | 5.7% | 4.2% | ||
| Total Commercial/for Lease | 206.5 | 203.3 | 187.9 | 185.2 | 200.1 | 210.9 | 218.2 | |
| 6.2% | -1.6% | -7.5% | -1.4% | 8.0% | 5.4% | 3.5% | ||
| Lodging | 33.5 | 29.1 | 20.2 | 18.6 | 21.8 | 24.1 | 26.0 | |
| 6.3% | -13.2% | -30.6% | -7.6% | 16.8% | 10.8% | 7.7% | ||
| Office | 88.7 | 87.4 | 80.7 | 75.9 | 77.4 | 79.0 | 80.6 | |
| 15.7% | -1.5% | -7.6% | -6.0% | 2.0% | 2.0% | 2.1% | ||
| Commercial (retail/warehouse) | 84.3 | 86.8 | 87.1 | 90.7 | 100.9 | 107.8 | 111.6 | |
| -2.4% | 2.9% | 0.3% | 4.2% | 11.3% | 6.9% | 3.5% | ||
| Total Institutional | 201.4 | 204.5 | 185.1 | 188.7 | 198.9 | 205.6 | 211.8 | |
| 8.5% | 1.5% | -9.5% | 1.9% | 5.4% | 3.4% | 3.0% | ||
| Health Care | 46.3 | 48.1 | 48.5 | 49.0 | 51.5 | 53.7 | 55.7 | |
| 6.5% | 4.0% | 0.7% | 1.1% | 5.1% | 4.3% | 3.6% | ||
| Educational | 109.0 | 107.4 | 96.7 | 96.9 | 101.6 | 104.0 | 106.5 | |
| 7.6% | -1.4% | -10.0% | 0.2% | 4.8% | 2.4% | 2.4% | ||
| Religious | 3.7 | 3.5 | 3.0 | 2.9 | 2.9 | 3.0 | 3.1 | |
| 6.5% | -6.2% | -14.1% | -3.8% | 1.3% | 2.1% | 2.6% | ||
| Public Safety | 12.0 | 17.9 | 12.0 | 12.5 | 14.1 | 14.5 | 14.4 | |
| 28.5% | 48.8% | -32.9% | 3.8% | 12.9% | 2.8% | -0.4% | ||
| Amusement and Recreation | 30.4 | 27.6 | 25.0 | 27.4 | 28.8 | 30.5 | 32.1 | |
| 8.4% | -9.4% | -9.4% | 9.9% | 4.8% | 6.0% | 5.4% | ||
| Total Engineering/Civil | 348.7 | 351.2 | 347.4 | 384.4 | 420.0 | 446.7 | 467.8 | |
| (year vs previous year) | 10.1% | 0.7% | -1.1% | 10.6% | 9.3% | 6.4% | 4.7% | |
| Transportation | 57.5 | 59.7 | 56.5 | 61.8 | 68.8 | 74.2 | 77.9 | |
| 7.9% | 3.9% | -5.3% | 9.4% | 11.4% | 7.8% | 5.0% | ||
| Communication | 22.2 | 22.5 | 21.8 | 23.0 | 24.5 | 25.9 | 27.5 | |
| -9.4% | 1.5% | -3.1% | 5.5% | 6.2% | 5.9% | 6.3% | ||
| Power | 118.0 | 115.0 | 116.4 | 132.2 | 143.5 | 150.9 | 159.2 | |
| 18.5% | -2.5% | 1.2% | 13.6% | 8.5% | 5.2% | 5.5% | ||
| Highway and Street | 99.4 | 99.9 | 98.4 | 105.1 | 113.1 | 121.4 | 127.6 | |
| 8.3% | 0.5% | -1.5% | 6.8% | 7.7% | 7.3% | 5.2% | ||
| Sewage/Waste Disposal & Water Supply | 42.5 | 45.1 | 46.9 | 53.9 | 59.8 | 62.8 | 63.6 | |
| 7.9% | 6.1% | 3.9% | 15.0% | 11.0% | 5.0% | 1.2% | ||
| Conservation and Development | 9.2 | 9.0 | 7.4 | 8.4 | 10.2 | 11.4 | 11.9 | |
| 11.9% | -2.8% | -17.7% | 13.9% | 21.9% | 11.8% | 3.7% | ||
| Total Industrial/Manufacturing | 81.0 | 72.1 | 72.4 | 78.7 | 90.4 | 97.4 | 103.1 | |
| 11.7% | -10.9% | 0.4% | 8.7% | 14.8% | 7.8% | 5.8% | ||
“Current” means not adjusted for inflation.
Source of actuals: U.S. Census Bureau / Forecasts: Oxford Economics and ConstructConnect.
Table: ConstructConnect.
Put-in-place (PIP) Investment
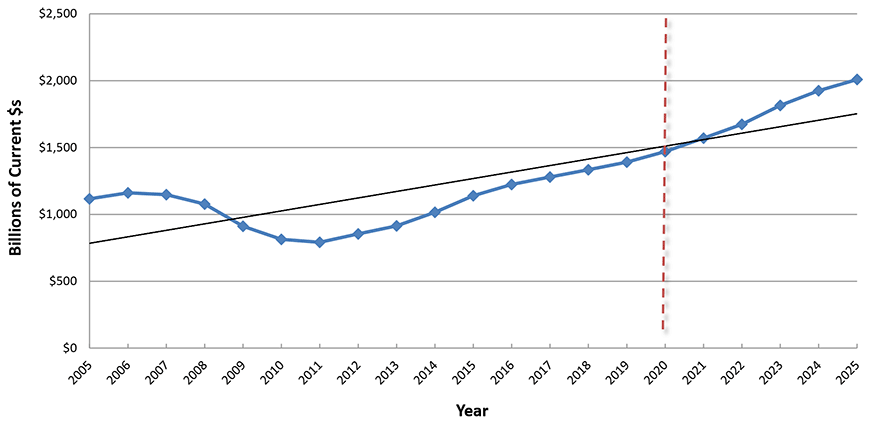
Chart: ConstructConnect.
Residential
A decade of below trend housing investment is about to be counterbalanced by activity levels above trend. Material input cost hikes will figure more prominently in the dollar volume increases in the years ahead. The duty on Canadian softwood imports has been doubled from 9% to 18%. Inhibiting the advance in capital spending will be the sluggish rate of population growth.
Put-in-place (PIP) Investment
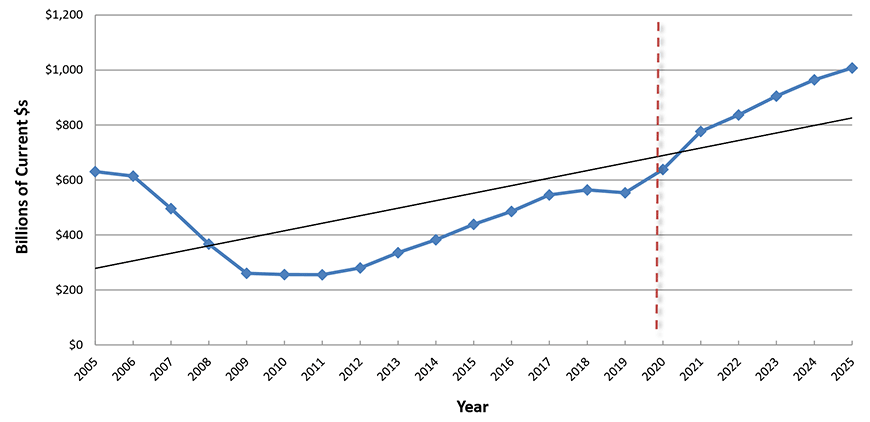
Chart: ConstructConnect.
Lodging
In the early Fall of 2021, the number of travelers being cleared by the Transportation Security Administration (TSA) recovered to about 80% of pre-COVID levels. Since then, though, Delta and Omicron have sent infection rates way up once again. The negative health issues adversely affecting hotel and motel bookings, and knock-on expansion plans, are likely to linger for years.
Put-in-place (PIP) Investment
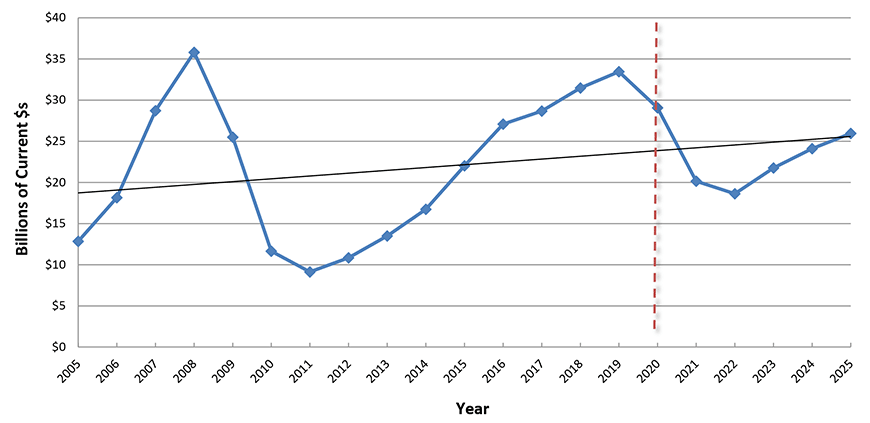
Chart: ConstructConnect.
Office Buildings
The tug of war between employers wanting workers to return to their offices and those okay with stay-at-home staffing is likely to play out over several more years. Acquiring the funding for new office space construction will be a tough sell. There will, however, be souped-up activity in renovation work (extra entrances and exits to existing buildings; upgraded HVAC systems; etc.)
Put-in-place (PIP) Investment
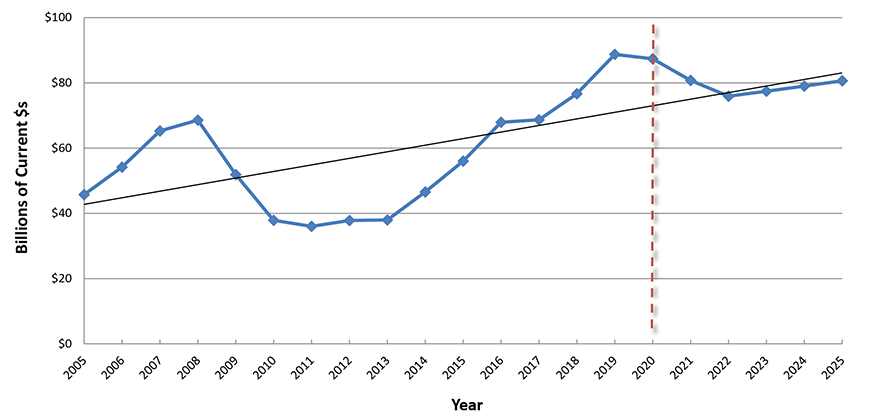
Chart: ConstructConnect.
Retail, Warehouse, Restaurant
Retail construction starts bottomed and began climbing again in 2021. Shoppers will be returning to malls; for many, it’s their best source of entertainment. As for warehouse building, there are 50-plus cities in the U.S. with million-plus populations requiring large distribution centers. Also, deglobalization and a shift away from just-in-time inventory demand more plant storage space.
Put-in-place (PIP) Investment
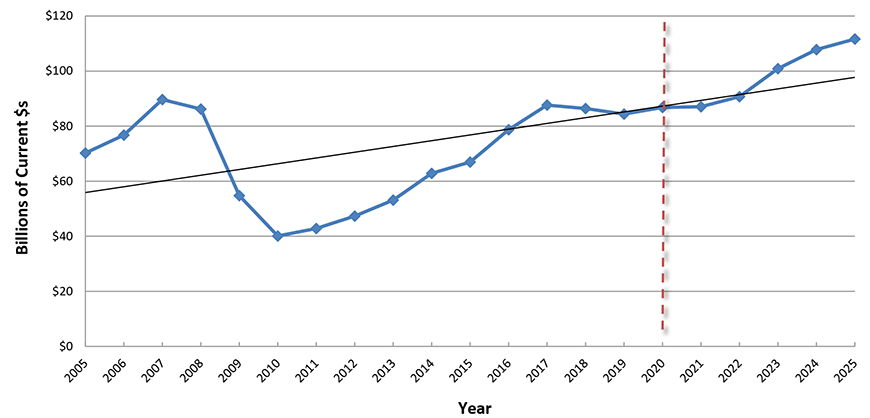
Chart: ConstructConnect.
Health Care
The baby boom generation was born between the mid-1940s and the mid-1960s. Every ‘boomer’ born and still alive is, therefore, 55 or older. The aging population will be demanding quality health care. More investment in seniors’ homes will also be warranted, but some of it will be driven by design and code changes to rectify patient care shortcomings exposed by COVID-19.
Put-in-place (PIP) Investment
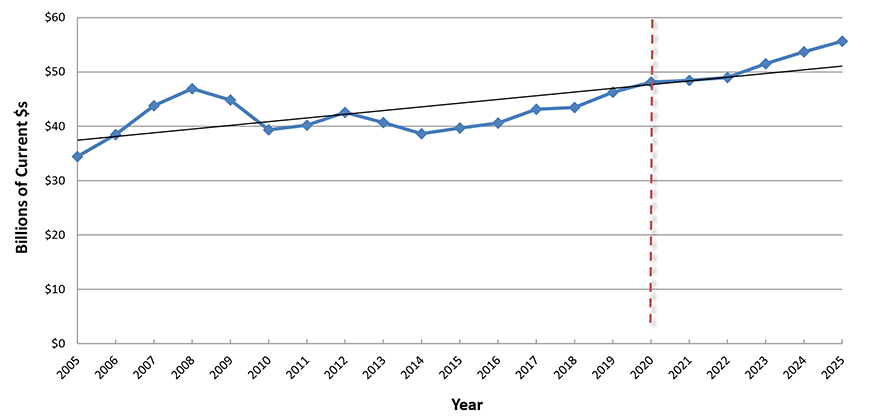
Chart: ConstructConnect.
Educational
Births in the U.S. are way down. Immigrant families with young children are also less common. The feeder stream into K-12 schooling isn’t what it once was. In higher education, fewer foreign students and online courses have lowered lecture hall attendance. Help has come from joint academic-business research ventures and faculties. Plus, there’s a trend to build teaching hospitals on campus.
Put-in-place (PIP) Investment
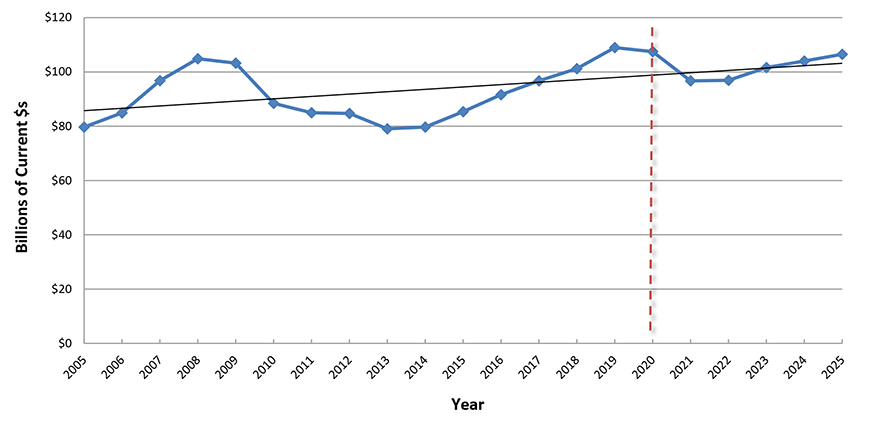
Chart: ConstructConnect.
Amusement and Recreation
The unemployment rate has tightened, and wages have been climbing at double their usual pace. The national savings rate shot into the stratosphere in Q2 2020 and has stayed somewhat elevated. Cash is on hand to splurge on recreation when everyone is totally confident about mingling. Professional sports teams in several major cities are planning new arenas or stadiums.
Put-in-place (PIP) Investment
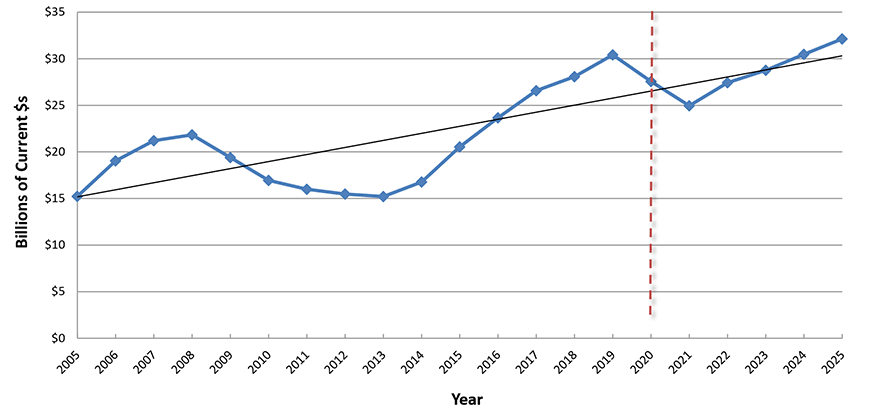
Chart: ConstructConnect.
Transportation
Before Spring 2020’s health setback, nearly every big city had new or additional rapid transit lines in the forefront of their capital spending plans. Then commuter patterns were knocked for a loop by the work-from-home upsurge. Those transit initiatives will be coming back on stream, but more gradually than first scheduled. The same applies for major expansions at international airports.
Put-in-place (PIP) Investment
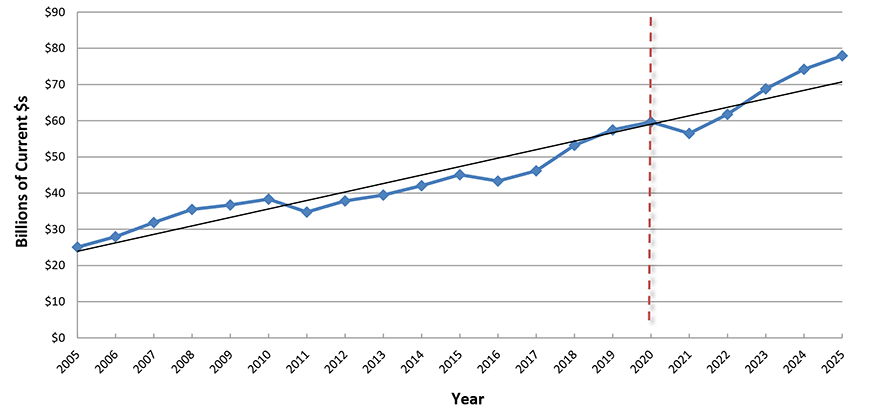
Chart: ConstructConnect.
Power
A main goal of the recently passed infrastructure spending package is the furthering of decarbonization efforts. A key answer will be found in the expansion of ‘green’ electric power capacity. This won’t just mean more solar plants and wind farms, but also new transmission towers to aid in such ventures as the conversion of home garages into EV recharging stations.
Put-in-place (PIP) Investment
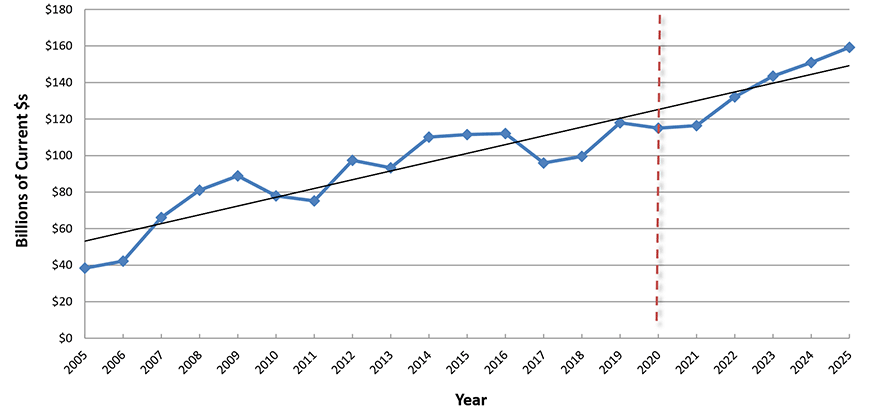
Chart: ConstructConnect.
Highways and Streets
Spending on roadwork has historically stayed remarkably true to a gently upward sloping trend line. The infrastructure package, including $100 billion for highways and $40 billion for bridges, assures that the future diversion from trend will be a more rapid incline. Attention should be paid to equipping new facilities with high-tech signaling, wear-and-tear and flow-of-traffic monitors.
Put-in-place (PIP) Investment
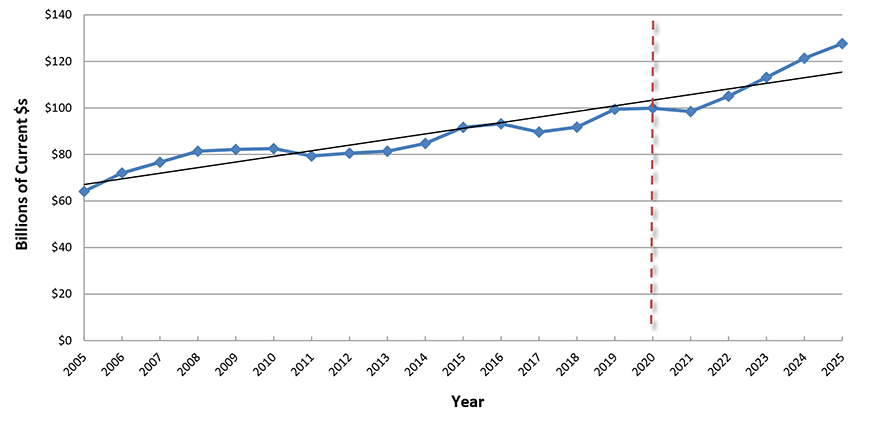
Chart: ConstructConnect.
Water Supply; Sewage and Waste Disposal
Providing services to new suburban communities and cleaning up the problems of the past (e.g., created by the likes of lead piping) will be the focus of spending by municipal public utilities. PPP structuring and extra government dollars will lift water supply and waste disposal spending from a basically flat path for a decade and place it on a robust upward sloping curve.
Put-in-place (PIP) Investment
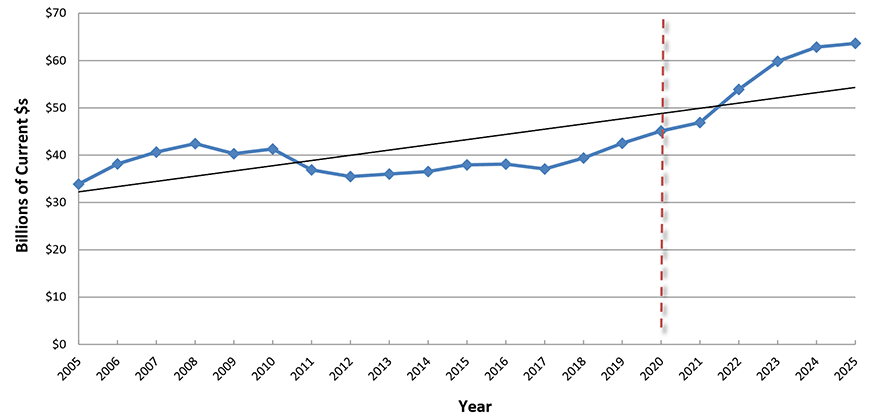
Chart: ConstructConnect.
Manufacturing
The supply shortage is a springboard to massive manufacturing investment. Also, for car companies to realize zero carbon emission goals by the 2030s, there will need to be new battery plants and assembly lines. Finally, the U.S. has a huge natural gas cost advantage versus Europe and Asia, providing a spur to capital spending at fertilizer, LNG and petrochemical plants.
Put-in-place (PIP) Investment
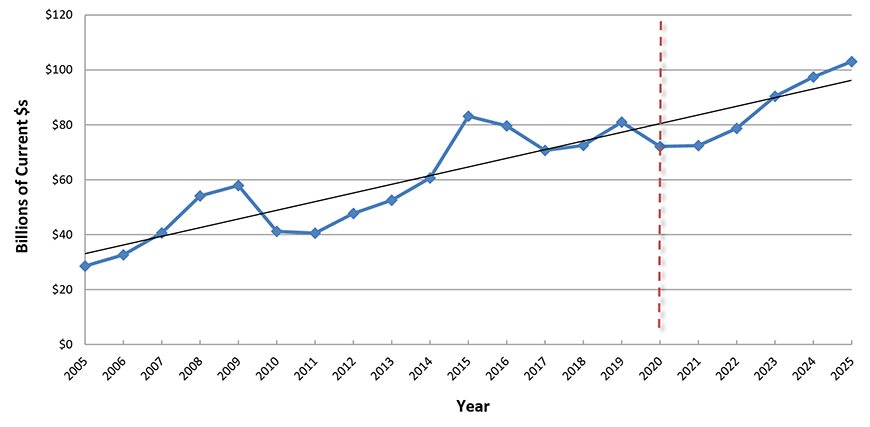
Chart: ConstructConnect.
Alex Carrick is Chief Economist for ConstructConnect. He has delivered presentations throughout North America on the U.S., Canadian and world construction outlooks. Mr. Carrick has been with the company since 1985. Links to his numerous articles are featured on Twitter @ConstructConnx, which has 50,000 followers.


Recent Comments
comments for this post are closed