
There’s much subject matter to be wrestled with in the pool of recent public and private sector data releases, so let’s leave our pina coladas (non-alcoholic, of course) beside our deck chairs and dive right in.
 (1) U.S. inflation, at least as measured by the year-over-year change in the Consumer Price Index (CPI-U), eased a little in April. It edged back to +8.3% from +8.5% in March. The ‘core’ rate, which sets aside notably price-volatile items in food and energy, also retreated a bit, to +6.2% y/y from +6.5% y/y in the prior month.
(2) Inflation in Canada moved, to a minor degree, in the other direction, from +6.7% y/y in March to +6.8% y/y in April. Canada’s CPI, excluding food and energy, stayed the same as in the previous month, +4.6% y/y. The Bank of Canada, when it’s assessing inflation, focuses on three specially created measures which it has labeled ‘common’, ‘median’ and ‘trim’. The average for those three indices rose to +4.2% y/y in April from +3.9% y/y in March.
(3) The bottom line is that in both the U.S. and Canada, April offered a tiny respite, of a duration still to be determined, from all the harrowing news about how steeply prices are climbing. Nevertheless, it’s still a shock to see gasoline at more than $4.00 USD per gallon in the U.S. and above $2.00 CAD per liter in Canada. On a y/y basis, the price of petrol in the U.S. is now +43.6%; in Canada, it’s +36.3%. The month-to-month price changes for gasoline in both countries in April, though, were encouraging, only +0.1% in Canada and -0.1% in America.
(4) The latest numbers on U.S. retail sales look pretty good, until one remembers that inflation is running at +8.3% y/y. Therefore, the +8.2% y/y increase in total retail and food services sales vanishes when the ‘current’ dollars taken in at shopkeepers’ registers are expressed in ‘constant’ inflation-adjusted dollars. Motor vehicle and parts dealers’ sales of -1.7% y/y appear particularly anemic. Nor were building material and supplies dealers sales, at +1.7% y/y, anything but disappointing. Gas station sales were +36.9% y/y, but that was price related. Food services and drinking place sales, though, at +19.8% y/y, were something to cheer about.
(5) For construction firms, there’s good news on the cost of materials front. The Producer Price Index (PPI) data set includes two construction material price indices, one with a limited number of components, but a long history of data collection, and another with fewer components, but a shorter history. While both remained high y/y in April, they also both downshifted, to +17.9% for the former and +20.9% for the latter. On average, at +19.4%, they were less than the y/y increase in the PPI’s bid price index, +19.6%. It would appear the enormous financial pressure placed on contractors from soaring material input costs is finally abating.
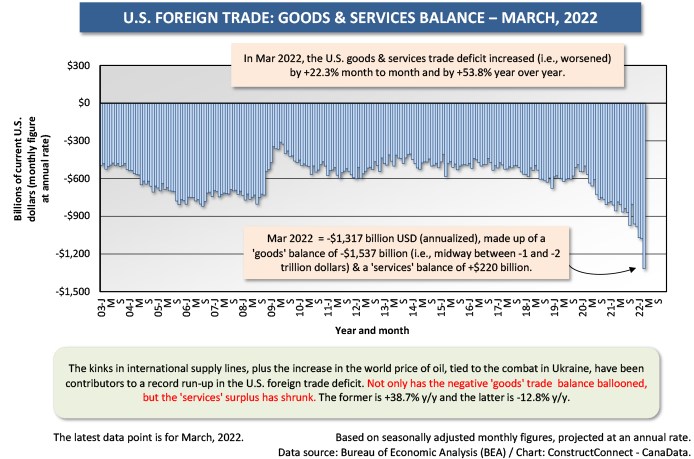
(6) Not good news, though, is the U.S. foreign trade picture. With so much else going on (i.e., inflation and Ukraine), this isn’t receiving much attention. In March, the latest month for which data is available, the U.S. ‘goods and services’ trade deficit (annualized) deteriorated by a further quarter of a trillion dollars to reach a record -$1.317 trillion USD. The shortfall in the trade of ‘goods’ as opposed to ‘services’ was a staggering -$1.537 trillion. Some help was provided by a ‘services’ trade surplus of +$0.220 trillion. But ‘services’ trade, comprised of net international tourism and business travel, net international freight movement costs, and net international financial transaction fees, is also on a bumpier path. Its performance is -12.8% y/y.
(7) Theoretically, one huge benefit of free economies is that problems are supposed to be self-correcting. A nation’s large trade deficit should be accompanied by a significant drop in value of the home currency, raising the cost of imports and lowering the price of exports. Hence, the trade shortfall will be reduced organically. But there are currently geopolitical forces in play inhibiting this adjustment mechanism. In times of great uncertainty, such as exist now, due to the military action in Ukraine, international currency traders seek a safe resting place where they can store their money. That’s lending support to, rather than taking away from, the value of the ‘greenback’, which is viewed as the world’s reserve currency.
(8) There’s been a near doubling in the cost of imported oil for the U.S. so far in 2022. Canada’s share of total U.S. oil imports, measured according to number of barrels, has been nearly two-thirds, 63.1%. Canadian barrels of crude shipped to the U.S. are +4.8% year to date, through March. In Canadian foreign trade statistics, energy product exports, expressed in ‘loonies’ (the nickname for Canada’s currency) are ahead by three quarters (+76.6%) year to date. By far, Canada’s largest trade surplus among all goods and commodities is rung up in energy products. Through Q1 of the current year, that surplus was nearly double (+85.4%) Q1 2021’s figure.
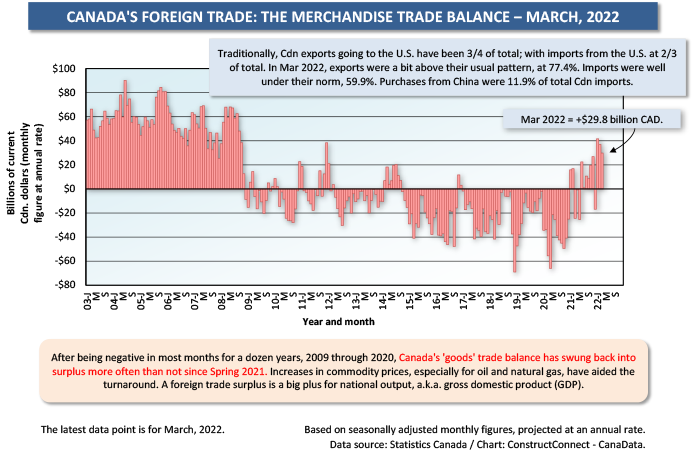
(9) Thanks mainly to perkier commodity prices, Canada’s merchandise trade balance has swung into surplus in nine of the past ten months. Canada is a nation with an abundance of resource sector wealth. Positive trade balances contribute directly to Gross Domestic Product (GDP)’s bottom line. (It was largely poor trade stats that drove U.S. GDP to be -1.4% annualized in Q1.) The revival in resources also explains why the Toronto Stock Exchange has not born quite the same brunt of negativity recently experienced by so many other bourses around the world.
(10) U.S. homebuilding statistics continued to be upbeat in April. ‘Starts’ were 1.724 million units (seasonally adjusted and annualized/SAAR), little different from March’s 1.728 million units. The most recent peak for starts was 1.777 million units in February of this current year. ‘Permits’ in April were 1.819 million units, down from March’s 1.879 million units, but still at a bullish level. The number of permits, or authorizations, is often viewed as a predictor of, or leading indicator for, how starts will behave in a couple of months. The most recent peak for permits was 1.896 million units in December 2021.
(11) April was Canada’s best month for housing starts so far this year, 267,000 units SAAR. The monthly average one third of the way through 2022 has been 251,000 units SAAR. The monthly average during the first four months of 2021, however, was even better, at 300,000 units SAAR. For decades (2000 to 2020), Canadian housing starts could be counted on to register 200,000 units annually. They have clearly ascended from that level plain. To keep home prices in check, politicians are hoping to see housing starts reach 300,000 units annually on a regular basis. Year-to-date housing starts in Canada’s six biggest metro areas have been: Toronto, -4%; Montreal, -30%; Vancouver, -23%; Ottawa-Gatineau, -3%; Calgary, +9%; and Edmonton, +15%.
Graph 1
Graph 2
Alex Carrick is Chief Economist for ConstructConnect. He has delivered presentations throughout North America on the U.S., Canadian and world construction outlooks. Mr. Carrick has been with the company since 1985. Links to his numerous articles are featured on Twitter @ConstructConnx, which has 50,000 followers.


Recent Comments
comments for this post are closed