
A strange thing is happening with the U.S. foreign trade balance. It’s improving significantly. It’s no longer as steeply in the hole as it was. And why this is so unusual is because it’s occurring while the value of the U.S. dollar is rising, making imports cheaper and more attractive and rendering exports more expensive and, therefore, a harder sell.
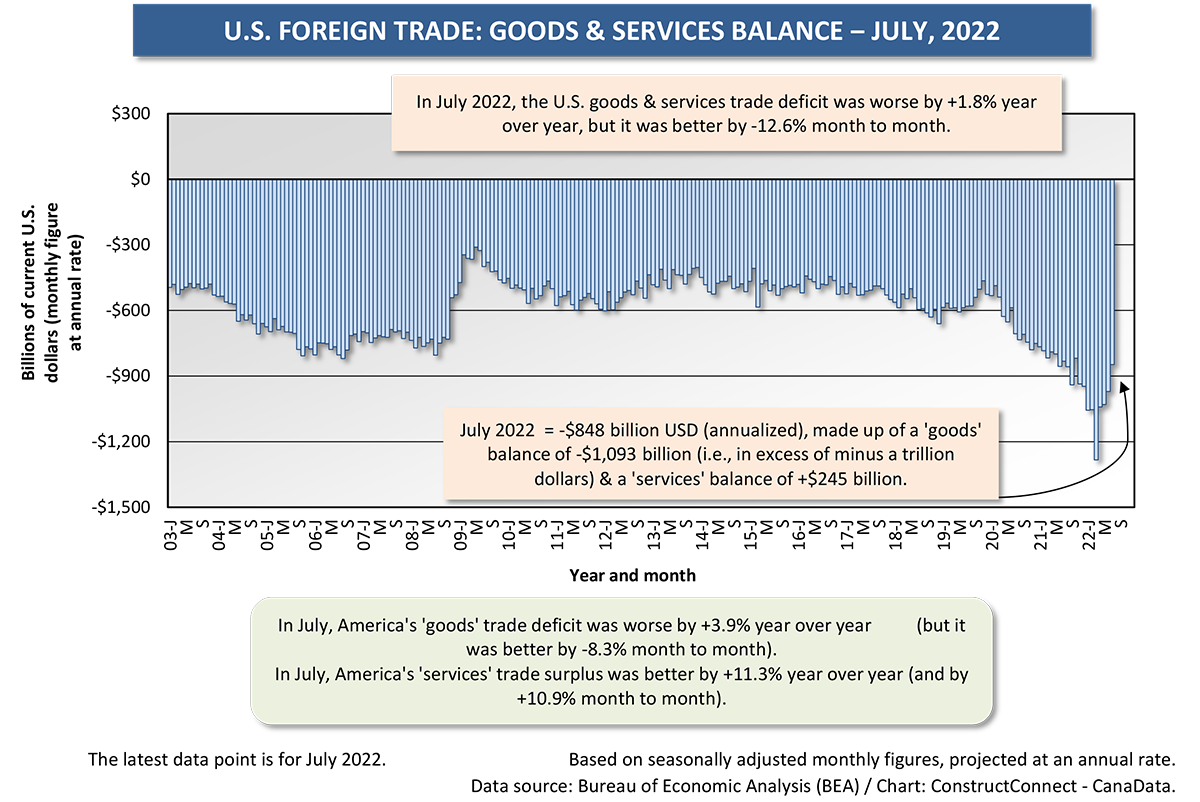
 Concerning the U.S. ‘goods’ trade deficit, which was a truly alarming -$1.5 trillion annualized in March, circumstances have aligned to bring that shortfall down to -$1.1 trillion in July. The extraordinary developments have been fortuitous for the U.S. trade picture, but not so fortunate for many other countries.
Russia’s aggression in Ukraine, accompanied by restrictions on shipments of energy products to Europe, have resuscitated the price of crude oil and sent the cost of natural gas skyward. It has also helped revive the demand for thermal coal.
U.S. producers have been quick to respond to the urgent energy needs coming from across the Atlantic. U.S. dollar volume exports of a trade sub-category titled ‘mineral fuels’ laid out in the monthly foreign trade report issued by the Census Bureau and the Bureau of Economic Analysis (BEA) have been +74.7% year to date.
The ‘mineral fuels’ sub-category is comprised of coal, petroleum products and natural gas. Crude oil exports on their own, in dollar volume terms, are +77.5% ytd.
Exhibit 1 in the Appendix of the trade report says that U.S. exports of oil and gas year to date in 2022 are +69.5% compared with January-July 2021 (again, expressed in dollars).
As for number of barrels of crude oil being shipped outside America so far in 2022, that figure is +16.9%.
July’s improved trade deficit resulted from a year-over-year exports dollar-volume increase of +21.1% that significantly outstripped the imports increase of +16.4% y/y.
Geographically, and coming as no surprise, given the sorry state of its energy market, Europe has accounted for the strongest year-to-date gain in U.S. exports, up by nearly a third, +30.3%.
Based on the improvement in America’s merchandise trade picture, one might be quick to assume the U.S. dollar has fallen in value (i.e., warding off imports and encouraging exports) or at least remained neutral relative to other major international currencies.
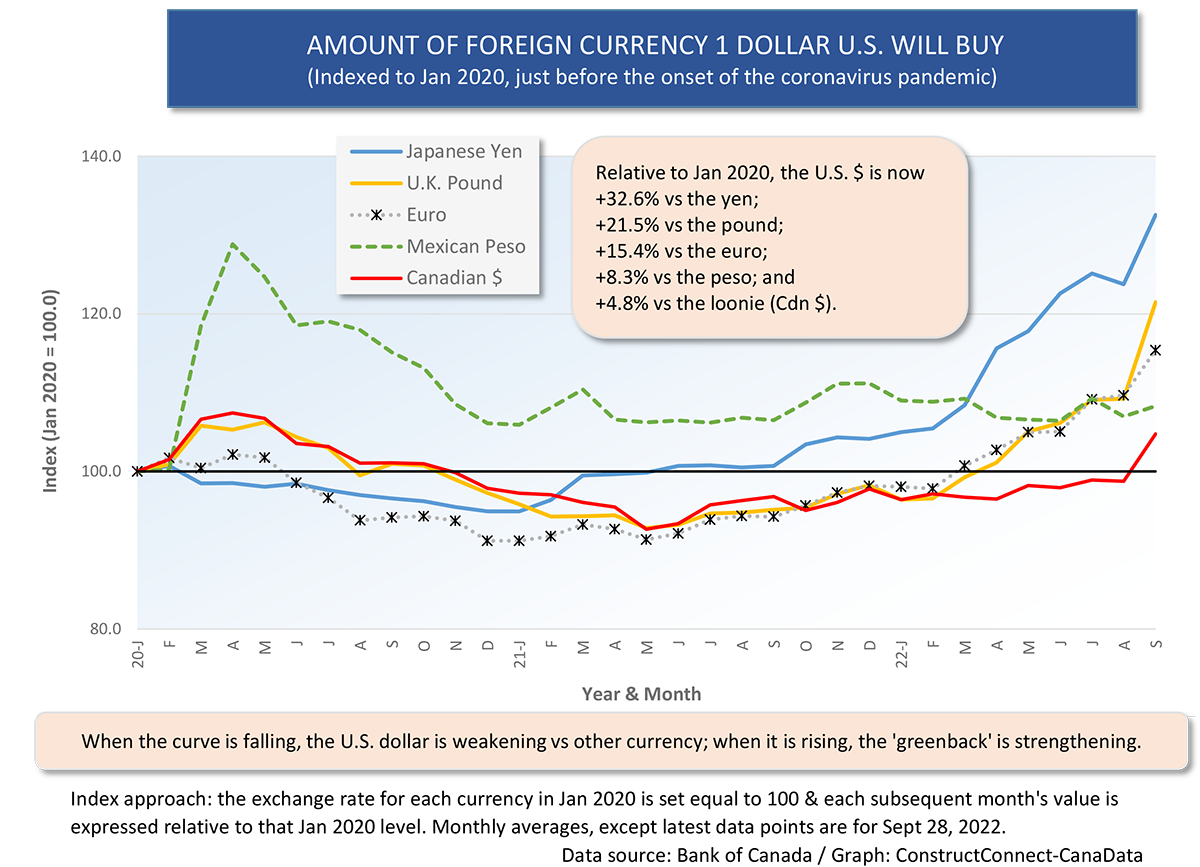
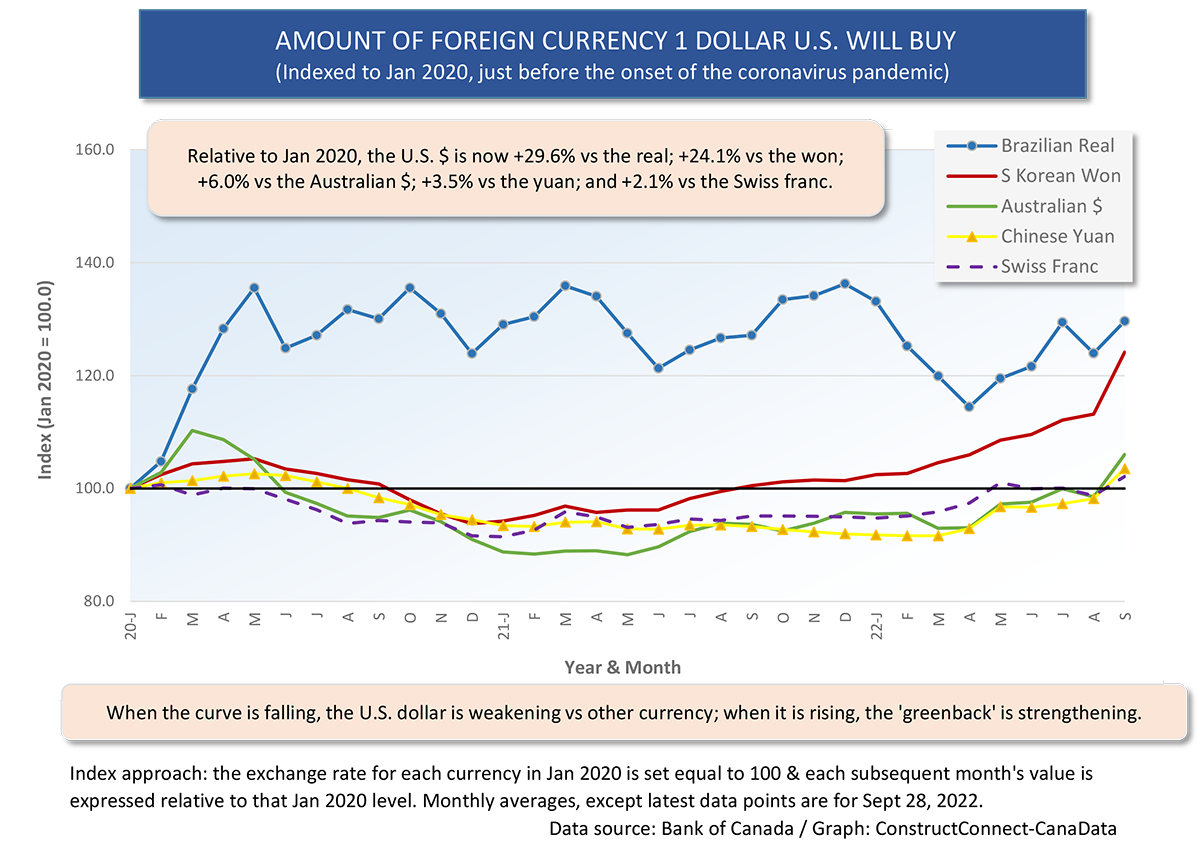
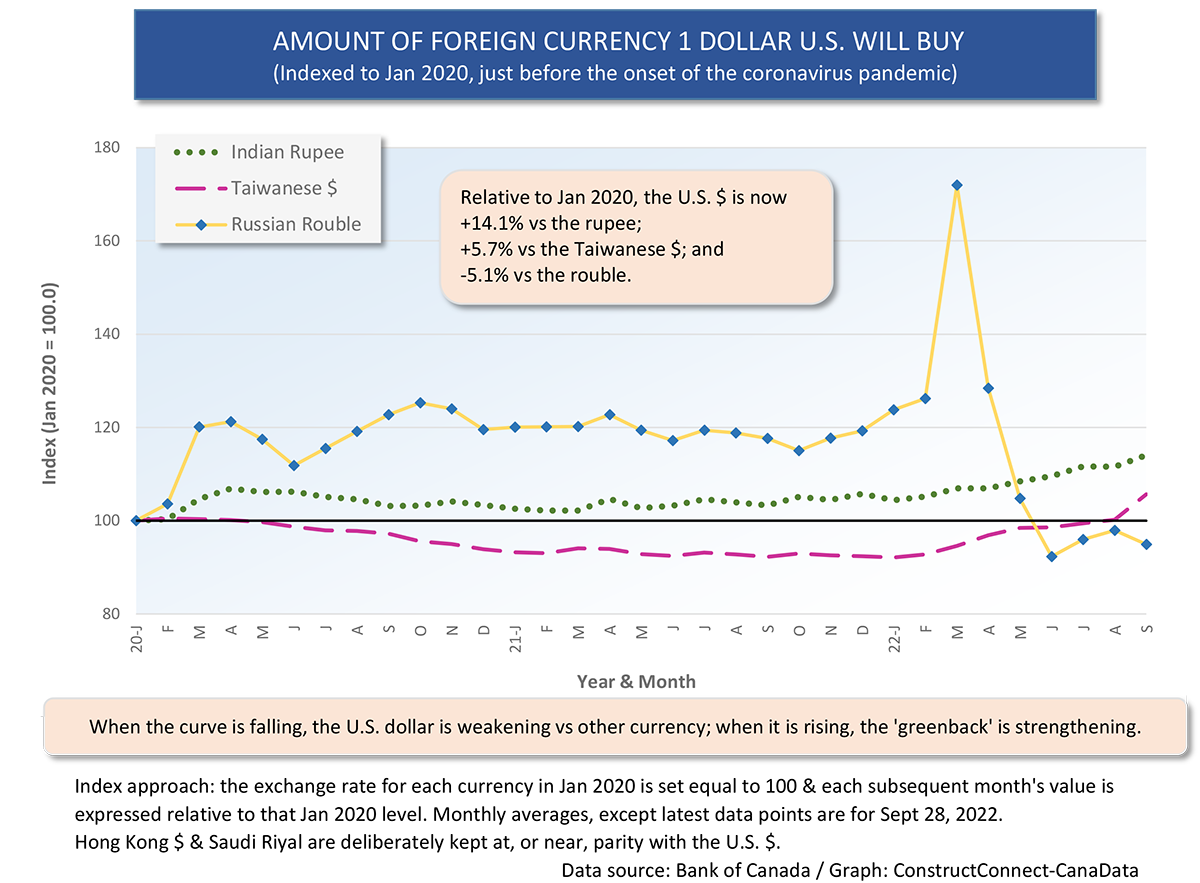
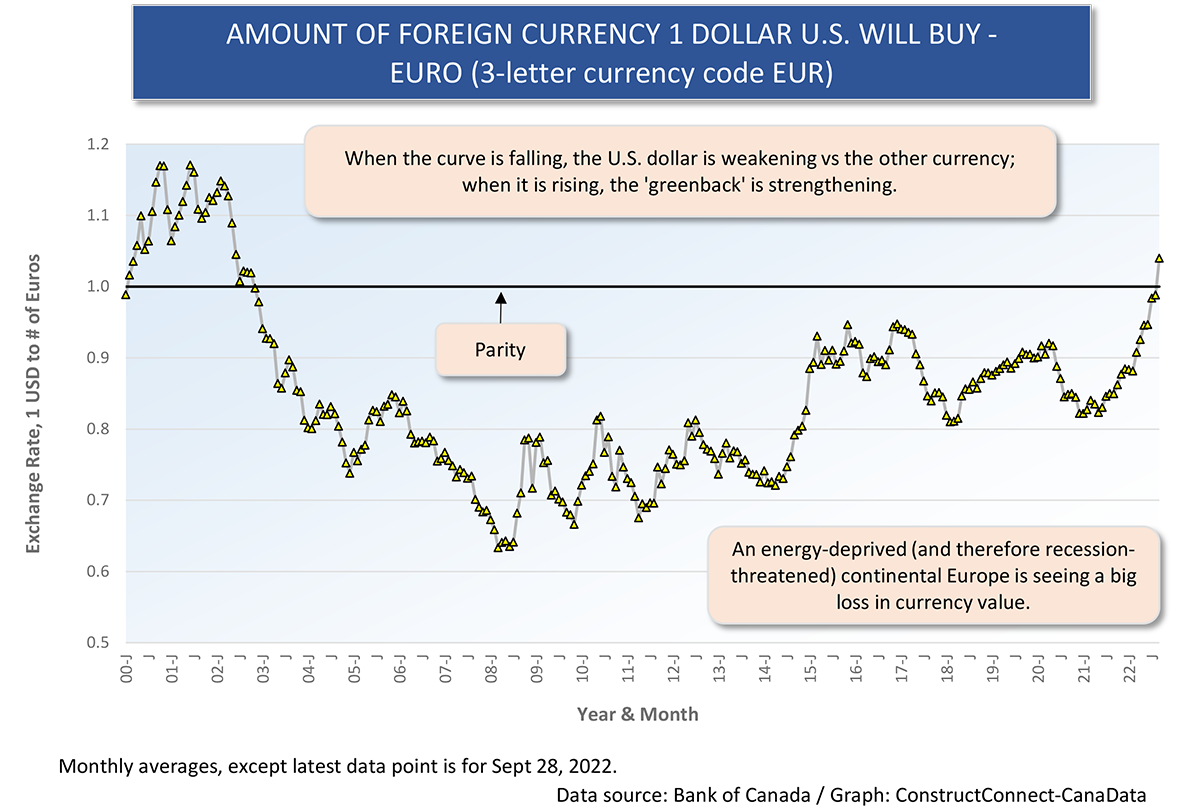
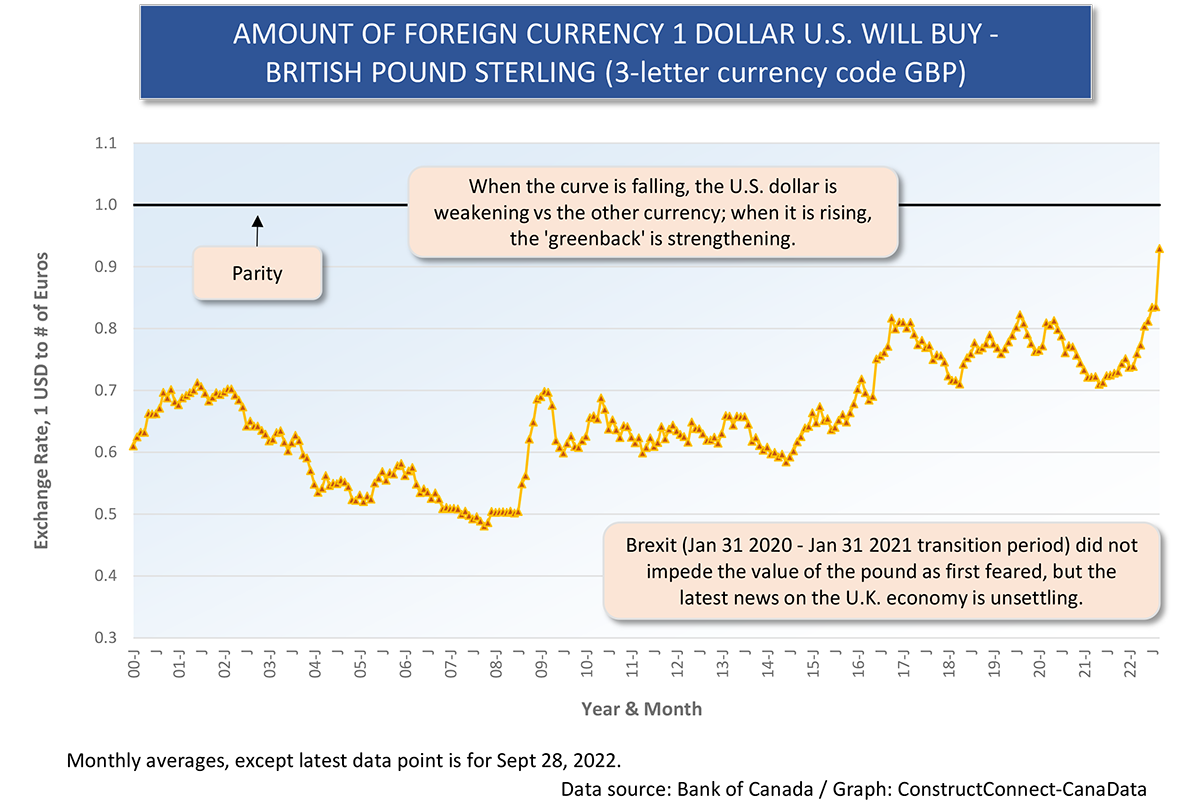
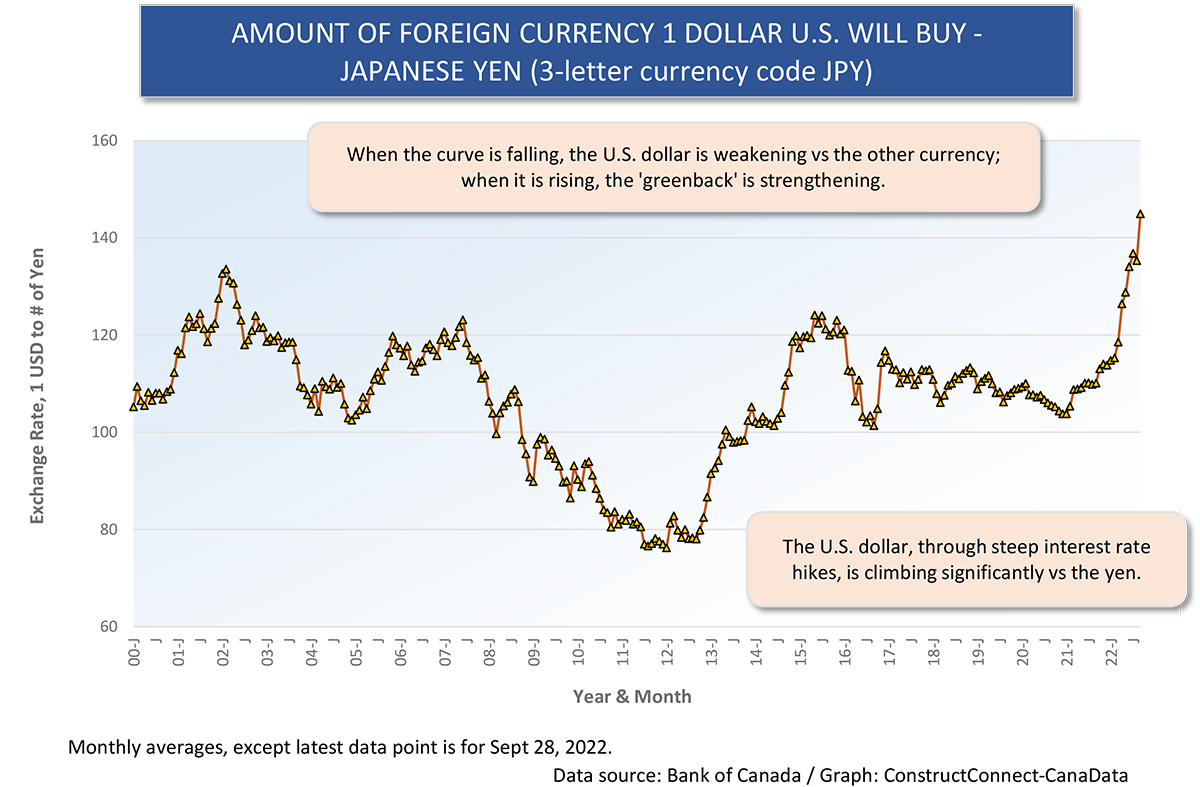
No, that has not been the case. Instead, the U.S. dollar has been picking up steam relative to almost all other currencies around the world (see Graphs 3 to 5). The one notable exception has been the Russian rouble.
When sanctions were applied early against Russia, after its invasion of Ukraine in February, the rouble sagged badly (i.e., seen in Graph 5 as a steep increase in how many of them 1 dollar U.S. could buy in March of this year). For three reasons, however, the situation has since reversed.
First, prior to the crisis, Russia purposely accumulated a huge treasure chest of foreign currency reserves it could deploy to purchase roubles and remove the sting from outside selling pressure. Second, Moscow has imposed strict controls on currency trading by its corporations and individuals, an artificial means to prop up the rouble’s value. Third, Russia continues to find customers for its oil and gas in China and India.
Versus the rest of the world’s currencies, the greenback has soared along with interest rate hikes by the Federal Reserve (promoting capital inflows) and due to its status as a safe harbor in times of economic distress, such as when a global recession may be lurking in the wings.
During the nearly three years since the coronavirus outbreak, the greenback is up the most versus the Japanese yen, +32.6%. Its next biggest leaps have been relative to the Brazilian real, +29.6%; the South Korean won, +24.1%; the British pound, +21.5%; and the euro, +15.4%. The greenback rising to sit above parity with the euro just a little while ago was viewed as a big milestone (Graph 8). That’s a feat not seen in 20 years, dating back to 2022.
Many emerging nations operate with government debt that is denominated in U.S. dollars. A dollar on steroids makes it harder for them to meet carrying charges and repayment schedules. But there’s a flip side. Many of those same countries are highly dependent on raw material export sales and almost all commodities traded internationally are priced in U.S. dollars. The exchange rate conversion to the home currency can result in a windfall profit.
For the U.S. construction industry, there’s a hearty future ahead tied to building renewable electric power facilities. In the short-term, though, there will also be extensive capital spending to address the immediate fossil fuel availability crisis in many nations in Europe and Asia. The good-news export numbers from U.S. outbound oil, gas, fertilizer, and coal shipments flash brightly in the foreign trade statistics.
Graph 1
Graph 2
Graph 3
Graph 4
Graph 5
Graph 6
Graph 7
Graph 8
Graph 9
Graph 10
Alex Carrick is Chief Economist for ConstructConnect. He has delivered presentations throughout North America on the U.S., Canadian and world construction outlooks. Mr. Carrick has been with the company since 1985. Links to his numerous articles are featured on Twitter @ConstructConnx, which has 50,000 followers.


Recent Comments
comments for this post are closed