
The other day, I wrote about U.S. city labor markets. Today’s article presents the same subject matter and graphics for Canada.
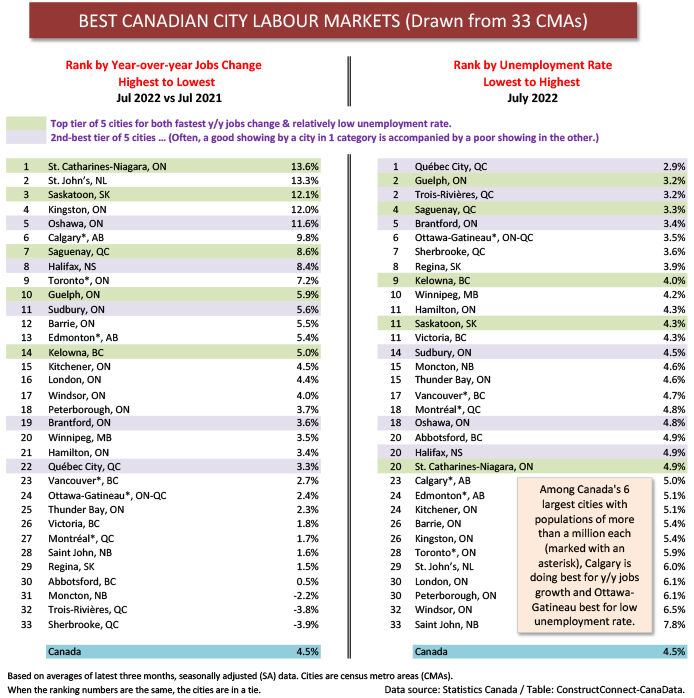
Table 1 ranks 33 Census Metropolitan Areas (CMAs) in Canada according to two criteria: (1) year-over-year change in number of total jobs, fastest to slowest; and (2) unemployment rates, lowest to highest.
 The Top 5 cities with both good jobs growth and low unemployment rates are shaded green. The next best tier of 5 CMAs appears with purple shading.
It’s interesting that cities with both hues of shading are spread across the country. There’s no one province with a dominance in city jobs creation. Remember that these are all jobs. Construction jobs specifically will be addressed in the next section.
From Graph 1 and focusing on Canada’s six largest (by population) cities, the lowest current unemployment rate is to be found in the nation’s capital, Ottawa-Gatineau (3.5%). The public sector has been a stalwart in maintaining employment levels during the pandemic to date.
Vancouver (4.7%) has the next lowest U rate, followed by Montreal (4.8%). A revival in the energy sector has had knock on benefits for the U rates of Calgary (5.0%) and Edmonton (5.1%). Toronto (5.9%) is sitting in last place for ‘all jobs’ unemployment rate among Canada’s six most populous cities.
Canada’s Construction Labour Market
The big size of Toronto’s labor market is made clear, nonetheless, in Table 2. For the construction sector alone, Toronto’s first-place jobs count of 237,000 is nearly equal to the next two largest figures combined, for Montreal and Vancouver (141,000 + 118,000 = 259,000).
In a comparison with U.S. cities, Toronto (237,000 construction jobs) would be positioned in fourth spot behind N.Y. (398,000), L.A. (266,000) and Houston (241,000), but ahead of fifth-place Dallas-Ft Worth (232,000).
Furthermore, Toronto’s year-over-year increase in construction jobs has been quite respectable, +10.5%. Montreal hasn’t done quite as well, +10.0% y/y, but Vancouver has performed considerably better, +18.0%.
Leading the y/y construction jobs charge, though, among the 12 most populous cites in Canada, has been London, Ontario +27.8%. The nearby Kitchener region has also managed a strong upsurge, +16.8% y/y.
Homebuilding almost always plays a key role in providing employment for construction workers. Canadian housing starts held up better than expected through the first half of this year.
Their bedrock strength will soon be tested, however, given that the Bank of Canada has just raised its key policy-setting interest rate (i.e., the overnight rate) to 3.25%.
Table 1
Graph 1
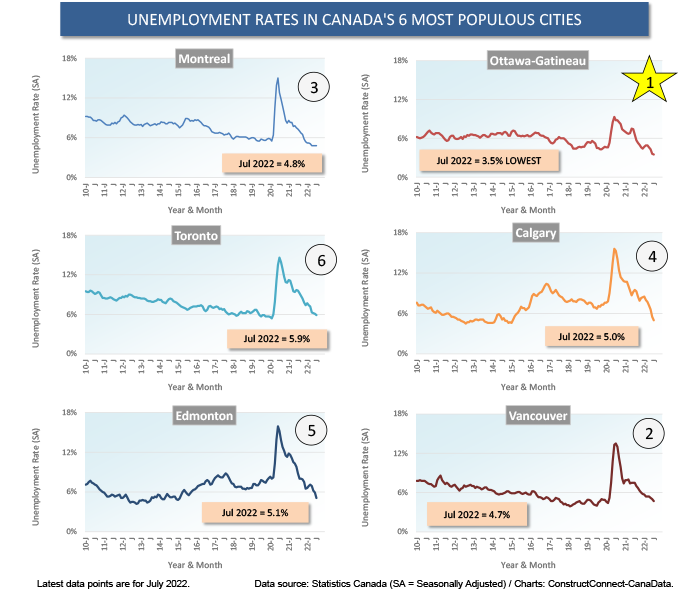
Table 2

Alex Carrick is Chief Economist for ConstructConnect. He has delivered presentations throughout North America on the U.S., Canadian and world construction outlooks. Mr. Carrick has been with the company since 1985. Links to his numerous articles are featured on Twitter @ConstructConnx, which has 50,000 followers.


Recent Comments
comments for this post are closed