
In the U.S., the Federal Reserve has just raised its key policy setting interest rate, the federal funds rate, into a range from 3.00% to 3.25%. The intent is to cool inflation, which is +8.3% year over year for the Consumer Price Index (i.e., CPI-U, with U standing for urban consumers). The U.S. ‘core’ inflation rate is +6.3%. ‘Core’ leaves out price-volatile energy and food items.
 A higher interest rate regime is meant to stamp out excessive consumer spending. But it’s also known, through corresponding bumps in mortgage rates, for almost always having a detrimental effect on residential real estate demand and new home construction.
This article, with the help of 14 graphs, examines the present state of housing markets in the U.S. and Canada. There are almost certainly more interest rate increases to come in both countries. In Canada, the Bank of Canada’s ‘overnight rate’ is now 3.25%. North of the border, though, there’s a little more encouraging news concerning inflation. Canada’s August CPI increase moderated to +7.0% y/y. And the average for several measures of the ‘core’ rate was +5.2% y/y.
The surprising fact is that housing starts haven’t stumbled into the ditch just yet in either country. This has been despite cries of alarm being expressed from multiple quarters.
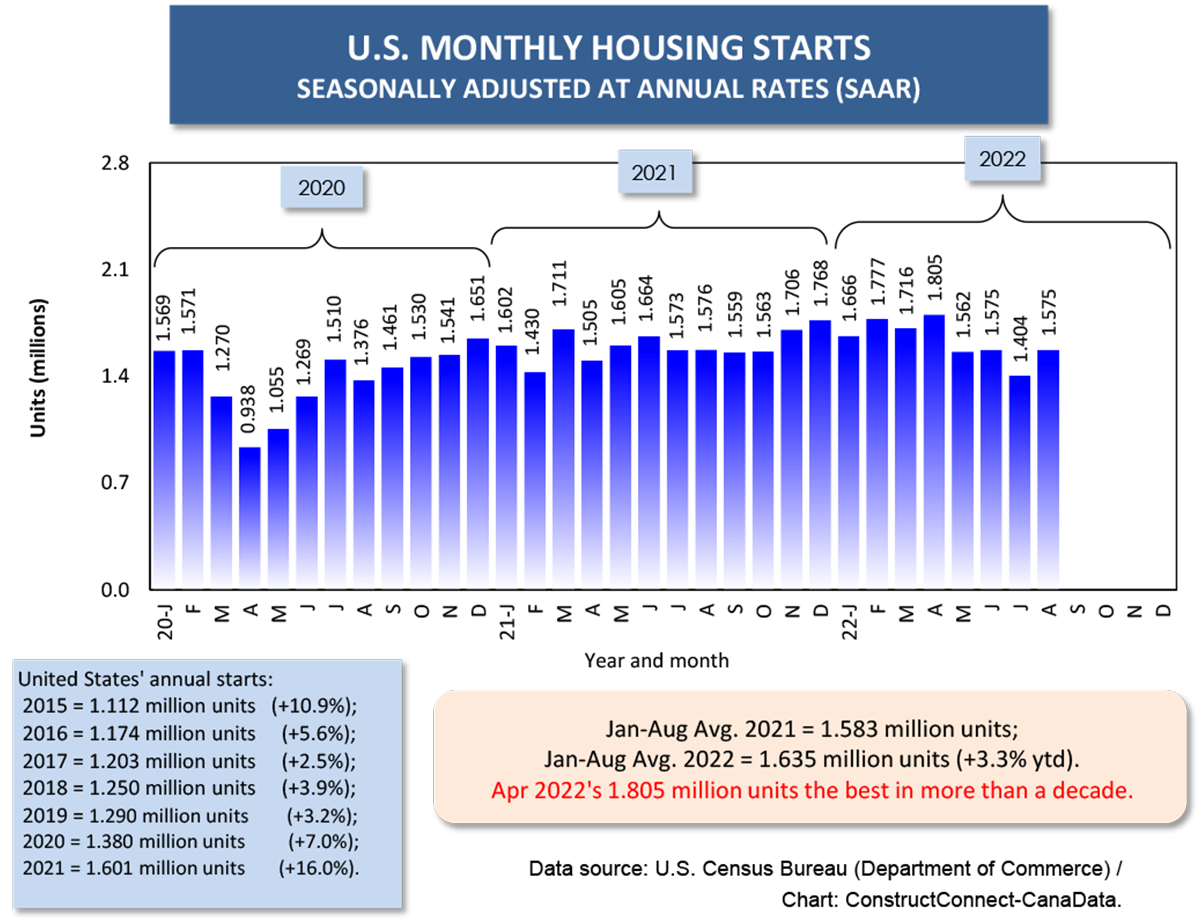
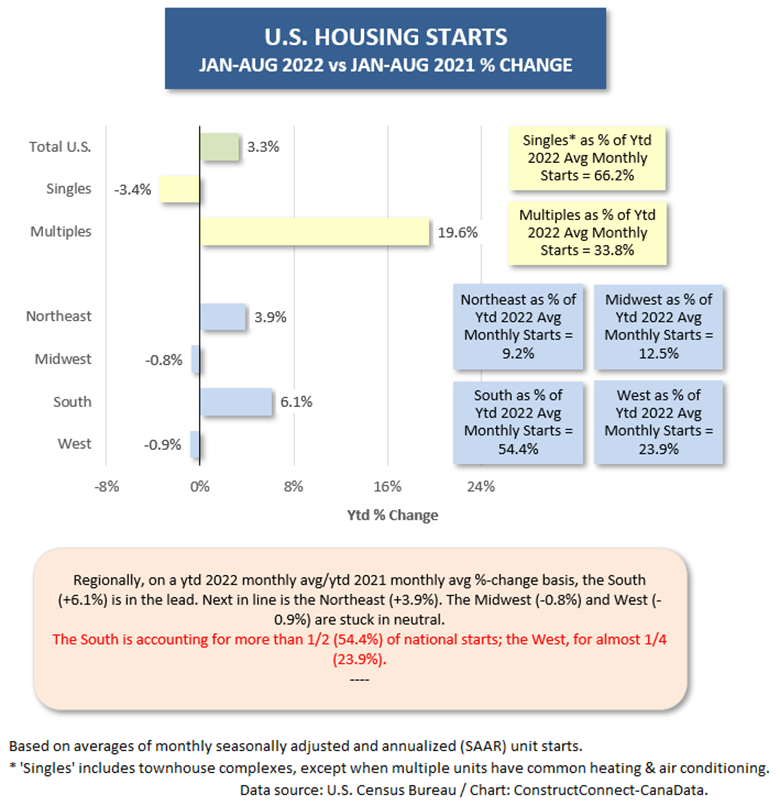
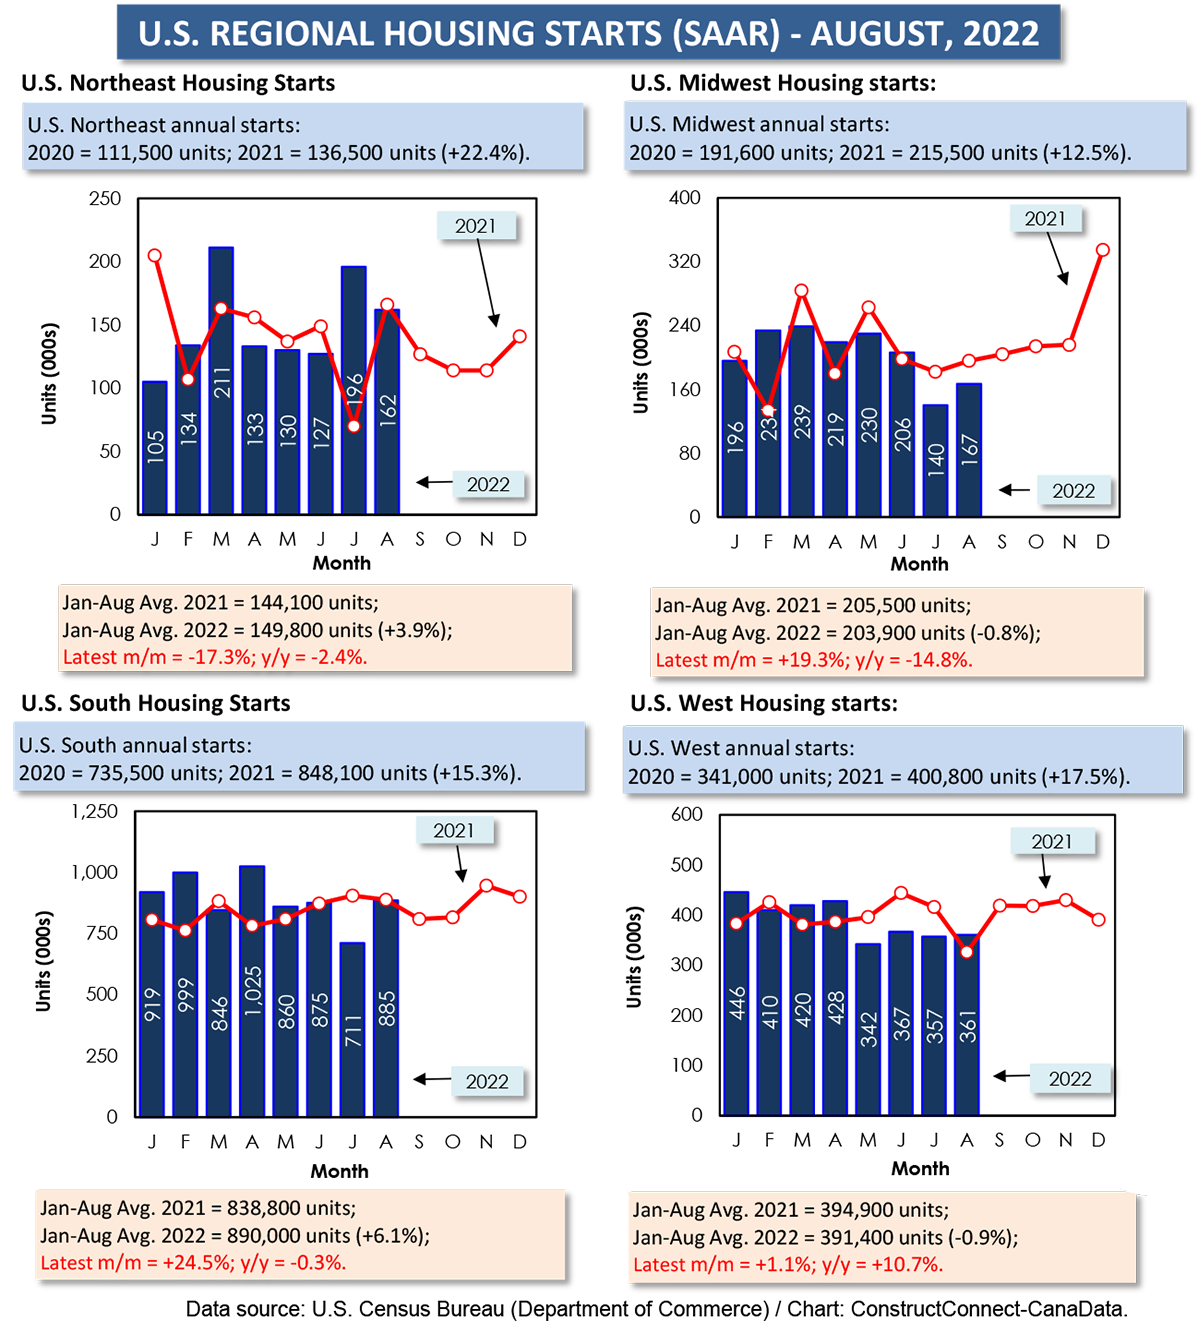
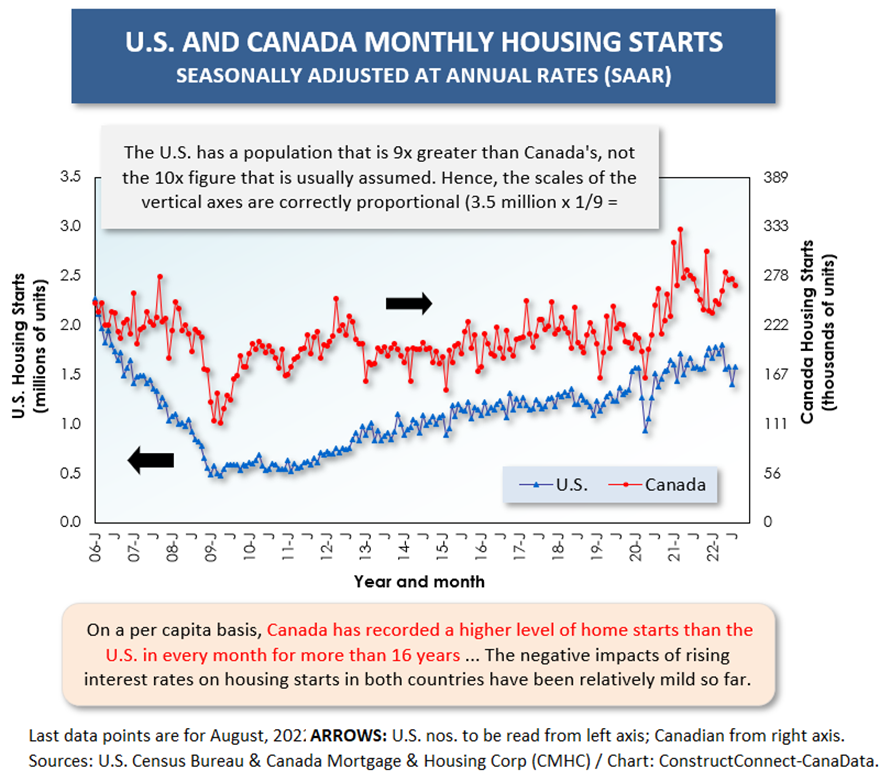
The monthly average of U.S. housing starts, seasonally adjusted and annualized (SAAR), through the first eight months of the current year has been 1.635 million units, a pickup of +3.3% compared with last year’s Jan-Aug average of 1.583 million units.
Admittedly, the individual month of July’s level was weak at 1.404 million units SAAR, but then it sprang back up to 1.575 million units in August.
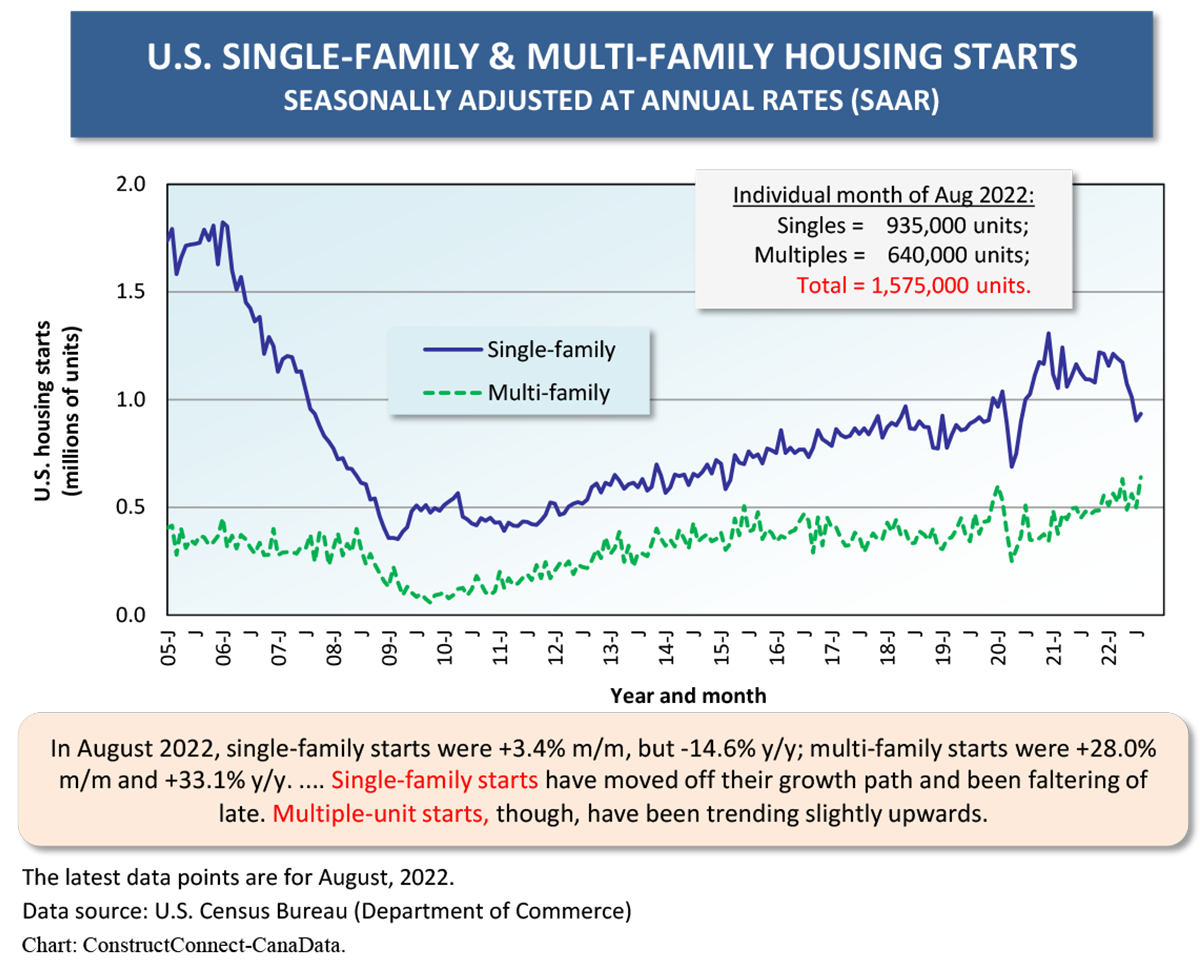
House prices that have increased by as much as one-fifth year over year, damaging affordability, have dampened U.S. single-family homebuilding. Their monthly average this year, in units, has been down by -3.4% versus last year. But the number of units being built in multi-family properties has surged ahead by +19.6% as a monthly average. Condo units, which are generally cheaper to purchase, have become more attractive to buyers. Plus, with accommodation overall becoming more expensive, there’s a need for more rental units in apartment buildings.
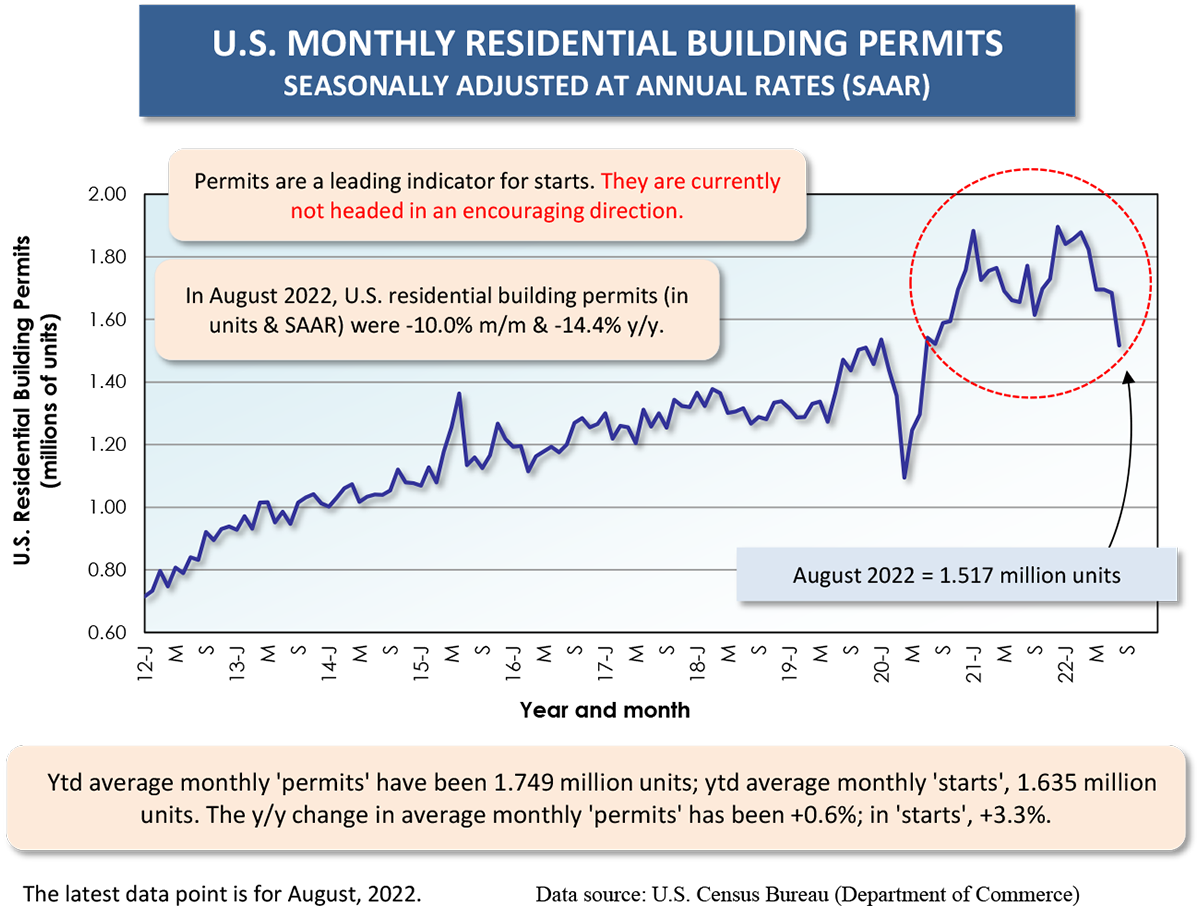
There’s a forewarning of what may be coming, however, in the residential building ‘permits’ series. Unit permits in the individual month of August were -10.0% month to month and -14.4% year over year. The historical relationship between permits and starts says that the former leads the latter by a couple of months. Weak ‘permits’ does not augur well for starts (Graph 4).
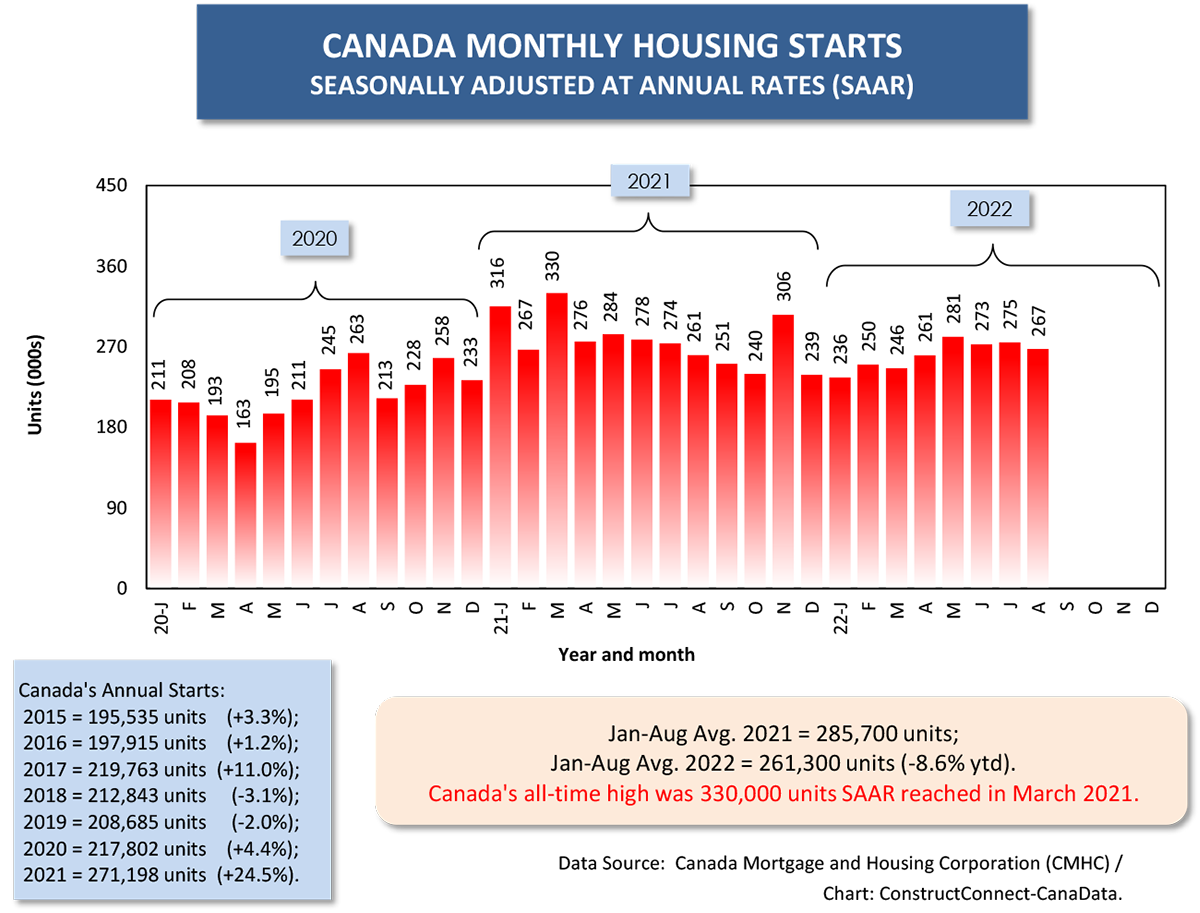
In Canada, the monthly average of starts to date this year is off by -8.6% versus Jan-Aug of last year. It’s instructive to know, however, that last year’s volume of starts was, at 285,700 units SAAR on average through August, way higher than normal. The 2000 to 2020 annual average of housing starts in Canada was 200,000 units.
The Canadian government has announced a determination to proceed with policies to greatly expand the number of houses to be constructed across the country. They’ll be needed for the huge increases in population that are occurring. Canada has become unique among developed nations in heartily promoting immigration.
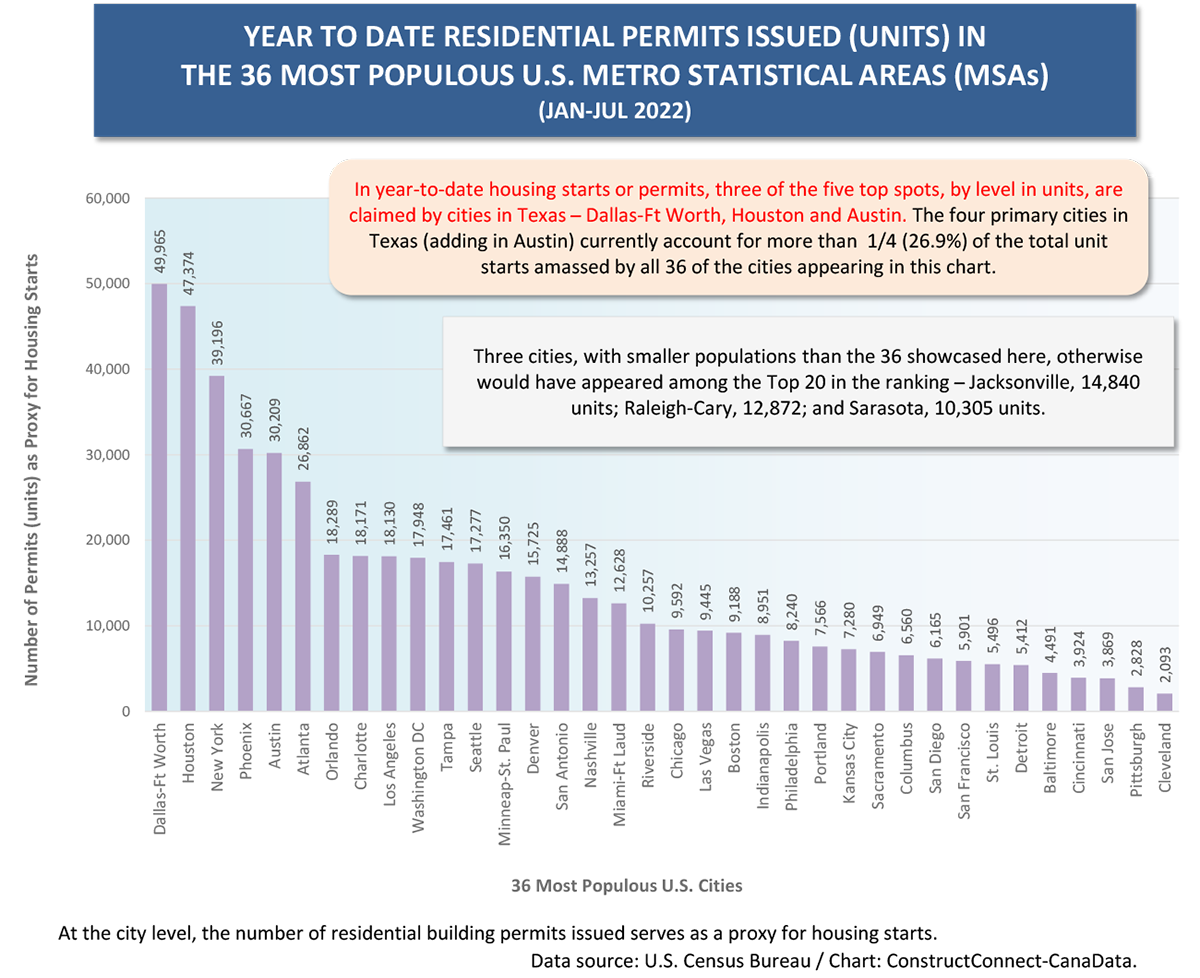
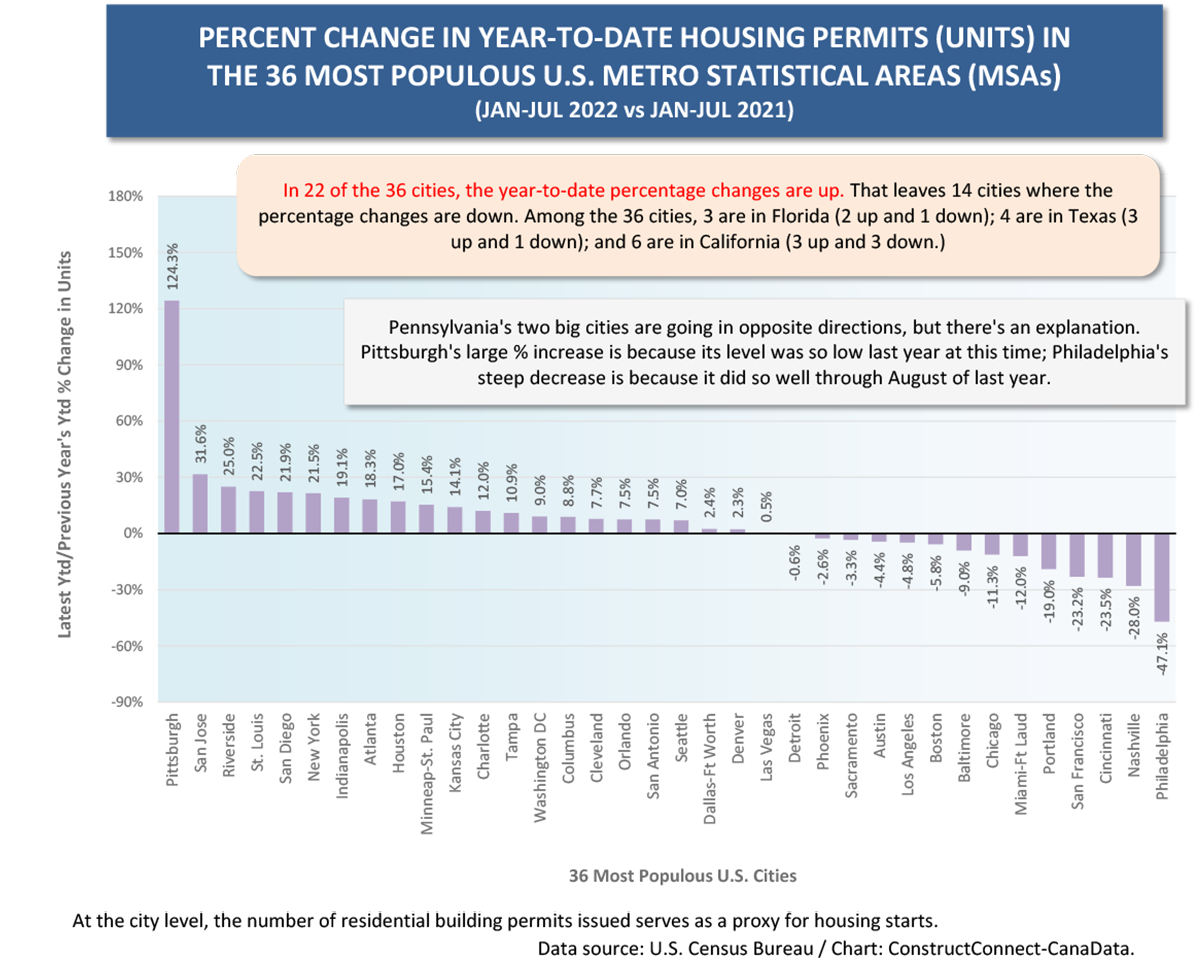
Some other highlights from the graphs appear in the bullet points which follow. By the way, at the city level, the Census Bureau only publishes ‘permits’ data. Analysts accept that the words ‘permits’ and ‘starts’ are interchangeable when speaking of local housing markets.
- Texas is home to three of the Top 5 U.S. cities for year-to-date (ytd) level of housing starts: Dallas-Ft Worth (49,965 units); Houston (47,374 units); and Austin (30,209 units) (Graph 7).
- The combined starts figure for the four largest urban centers in Texas (i.e., including San Antonio with the three mentioned above) is accounting for more than one-quarter (26.9%) of the total recorded by all 36 of America’s largest population centers.
- Other U.S. locations with relatively high levels of new home starts (between 7,000 and 10,000 units ytd each), not mentioned in Graph 7, include Cape Coral-Fort Myers and Myrtle Beach in Florida and Boise City, Idaho.
- California is home to three cities among the Top 5 for ytd percentage change in new home groundbreakings: San Jose (+31.6%); Riverside (+25.0%); and San Diego (+21.9%) (Graph 8).
- In an earlier article, I wrote about the Top 5 U.S. city labor markets. Usually, residential construction makes an important contribution to a region’s jobs climate. Currently, though, among the five, only Atlanta is displaying a good y/y housing starts performance, +18.3%. The other four are experiencing downturns: Austin, -4.4%; Miami, -12.0%; San Francisco, -23.2%; and Nashville, -28.0% (Graph 8).
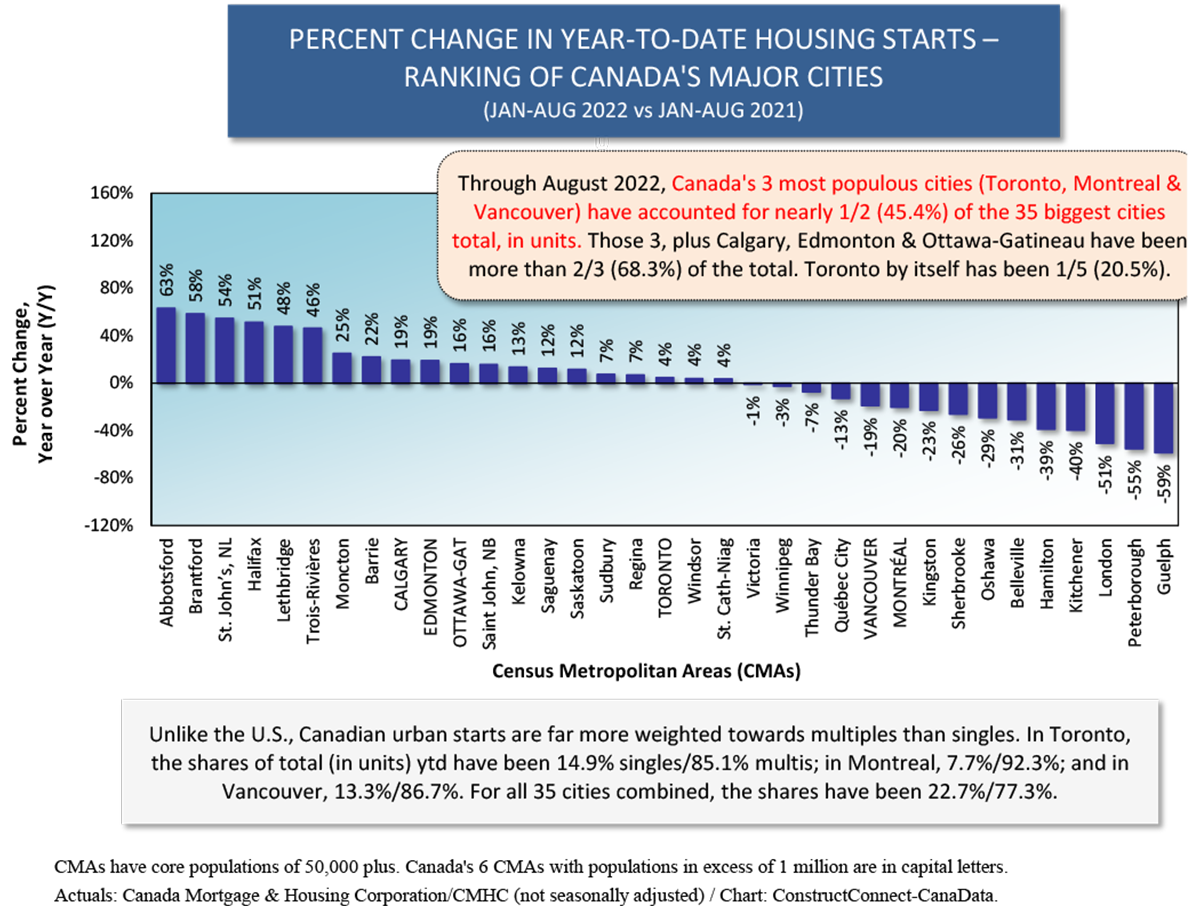
- Toronto’s 27,470 units year to date would place it sixth in a combined U.S.-Canada ranking by city housing starts. It would place after Austin but before Atlanta.
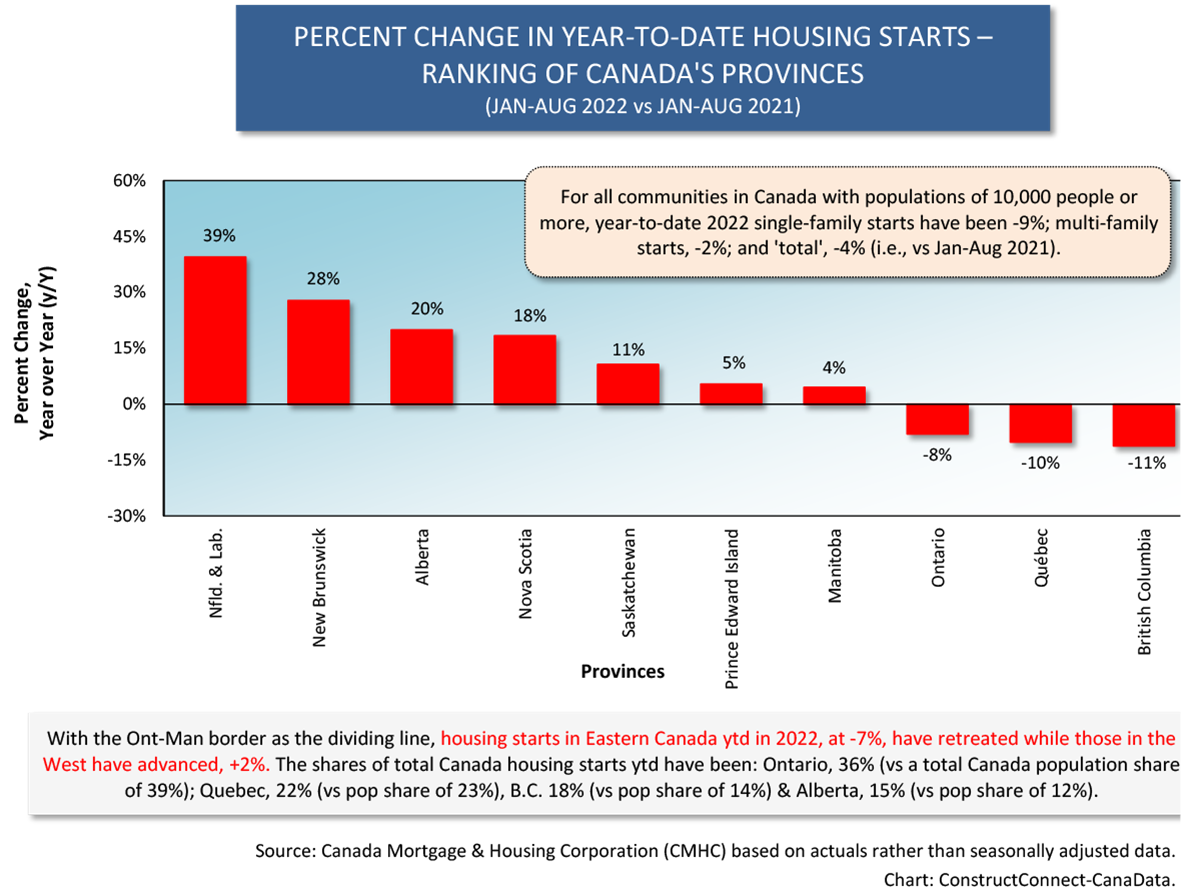
- Even though Toronto’s home starts are +4% ytd, the province of Ontario is seeing a decline of -8% (Graph 10). The reason is because quite a number of other centers in Ontario are experiencing substantial shortfalls (e.g., Guelph -59% ytd; Peterborough, -55%; London, -51%; Kitchener, -40%; and Hamilton, -39%.) (Graph 11)
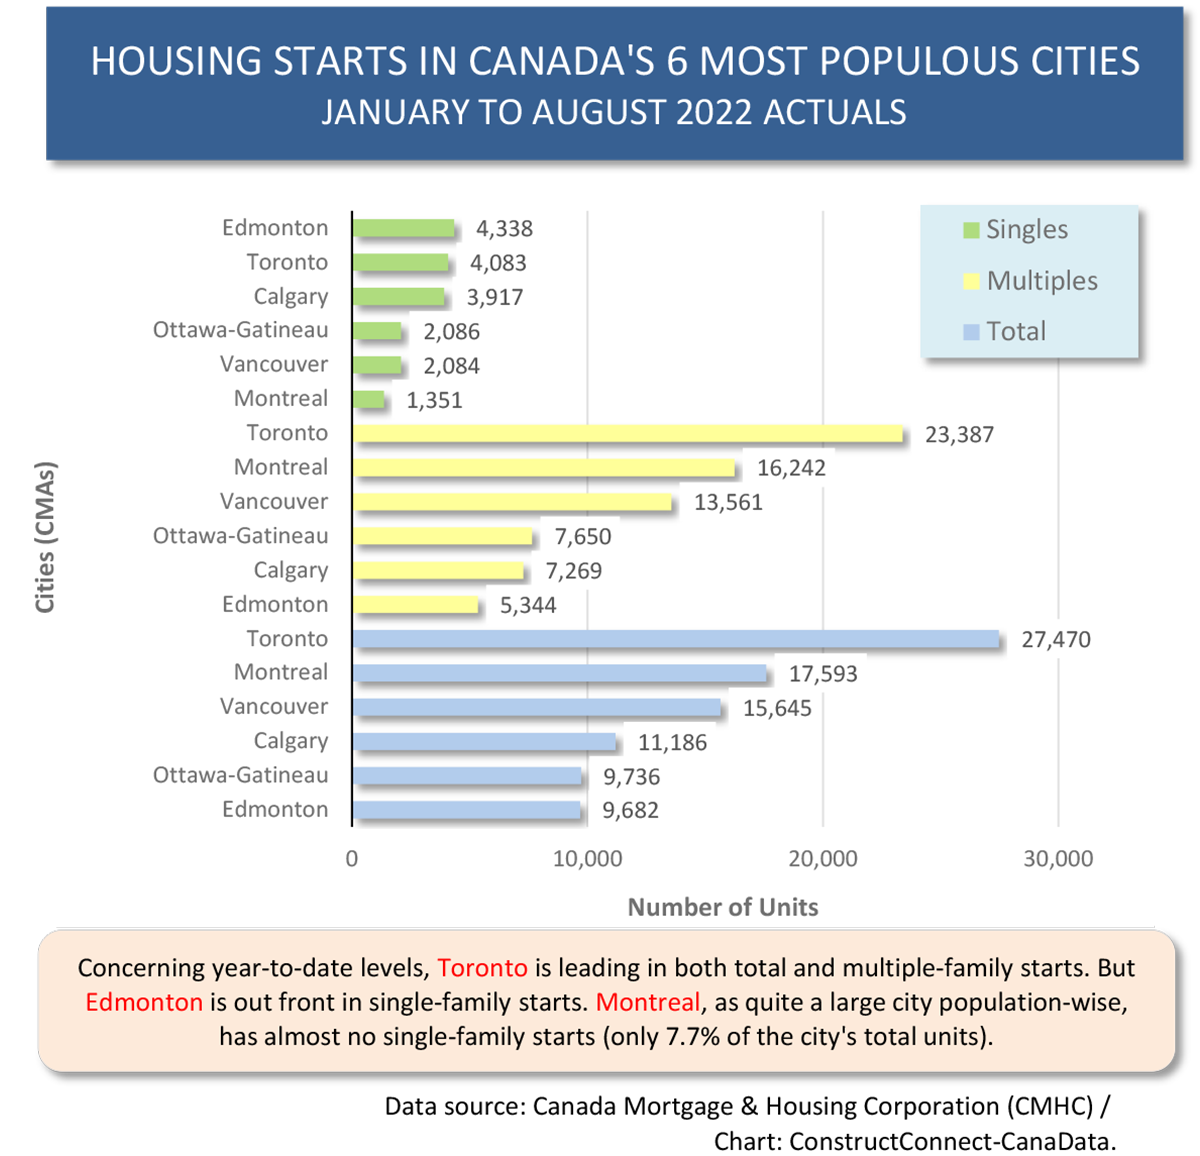
- Montreal, as a major population center, has almost no single-family home starts to speak of so far in 2022. They currently make up only 7.7% of total unit groundbreakings in the city (Graph 12).
Edmonton is leading Canadian cities for level of single-family housing starts to date this year (Graph 12).
Graph 1
Graph 2
Graph 3
Graph 4
Graph 5
Graph 6
Graph 7
Graph 8
Graph 9
Graph 10
Graph 11
Graph 12
Graph 13
Graph 14
Alex Carrick is Chief Economist for ConstructConnect. He has delivered presentations throughout North America on the U.S., Canadian and world construction outlooks. Mr. Carrick has been with the company since 1985. Links to his numerous articles are featured on Twitter @ConstructConnx, which has 50,000 followers.


Recent Comments
comments for this post are closed