Greenland as a Real Estate Play
Because it’s summertime, you take a few days off and try to relax. But when you return to work and do some catch-up reading, you learn that the President of the United States has been musing about buying Greenland. How extraordinary is that? No-one can ever accuse Mr. Trump of not thinking outside the box.

Greenland says it doesn’t want to be purchased. Greenland, an island of 60,000 inhabitants, is dependent on the financial help that it receives from Denmark.
Who knows, maybe Denmark is open to an offer. What about a bidding war?
Some other nations may want to raise their ‘paddles’ at auction as well.
Weak Foreign Trade and Stimulatory Monetary Policy
Speaking of ‘war’, or more accurately unarmed conflict, the trade battle between the U.S. and China, which once appeared close to resolution, is continuing to fester and threatens to worsen.
The Trump administration is proposing another round of tariff increases on Chinese goods, although the timing has been pushed back to December. Beijing is denying U.S. farmers access to Chinese consumers. World trade, lukewarm since the recession, has been dialed back another degree.
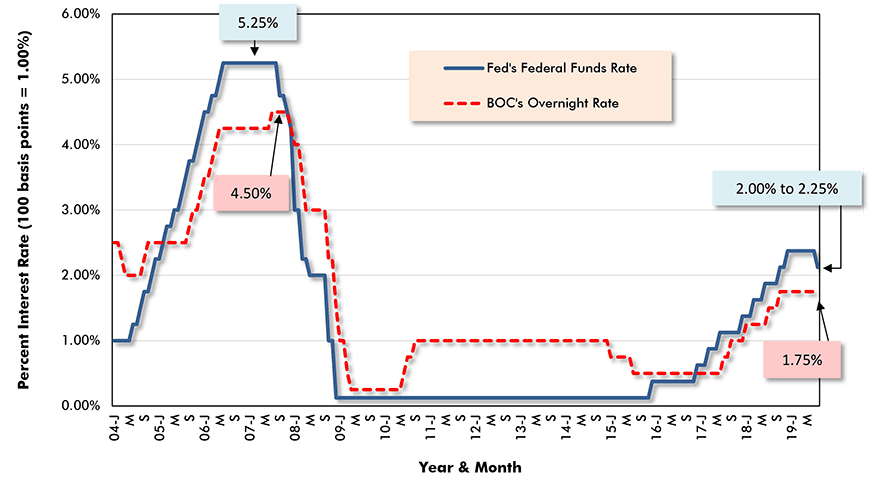
Weakness in foreign trade is slowing gross domestic product (GDP) growth in many countries, with Germany and China most in harm’s way. Slack in the United Kingdom’s outlook derives from uncertainty concerning Brexit. The upshot has been a return to stimulatory monetary policy. Central bankers are once again lowering interest rates.
Inverted Yield Curve and Non-sustainable Banking Model
Another factor inspiring central bankers to cut short-term interest rates has been the return of the dreaded yield curve ‘inversion’. Long-term yields falling below short-term yields (i.e., ‘inversion’), which has recently been the case, historically signals a soon-to-come recession. Stock market indices traditionally dive on word of a yield curve inversion.
With new rounds of short-term rate cuts occurring, credit markets nearly everywhere are entering an alien landscape. There are instances of banks in some countries (not the U.S. or Canada yet) paying borrowers to take out loans. This surely can’t be a sustainable business model for financial institutions.
Graph 1: Central Bank Key Policy-Setting Interest Rates −
Federal Reserve’s Federal Funds Rate & Bank of Canada’s Overnight Rate

Inflation Officially Still Dormant in U.S. and Canada
In July, the U.S. ‘all-items’ Consumer Price Index (CPI) rose by a modest +1.8% year over year (y/y). The ‘core’ rate of inflation, which leaves out food and energy price changes (because they can be inordinately volatile), was +2.2% y/y. The price of regular unleaded gasoline was -3.3% y/y. The only U.S. CPI line item with any real zip in July was the cost of shelter, +3.5% y/y.
Canada’s most recent inflation numbers, for June, were of a similar order of magnitude as the U.S. figures. Canadian ‘all-items’ CPI was +2.0% y/y. All-items excluding food and energy was +2.3%. As for the price of gasoline, it fell by -9.2% y/y.
Canadian Wages Soared in July
There has been one corner of costing, however, where the Canadian results have been much more dramatic than their American counterparts. Whereas U.S year-over-year earnings in July ranged between +2.5% and +3.5% hourly and weekly, compensation rates north of the border were a whole lot sprightlier.
For all employees in Canada, average earnings in July were +4.5% hourly and +4.6% weekly (both y/y). In the unionized workforce, the latest wage gains were +3.4% hourly and +3.1% weekly. For non-unionized workers, the pick-ups were +5.0% hourly and +5.3% weekly.
July’s y/y weekly wage gain in Canada for both unionized and non-unionized full-time workers was +4.6%. The comparable advance for part-time workers was only half as much, +2.3%.
U.S. Foreign Trade Still in a Deep Hole; Canada’s Back to Balance
Regardless of efforts to block Chinese imports, the U.S. still can’t point to foreign trade as an engine of growth at this time. America’s trade balance remains deeply in deficit. In June, it was -$662 billion annualized. The ‘goods’ deficit alone was -$902 billion. Nor has the goods shortfall diminished to any significant degree. America’s foreign trade problem is only made tenable by a noteworthy surplus in services, +$240 billion annualized.
Canada’s merchandise (or ‘goods’) trade balance in July was barely on the positive side of the ledger, +$2 billion CAD annualized. Just the same, that’s a commendable improvement compared with the end of last year, when it was -$60 billion CAD annualized.
U.S. Non-store Retail Sales +16% Y/Y
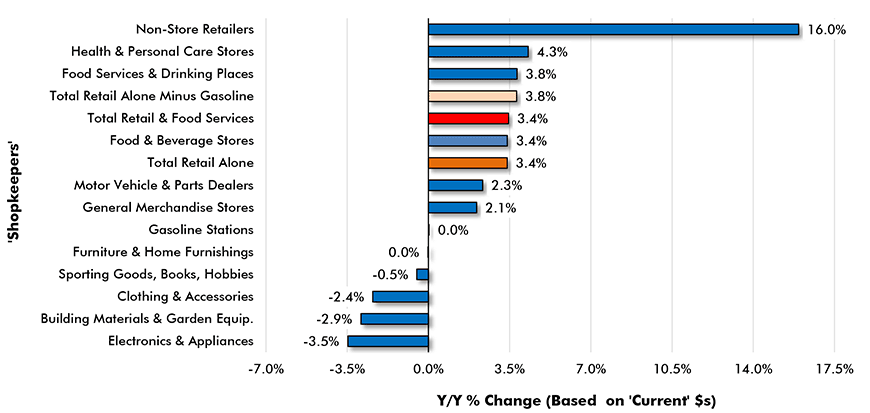
For the U.S. economy to keep firing on all cylinders, consumers must continue to maintain their strong spending pace. Total retail sales in July were a healthy +3.4% y/y, but the composition of those sales was quite a departure from the old norm.
There were year-over-year sales declines in ‘clothing and accessories’ (-2.4%), ‘building materials and garden equipment’ (-2.9%) and ‘electronics and appliances’ (-3.5%). Elsewhere in the ‘space’, however, there was the outstanding achievement racked up by non-store retailers (e.g., Internet platforms and electronic auction houses), +16.0% y/y.
Non-store retailers now account for nearly 15% of all U.S. retail sales. Their share has nearly doubled since the recession.
Graph 2: U.S. Retail Sales, Year over Year (Y/Y) − July 2019

Alex Carrick is Chief Economist for ConstructConnect. He has delivered presentations throughout North America on the U.S., Canadian and world construction outlooks. Mr. Carrick has been with the company since 1985. Links to his numerous articles are featured on Twitter @ConstructConnx, which has 50,000 followers.
CanaData 2019 Conference – Canada’s construction forecasts conference –
October 18, 2019, Globe & Mail Centre, Toronto – Learn more below.


Recent Comments
comments for this post are closed