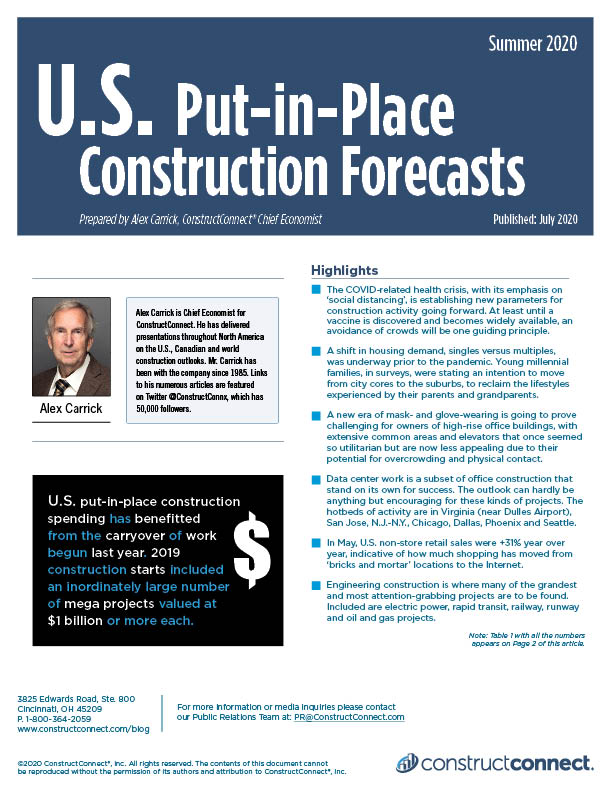
U.S. put-in-place construction spending, during the coronavirus health crisis, has benefitted from the carryover of work begun last year. 2019 construction starts included an inordinately large number of mega projects valued at $1 billion or more each. There were 35 such projects last year, with a summed value near $80 billion, or 15% of nonresidential groundbreakings.

At the end of this piece is an appendix outlining the differences between ‘starts’ and ‘put-in-place’ statistics on construction activity.
(Also read, 10 Pandemic Impacts on Construction Costing.)
ConstructConnect’s latest ‘put-in-place’ (PIP) forecasts are set out in the Table below and appear in a series of type-of-structure graphs. The graphs of ‘actuals’ and ‘forecasts’ also include Excel-generated trend lines.
Mostly, the trend lines capture only a loose approximation of how the data series moves over time. In a few instances, however, mainly among engineering sub-categories of work, there is a close relationship between ‘trend’ and ‘actuals/forecasts’. Those cases yield high R2 values, a statistical term and calculation indicating close correlation.
R2 can run from 0.00 to 1.00, where 0.85 and above indicates a good ‘fit’. In what follows, R2 values are shown only for those graphs exhibiting a strong degree of tightness.
Download this article as a PDF.
Three Key Words: Congestion, Propensities and Mobility
The COVID-related health crisis, with its emphasis on ‘social distancing’, is establishing new parameters for construction activity going forward. At least until a vaccine is discovered and becomes widely available, an avoidance of crowds will be one guiding principle.
Rapid-fire growth in ‘working from home’ is another way in which society and the economy are being reshaped. An important question for the longer-term is how personal preferences will be changed by today’s experiences. If working remotely really takes hold, then old patterns of movement around the country will be given a makeover.
Those forces are captured in the three words ‘congestion’, ‘propensities’ and ‘mobility’ and one or two or three of them come into play in the outlooks for nearly every sub-category of construction.
Table 1: U.S. Construction Spending (put-in-place investment)
(billions of “current” $s)
| actuals | forecasts | |||||||
| Type of Construction: | 2015 | 2016 | 2017 | 2018 | 2019 | 2020 | 2021 | 2022 |
| Grand Total | 1130.7 | 1211.4 | 1265.8 | 1307.2 | 1306.9 | 1247.9 | 1264.9 | 1314.2 |
| (year versus previous year) | 7.1% | 4.5% | 3.3% | 0.0% | -4.5% | 1.4% | 3.9% | |
| Total Residential | 429.2 | 473.7 | 531.8 | 546.1 | 522.0 | 490.7 | 507.8 | 533.2 |
| 10.4% | 12.3% | 2.7% | -4.4% | -6.0% | 3.5% | 5.0% | ||
| Total Nonresidential | 701.5 | 737.7 | 734.1 | 761.1 | 784.9 | 757.2 | 757.1 | 781.0 |
| 5.2% | -0.5% | 3.7% | 3.1% | -3.5% | 0.0% | 3.2% | ||
| Total Commercial/for Lease | 145.0 | 173.7 | 185.0 | 201.4 | 198.2 | 181.0 | 175.2 | 179.3 |
| 19.8% | 6.5% | 8.9% | -1.6% | -8.6% | -3.2% | 2.3% | ||
| Lodging | 22.0 | 27.1 | 28.7 | 31.5 | 33.6 | 26.2 | 24.9 | 25.4 |
| 23.0% | 5.8% | 9.9% | 6.6% | -22.0% | -5.0% | 2.0% | ||
| Office | 56.0 | 67.9 | 68.7 | 74.5 | 79.2 | 72.9 | 68.5 | 68.9 |
| 21.2% | 1.1% | 8.4% | 6.4% | -8.0% | -6.0% | 0.5% | ||
| Commercial/Retail | 67.0 | 78.7 | 87.6 | 95.4 | 85.4 | 81.9 | 81.8 | 85.1 |
| 17.5% | 11.3% | 8.9% | -10.5% | -4.0% | -0.2% | 4.0% | ||
| Total Institutional | 157.6 | 167.8 | 178.5 | 181.1 | 183.2 | 170.4 | 168.6 | 173.4 |
| 6.4% | 6.4% | 1.4% | 1.2% | -7.0% | -1.0% | 2.8% | ||
| Health Care | 39.7 | 40.6 | 43.1 | 42.6 | 44.2 | 46.0 | 47.6 | 49.3 |
| 2.3% | 6.3% | -1.1% | 3.8% | 4.0% | 3.5% | 3.6% | ||
| Educational | 85.3 | 91.6 | 96.7 | 97.8 | 98.0 | 88.2 | 85.5 | 87.7 |
| 7.4% | 5.5% | 1.1% | 0.2% | -10.0% | -3.0% | 2.5% | ||
| Religious | 3.6 | 3.8 | 3.6 | 3.3 | 2.9 | 2.5 | 2.4 | 2.4 |
| 4.3% | -4.4% | -9.0% | -9.8% | -15.0% | -4.0% | -1.0% | ||
| Public Safety | 8.5 | 8.2 | 8.5 | 9.5 | 10.2 | 10.9 | 11.2 | 11.4 |
| -3.9% | 4.4% | 10.9% | 7.4% | 7.0% | 2.6% | 2.4% | ||
| Amusement and Recreation | 20.5 | 23.7 | 26.6 | 27.9 | 27.8 | 22.8 | 21.9 | 22.6 |
| 15.2% | 12.3% | 5.1% | -0.3% | -18.0% | -4.0% | 3.0% | ||
| Total Engineering/Civil | 315.7 | 316.6 | 299.9 | 307.9 | 329.3 | 340.4 | 346.3 | 358.6 |
| 0.3% | -5.3% | 2.7% | 6.9% | 3.4% | 1.7% | 3.6% | ||
| Transportation | 45.1 | 43.3 | 46.1 | 51.4 | 54.7 | 55.8 | 54.3 | 55.5 |
| -3.9% | 6.5% | 11.5% | 6.3% | 2.0% | -2.6% | 2.1% | ||
| Communication | 21.7 | 22.2 | 23.7 | 24.6 | 23.5 | 23.6 | 24.1 | 24.8 |
| 2.2% | 6.8% | 4.0% | -4.7% | 0.6% | 2.0% | 3.0% | ||
| Power | 111.5 | 112.1 | 96.0 | 93.2 | 100.4 | 102.9 | 105.4 | 111.7 |
| 0.5% | -14.4% | -2.9% | 7.8% | 2.5% | 2.4% | 6.0% | ||
| Highway and Street | 91.7 | 93.2 | 89.6 | 91.1 | 98.8 | 106.7 | 109.8 | 112.6 |
| 1.6% | -3.8% | 1.7% | 8.4% | 8.0% | 2.9% | 2.6% | ||
| Sewage and Waste Disposal | 24.6 | 24.2 | 22.9 | 23.9 | 26.1 | 26.8 | 27.3 | 27.8 |
| -1.8% | -5.2% | 4.5% | 9.2% | 2.5% | 1.8% | 1.9% | ||
| Water Supply | 13.4 | 13.9 | 14.2 | 15.3 | 16.4 | 17.0 | 17.3 | 17.7 |
| 4.4% | 1.6% | 8.1% | 7.3% | 3.2% | 2.1% | 2.2% | ||
| Conservation and Development | 7.7 | 7.7 | 7.5 | 8.3 | 9.3 | 7.6 | 8.0 | 8.4 |
| 0.1% | -3.6% | 10.6% | 12.4% | -18.0% | 5.4% | 5.0% | ||
| Total Industrial/Manufacturing | 83.1 | 79.6 | 70.7 | 70.8 | 74.3 | 65.4 | 67.0 | 69.7 |
| -4.2% | -11.2% | 0.1% | 5.0% | -12.0% | 2.5% | 4.0% | ||
“Current” means not adjusted for inflation.
Source of actuals: U.S. Census Bureau / Forecasts: ConstructConnect.
Table: ConstructConnect.
Put-in-place (PIP) Investment
Chart: ConstructConnect.
Residential Construction Outlook
A good starting point when considering the outlook for construction activity is population growth. Simply put, more people need more housing and other support structures.
The rate of population increase for the U.S. was slowing dramatically before the health crisis. In the latest full year for which data is available, it was +0.5% per annum.
Furthermore, whatever population advance has been achieved of late has included a large element of immigration. Now, immigration in both its forms, legal and illegal, has dried up.
There’s a belief among analysts that the equilibrium level for U.S. housing starts is 1.6 million units annually. According to that benchmark, which has remained unattained since the last recession in 2008-09, a great deal of pent-up demand has accumulated over the past decade.
Since 2000, however, the monthly average of seasonally adjusted and annualized (SAAR) U.S. housing starts has been 1.25 million units. If 1.25 million is the norm, then the extent of pent-up demand is being overestimated.
A shift in housing demand, singles versus multiples, was underway prior to the pandemic. Young millennial families, in surveys, were stating an intention to move from city cores to the suburbs, to reclaim the lifestyles experienced by their parents and grandparents. Also, pricing for housing downtown has become prohibitive in many cities.
Congestion downtown, and in high-rise buildings (offices and condo towers) is currently providing another incentive to move to the ‘burbs or to a rural community. One of the chief drawbacks to doing so, a long commute back and forth to work, has been taken off the table. Working from home has proven to be a viable alternative.
Grounding one’s work from home is certainly the thing to do for the moment. Whether it will continue to be as prevalent post-pandemic and longer-term is a key question that will only be answered in time. But it has some interesting things to say about mobility.
Americans on the move to new jobs has long been a driving force behind the construction of new residences. Moving to the outskirts and working from home will contribute to some increase in mobility. But once established at home, there will be less need to relocate when a new and hopefully better job offer comes along.
This development also has an important implication for company hiring. For company personnel departments, the pool for potential workers to fill many positions has become, geographically, much larger. The best choice for the job may live almost anywhere, provided they have speedy and reliable Internet access.
Put-in-place (PIP) Investment
Chart: ConstructConnect.
Nonresidential Building Construction Outlook
A new era of mask- and glove-wearing is going to prove challenging for owners of high-rise office buildings, with extensive common areas and elevators that once seemed so utilitarian but are now less appealing due to their potential for overcrowding and physical contact.
Construction of office space has taken off over the last several years, thanks primarily to rapid expansion in the high-tech sector ‒ e.g., outstanding growth by software, computer systems design and venture capital firms. By necessity, those companies have shifted staffing offsite. Feared losses in productivity have not materialized. In fact, the opposite has often been the case.
Some tenants are considering taking on more space to allow for fulsome social distancing. Many others ‒ indeed, far more ‒ have announced plans to continue with present at-home arrangements long term. Or to stagger schedules so that different departments report to work on alternate days. The opportunity to reduce the cost of leasing holds a lot of appeal.
Since leasing contracts usually extend out five years, the first signs of office space becoming more readily available will show up in the sublet market.
Data center work is a subset of office construction that stand on its own for success. The outlook can hardly be anything but encouraging for these kinds of projects. The hotbeds of activity are in Virginia (near Dulles Airport), San Jose, N.J.-N.Y., Chicago, Dallas, Phoenix and Seattle.
In May, U.S. non-store retail sales were +31% year over year, indicative of how much shopping has moved from ‘bricks and mortar’ locations to the Internet. Many big-name retailers have fallen into bankruptcy protection or have closed multiple locations. Meanwhile, Amazon has gone on a hiring spree. (Walmart is one of the few traditional retailers that has been making significant additions to its workforce.)
The problem for retail construction isn’t just the diminishing demand to build ‘new’. The bigger issue is the ‘overhang’. Empty space needs to be occupied again (i.e., re-leased) before there will be much incentive to invest in additional square footage.
Empty retail showroom space is being put to interesting uses. Workout gyms, of course, have popped up everywhere. Also moving into some malls have been auto dealerships and medical clinics. Converting commercial to residential is also a trend being noticed.
The inverse of retail’s downturn in construction is to be found in the warehouse type of structure category. Giant well-positioned warehouses and smaller local distribution centers have been springing up in strategic spots across the country and in urban centers. With respect to their job-creating impact on the economy, however, there’s one thing to know. Whenever possible, they utilize robotics. (The same will be said for manufacturing activity going forward, but that will be covered further along in this report.)
Automation as a trend has been given an extra boost by the pandemic. Nothing says ‘social distancing’ like robotics.
Severely reduced tourist and business travel due to COVID-19’s extensive reach has sent hotel and motel occupancy rates plunging. Capital spending in the hospitality sector was on the downside of a recent peak anyway. From 2017 to 2019, hotel/motel investment was booming. But the sector, along with restaurants and bars, has been among the hardest hit segments of the economy in the health crisis.
As for structures geared towards amusement and recreation ‒ i.e., arenas and stadiums, concert halls, convention centers, casinos, cinemas, etc. ‒ the jury is still out on the timing of when, and according to what proportion, the general public will feel comfortable mingling in large and close-contact gatherings again. A vaccine will do much to alleviate concern, but there’s no ‘for-sure’ date on that front.
As if the demographics of an aging population wasn’t enough to argue for more medical facility construction, along comes the coronavirus to expose gaping shortfalls in ICU capacity. And failings in the ability to properly and compassionately isolate patients. (Trade associations should be compiling ‘wish lists’ for next rounds of building code revisions.)
The same failings, heightened further, have become apparent in nursing homes (and prisons).
The need for more hospitals is clear. Funding for private hospitals, however, has been set back by cancellations of elective surgeries ‒ which are major sources of revenue ‒ in favor of allocating beds for COVID patients.
Plus, there’s a decade-long political conflict to be resolved. The Patient Protection and Affordable Care Act was signed into law in 2010. In whole, or with respect to certain parts, it is still under threat from new legislative action and/or various courtroom legal initiatives.
In the education construction space, students in lower and higher grades have been learning from home since the onset of spring. Their return to classrooms in September will depend on infection rates locally and whether proper sanitary protocols can be implemented. There are tough decisions to be made by local school boards and governing bodies.
At the level of higher education, financially well-off universities with solid endowment funds from bond and equity holdings will be fine. The prestige of attending an ivy-league institution will always be a draw. Many next-tier universities and colleges, however, may soon be facing budgetary shortcomings due to enrolment shrinkages. One former tuition mainstay, attendance by foreign students, can no longer be counted on.
In K-12, capital spending will be targeted at electrical and mechanical upgrades, more learning-effective design arrangements and technological improvements. Further along in schooling, investment dollars are going towards teaching hospitals and academic-business-public-sector joint venture research facilities.
The economy lockdowns in March and April have caused the capacity utilization rate in the U.S. manufacturing sector to contract to just above 60% from over 70%. Firms in sub-sectors of manufacturing won’t look at enlarging their footprints until capacity usage in their industrial niche has climbed near 80% as a floor.
Just the same, there are undercurrents pointing to swifter streams of investment by manufacturers.
Significant portions of the usage rate declines were due to temporary shutdowns in the auto sector and closures of several large meat packing plants for health reasons. The production lines of motor vehicle and parts plants are now back up and running. And food processors have been ordered to carry on under provisions of the Defense Production Act, although it should be added that owners have made better efforts to educate workers on healthier safety practices.
As an aside, the need to build significant additional cold storage capacity is a positive offshoot from woes in the meat packing industry.
International supply chain interruptions, with the coronavirus first appearing in Wuhan province, China, have taught a lesson about the perils of globalization. A trend towards deglobalization, which again was already underway (e.g., Apple bringing component production back to America), will spur on more investment at home.
But there are two caveats. First, automation and robotics will take precedence over manpower increases. Second, on the far side of the present shocks, companies – to stay competitive ‒ will inevitably, over the longer-term, seek out low cost suppliers, wherever they may be.
Manufacturing PIP construction in the past couple of years has been lifted by a category of work not related to the typical image of partially assembled products rolling along conveyor belts. Augmenting the tally of mega projects have been giant-sized petrochemical plants, refineries and LNG exporting terminals.
Put-in-place (PIP) Investment
Chart: ConstructConnect.
Put-in-place (PIP) Investment
Chart: ConstructConnect.
Put-in-place (PIP) Investment
Chart: ConstructConnect.
Put-in-place (PIP) Investment
Chart: ConstructConnect.
Put-in-place (PIP) Investment
Numbers for this series prior to 2002 are no longer consistent with more current data.
Chart: ConstructConnect.
Put-in-place (PIP) Investment
Numbers for this series prior to 2002 are no longer consistent with more current data.
Chart: ConstructConnect.
Put-in-place (PIP) Investment
Chart: ConstructConnect
Engineering Construction Outlook
Engineering construction is where many of the grandest and most attention-grabbing projects are to be found. Included are electric power, rapid transit, railway, runway and oil and gas projects.
As for big resource projects in metals and mining, ‘green-lighting’ will have to wait for a pickup in world trade and commodity prices. The not seasonally adjusted (NSA) unemployment rate in ‘mining, quarrying and oil and gas extraction’ in June 2020 soared to 17.8%. In June 2019, it had been 3.2%.
Also, with civil projects, there are serious financing issues that will act as constraints. State and local governments have become cash-strapped on account of lower income, sales and property tax receipts. Transit fares have fallen far short of expectations held prior to the coronavirus crisis.
Nor do states and cities feel they have received their fair share of financing relief help from Washington. Belt tightening that has extended to police forces and fire protection services has been one answer.
Cuts to planned infrastructure repairs and postponements or cancellations of new projects are other so-called ‘easy ways’ to save money.
Roadwork and bridge construction would seem highly susceptible to funding reductions carried out as austerity measures. But there are some interesting wrinkles. Roadbuilders have found the pandemic to be an opportune time to put on their hard hats, get out their caution flags and mark out their territory with black- and orange-striped cones. A lessening in hazardous traffic flows allows safer road repairs and the laying down of widenings and extensions.
As shown in Graph 11, highway and street work has been one of the truest-to-trend sub-categories of all construction going back to near the beginning of this century. In PIP terms, it has an exceptionally high R2 value of 0.924.
The annual average increase in roadwork put-in-place construction spending since 2010 has been +2.0%, almost exactly in keeping with the annual advance in the nation’s gross domestic product.
Lately, expenditures on bridges have sprung to life. Years of assessment reports giving failing grades to American bridges with respect to their structural integrity have finally led to firm action. Headline-making bridge collapses in other countries (e.g., in Genoa, Italy) have also sounded a clarion call.
Like roadwork, water and sewer PIP construction tends to follow a stable, gradually-upward-sloping path. Since 2010, the annual average increase in capital spending on this category of work has been +1.0%. Repairs to existing infrastructure are important, but new work mostly ties to residential construction.
Nearly every major city in America has a massive spending program planned for rapid transit and the handling of air traffic. (Passenger terminals for both these categories are placed under ‘Transportation’ in the Census Bureau’s PIP data set. They involve large amounts of engineering-style construction nonetheless.)
Expect a few rapid transit project cancellations to save money for a city or two. Besides, remember the words ‘mobility’ and ‘propensities’ introduced earlier in this report. Nobody knows, from this present vantage point, how commuter flows and domestic and foreign air traffic will be affected long-term. Will a new sense of caution over mixing with others become ingrained?
Finally, there are two other type-of-structure categories for consideration. Electric power construction will increasingly lean towards renewables, especially wind and solar. And all previous spending on communications has proven its worth many times over in these overcast days. Establishment of 5G networking that crisscrosses the country from most-populated regions to least is a top priority.
Put-in-place (PIP) Investment
Numbers for this series prior to 2002 are no longer consistent with more current data.
Chart: ConstructConnect
Put-in-place (PIP) Investment
Numbers for this series prior to 2002 are no longer consistent with more current data.
Chart: ConstructConnect
Put-in-place (PIP) Investment
Numbers for this series prior to 2002 are no longer consistent with more current data.
Chart: ConstructConnect
Put-in-place (PIP) Investment
Chart: ConstructConnect
Appendix A: ‘Starts’ versus ‘Put-in-place’ Statistics
The following discusses ‘starts’ versus ‘put-in-place’ capital spending statistics.
The Census Bureau’s put-in-place (PIP) statistics are like progress payments or ‘work-in-process’ payments as a project proceeds.
ConstructConnect’s ‘starts’ figures are built-up. They are based on specific project-value estimates, with the full dollar amount entered at the beginning.
Consider a $60 million office tower for which ground is broken in July 2020. It will appear in the Census Bureau’s numbers as spending of approximately $15 million this year; $25 million next year; and the final $20 million in 2022.
For the ‘starts’ series, the entire estimated value ($60 million) will be entered in July 2020.
The starts are more volatile. Their cyclical swings are greater. Their amplitudes are wider.
But they are also ‘leading indicators’ for the investment numbers. A cyclical peak for starts will appear before a cyclical peak for the PIP series. The same goes for cyclical troughs.
Alex Carrick is Chief Economist for ConstructConnect. He has delivered presentations throughout North America on the U.S., Canadian and world construction outlooks. Mr. Carrick has been with the company since 1985. Links to his numerous articles are featured on Twitter @ConstructConnx, which has 50,000 followers.


Recent Comments
comments for this post are closed