
Residential Permits Set Feverish Pace
There are some exciting stories to tell about new home building in the U.S. and Canada at the beginning of this year. Let’s cover the U.S. first. Monthly average U.S. housing starts (seasonally adjusted and annualized/SAAR) in 2020 were 1.396 million units, +7.8% versus 2019’s figure of 1.295 million.

In January of the current year, starts rose some more, to 1.580 million units, +13.2% versus 2020’s 12-month average.
The monthly average for single-family starts in 2020 was a conveniently memorable one million units, +12.0% to 2019’s 893,000. In January 2021, there was a further bump to 1,162,000 units, +16.2% versus last year’s monthly average.
(Multi-unit starts in 2020 did not fare as well as single-family starts. Their monthly average last year of 396,000 units was -1.6% compared with 2019’s 403,000. In January of this year, though, they managed a +5.5% increase to 418,000 units.)
But none of the foregoing is the really big story. The issuance of residential building ‘permits’ is a leading indicator of how ‘starts’ will perform in a month, or two, or three.
The ‘permits’ data series has been setting new multi-year highs for five months in a row (see Graph 4). In January of this year, they reached a level not seen since the housing boom of 2006. They zoomed skywards to 1.881 million units.
Given the current strength in permit-issuing activity, the laying of foundations for ‘starts’ is pretty much assured to remain buoyant at least through the summer and into the fall of this year.
Graph 1: U.S. Monthly Housing Starts
Seasonally Adjusted at Annual Rates (SAAR)
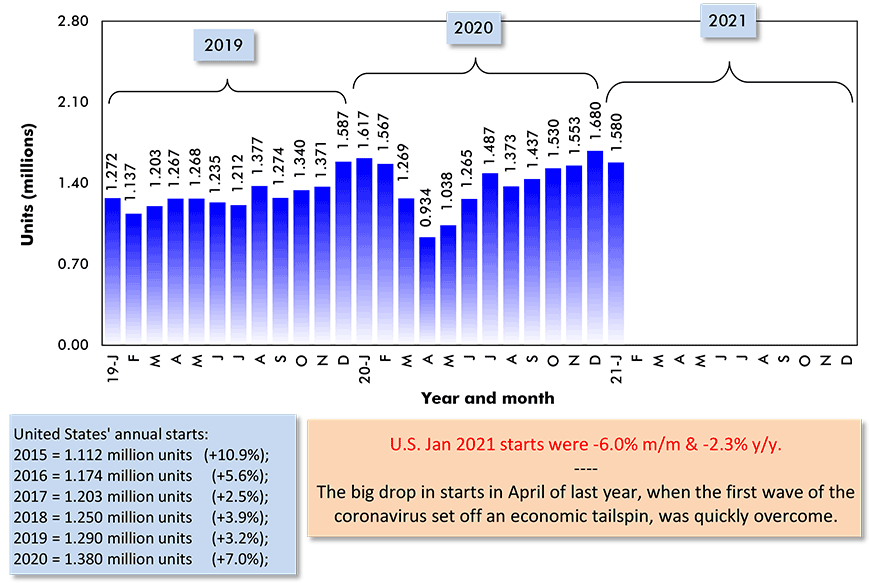
Data source: U.S. Census Bureau (Department of Commerce).
Chart: ConstructConnect.
Graph 2: U.S. Single-Family & Multi-Family Monthly Housing Starts
Seasonally Adjusted at Annual Rates (SAAR)
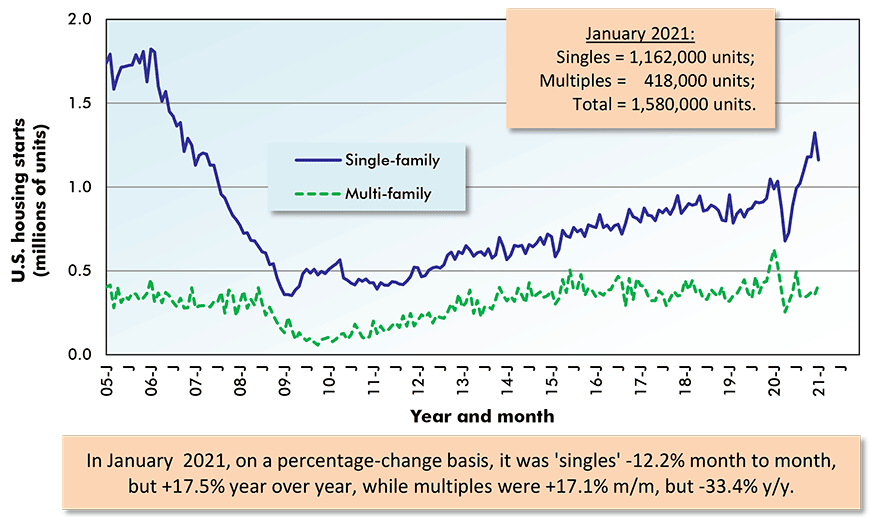
The last data points are for January 2021.
Data source: U.S. Census Bureau (Department of Commerce).
Chart: ConstructConnect.
Graph 3: U.S. Total Monthly Housing Starts
Seasonally Adjusted at Annual Rates (SAAR)
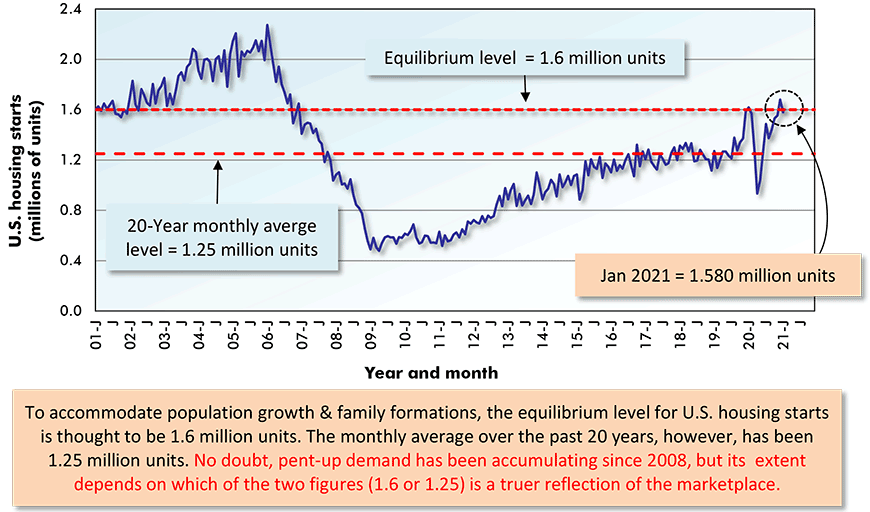
The last data points are for January 2021.
Data source: U.S. Census Bureau (Department of Commerce).
Chart: ConstructConnect.
Graph 4: U.S. Monthly Residential Building Permits
Seasonally Adjusted at Annual Rates (SAAR)
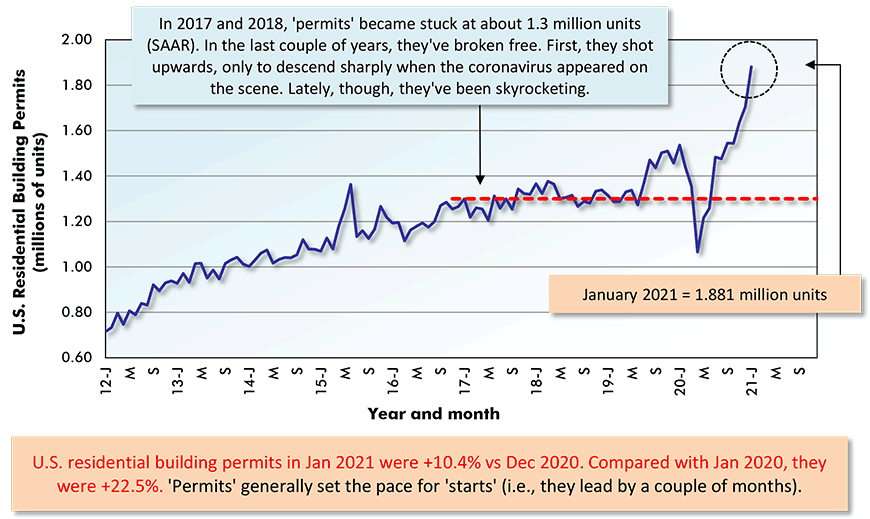
The last data point is for January 2021.
Data source: U.S. Census Bureau (Department of Commerce).
Chart: ConstructConnect.
Texas Home Building and Winter Storm Recovery
Regionally, only the Northeast recorded a decline in housing starts for full year 2020 versus full year 2019, -3.1%. The Midwest notched the biggest increase, +13.3%, followed by the South, +7.5%, then the West, +6.2%.
In January 2021, all four regions were up versus their 2020 monthly averages. The Northeast was playing catch-up, +18.6%; the Midwest and West were tied, at +14.0%; and the South was +11.8%.
For cities, ‘permits’ data is accepted by analysts as equivalent to ‘starts’ for obtaining a ‘read’ on what is occurring at the local home building level. (Current city ‘starts’ statistics are not available from the Census Bureau.)
Also, the release of city ‘permits’ information trails national ‘starts’ by a month. Therefore, only now are we seeing the 2020 annual figures on home building at the municipal level.
Graphs 5 and 6 show starts/permits for America’s 36 most populous urban areas. In 2020, three of the five urban areas with the highest levels of starts were in Texas ‒ Houston (68,400 units); Dallas-Ft Worth (60,100); and Austin (40,900).
Texas has just experienced a severe winter storm, with unusual snowfall activity and record low temperatures. Resultant power outages and bursting water pipes have led to extensive home damage. At least one estimate has placed the dollar cost in excess of what was rung up during Hurricane Harvey in August 2017.
Replacement construction is sure to make Texas a leader in home building work once again in 2021.
Graph 5: Year to Date Residential Permits Issued (Units) in the 36 Most Populous U.S. Metro Statistical Areas (MSAs)
(Jan-Dec 2020)
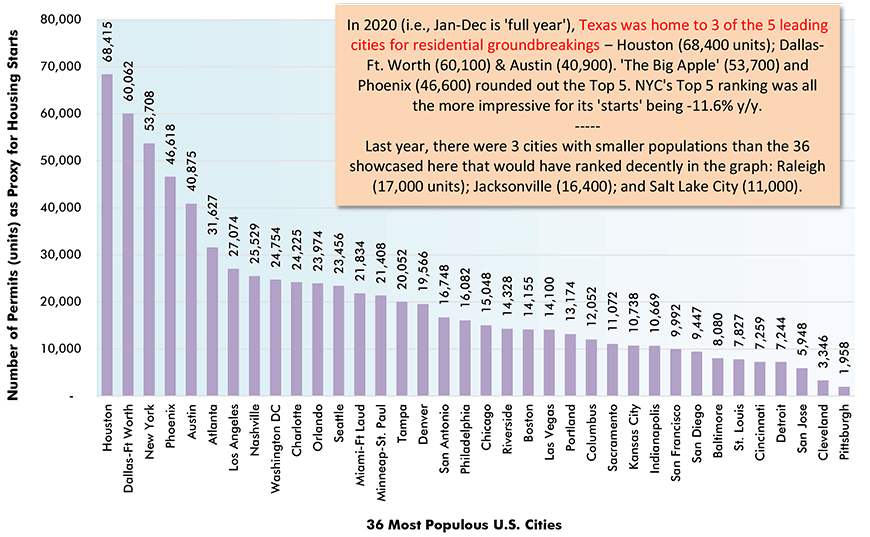
At the city level, the number of residential building permits issued serves as a proxy for housing starts.
Data source: U.S. Census Bureau.
Chart: ConstructConnect.
Graph 6: Percent Change in Year-to-Date Housing Permits Issued (Units) in the 36 Most Populous U.S. Metro Statistical Areas (MSAs)
(Jan-Dec 2020 vs Jan-Dec 2019)
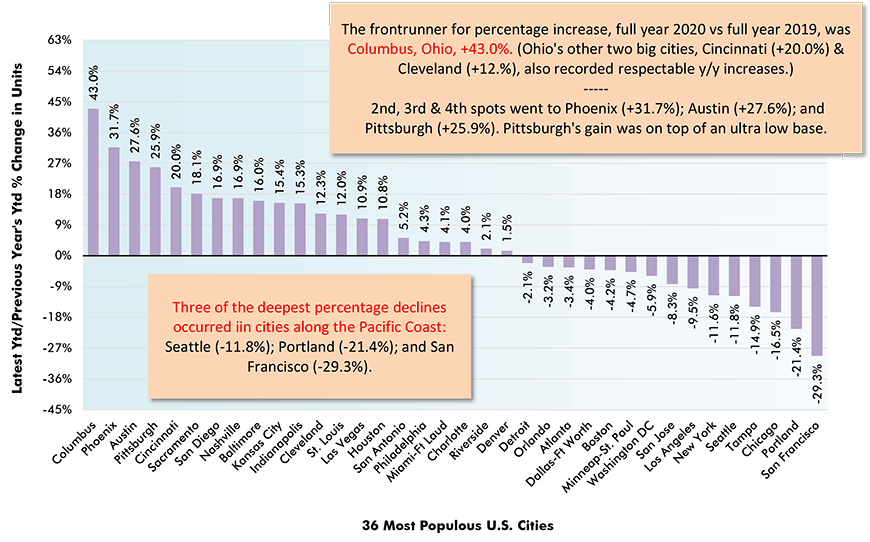
At the city level, the number of residential building permits issued serves as a proxy for housing starts.
Data source: U.S. Census Bureau.
Chart: ConstructConnect.
Two Factors Apply Chill to U.S. Housing Demand
Before leaving the U.S. for Canada, some further words on the hot housing market south of the border are warranted. When an economic indicator bubbles up, factors inevitably ‒ one might even say automatically ‒ come to the fore to push it back down.
The Federal Reserve may be holding the line with an exceptionally low federal funds rate, but long-term commercial interest rates are gradually inclining. The 10-year rate has moved back above 3.00%. Caught up in the general interest rate advance have been mortgage rates (which, in fact, are often tied to 5- and 10-year-term treasury bill rates).
The yield increases foresee inflation shaking off ingrained lethargy and beginning to kick up its heels once again. Commodity prices are already doing the ‘Can-Can’.
Housing is complicit in the commodity prices surge (see also, Soaring Lumber & Steel Prices Confirmed by Latest PPI Results). In the latest Producer Price Index (PPI) results, from the Bureau of Labor Statistics, softwood lumber is +73.0% year over year; plywood, +35.6%; and particle board and oriented strand board (OSB), +70.3%.
The PPI for gypsum is +7.0% during the past three months.
Canadian Housing Starts Reach Awesome Height
Okay, so if the U.S. homebuilding market is ‘hot’, what descriptor can best used for the Canadian residential groundbreaking scene?
How about ‘super-charged’?
In January 2021, Canadian housing starts skyrocketed to 282,000 units, a height they haven’t scaled since way back in the middle of last century. Their previous peak in the present century was 277,000 units in February 2007.
Canada’s full year 2020 starts at 217,000 units were +4.4% versus 2019’s level of 208,700 units.
January 2021 at 282,000 units was +29% compared with the monthly average for last year.
Also noteworthy is the regional breadth of the increase in starts that occurred in January of this year. As shown in Graph 8, every province achieved a percentage increase in the latest reporting month compared with January of 2020.
The least of the percentage jumps was +24% y/y (or about one-quarter) in Newfoundland and Labrador.
From Graph 8, the frontrunner for y/y percentage increase among Canada’s six most populous cities in January 2021 was Calgary, +75%. Following next in line were Vancouver, +36%; Montreal, +21%; Edmonton, +20%; Toronto, +16%; and Ottawa-Gatineau, +8%.
Toronto (+27% y/y) and Ottawa-Gatineau (+16%) are coming off bullish years for housing starts in full year 2020 over full year 2019. Vancouver (-21%) and Calgary (-22%) struggled last year.
Opposite to the U.S., multiples, made up mostly of townhouses and condo towers, dominate the Canadian home building marketplace. In January, for Canada’s 35 census metropolitan areas (CMAs), they accounted for 80% of total units initiated.
Graph 7: Canada Monthly Housing Starts
Seasonally Adjusted at Annual Rates (SAAR)
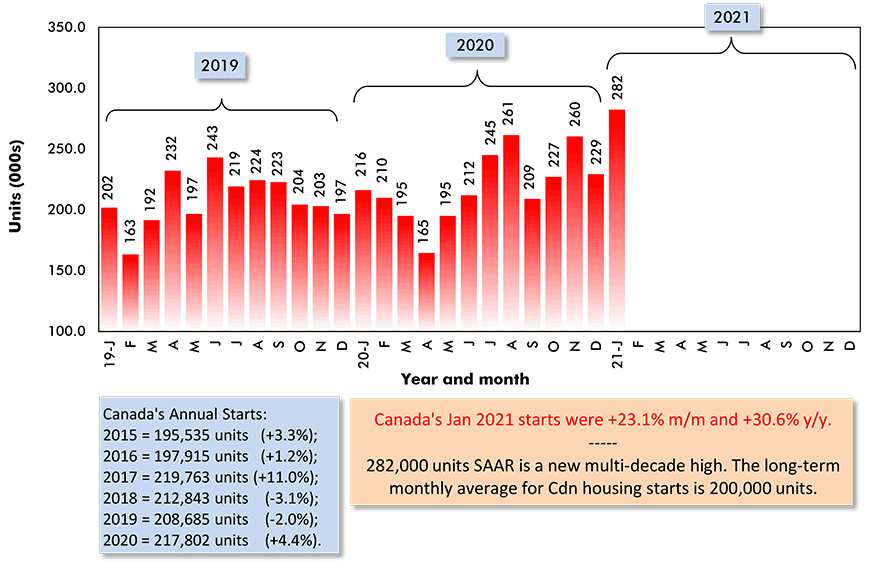
Data source: Canada Mortgage and Housing Corporation (CMHC).
Chart: ConstructConnect.
Graph 8: Percent Change in Year-To-Date Housing Starts –
Ranking Of Canada’s Provinces
(January 2021 vs January 2020)
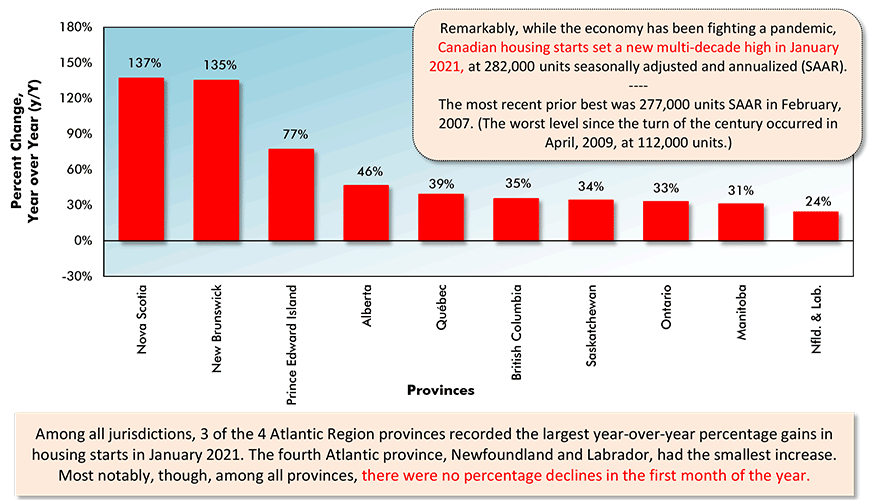
Data source: Canada Mortgage & Housing Corporation (CMHC) based on actuals rather than seasonally adjusted data.
Chart: ConstructConnect.
Graph 9: Percent Change in Year-To-Date Housing Starts –
Ranking Of Canada’s Major Cities
(January 2021 vs January 2020)
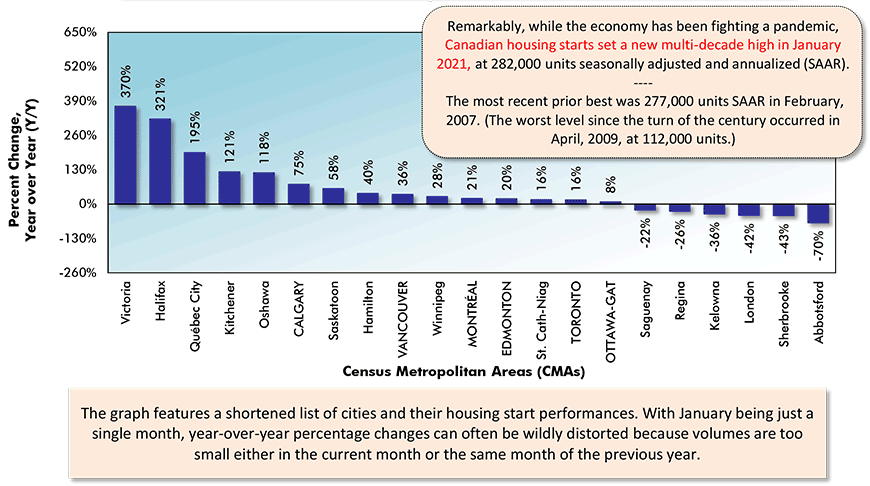
Canada’s Census Metropolitan Areas (CMAs) have core populations of 50,000 plus.
Canada’s 6 CMAs with populations in excess of 1 million are in capital letters.
Data source: Canada Mortgage & Housing Corporation (CMHC) based on actuals rather than seasonally adjusted data.
Chart: ConstructConnect.
Graph 10: U.S. and Canada Monthly Housing Starts
Seasonally Adjusted at Annual Rates (SAAR)
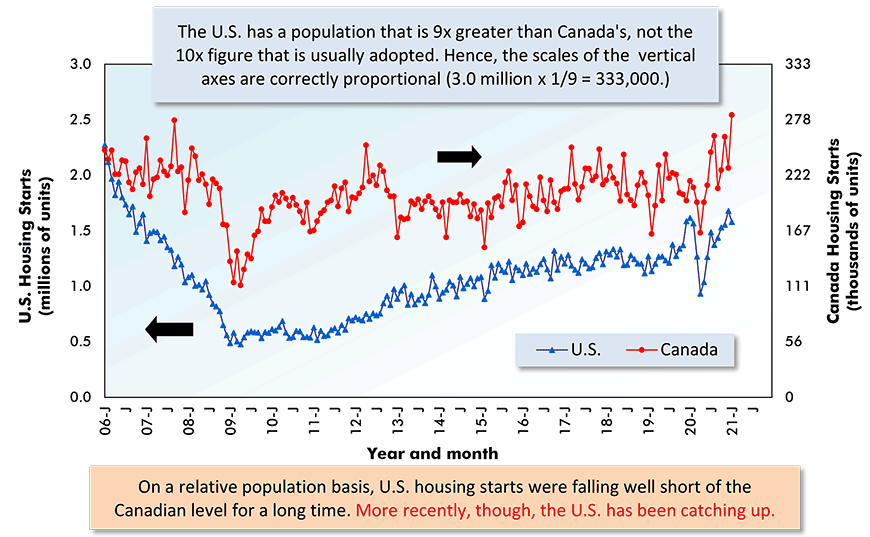
The last data points are for January 2021.
ARROWS: U.S. numbers to be read from left axis; Canadian from right axis.
Data sources: U.S. Census Bureau & Canada Mortgage and Housing Corp (CMHC).
Chart: ConstructConnect.
Please click on the following link to download the PDF version of this article:
Economy at a Glance Vol. 17, Issue 34, 35 and 36 – U.S. & Canadian Economies Lifted by Fervent Swirl of Housing Starts – PDF
Alex Carrick is Chief Economist for ConstructConnect. He has delivered presentations throughout North America on the U.S., Canadian and world construction outlooks. Mr. Carrick has been with the company since 1985. Links to his numerous articles are featured on Twitter @ConstructConnx, which has 50,000 followers.


Recent Comments
comments for this post are closed