Input Cost Increases Migrate Beyond Lumber
At the same time as the depth of the nonresidential construction marketplace in the U.S. has become shallower – i.e., there are fewer projects out for bidding due to cutbacks in capital spending plans forced by the coronavirus contagion, – material input costs have been escalating.

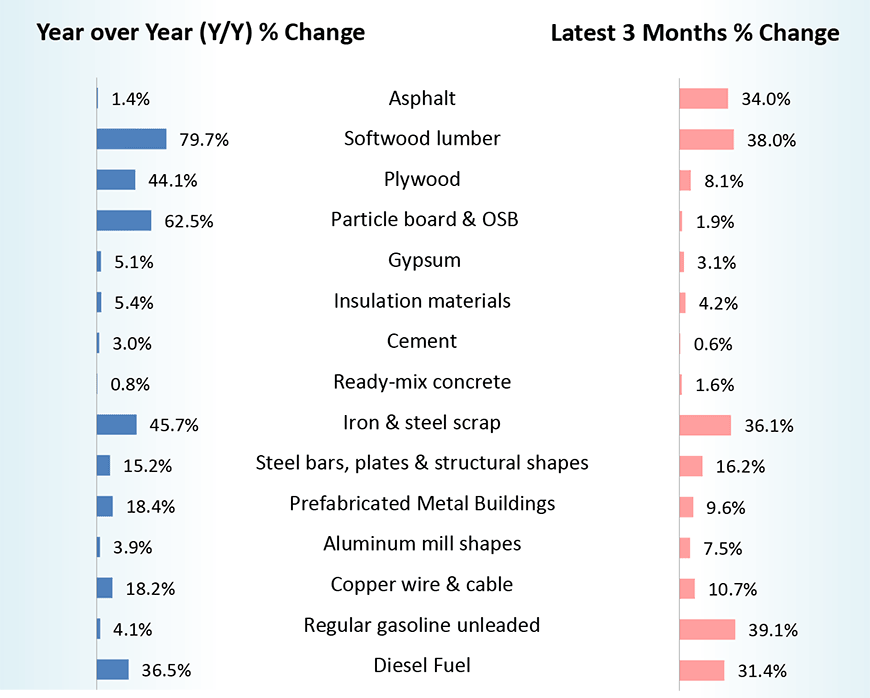
Table 1 shows the extent of the cost shock. The table pulls its information from the monthly Producer Price Index (PPI) series published by the Bureau of Labor Statistics (BLS).
Bolstered by renovation projects undertaken by stay-at-home workers and by strength in one of the few corners of the construction marketplace that has remained bullish, single-family housing activity, lumber and related product prices have been soaring.
In February, the softwood lumber PPI was +79.7% year over year and +38.0% during the latest three months; plywood, +44.1% y/y and +8.1% over latest three months; and particle board and oriented strand board, +62.5% y/y, although only +1.9% in the past three months.
While forestry products started the wave, sizable price advances have recently migrated to many other material categories as well.
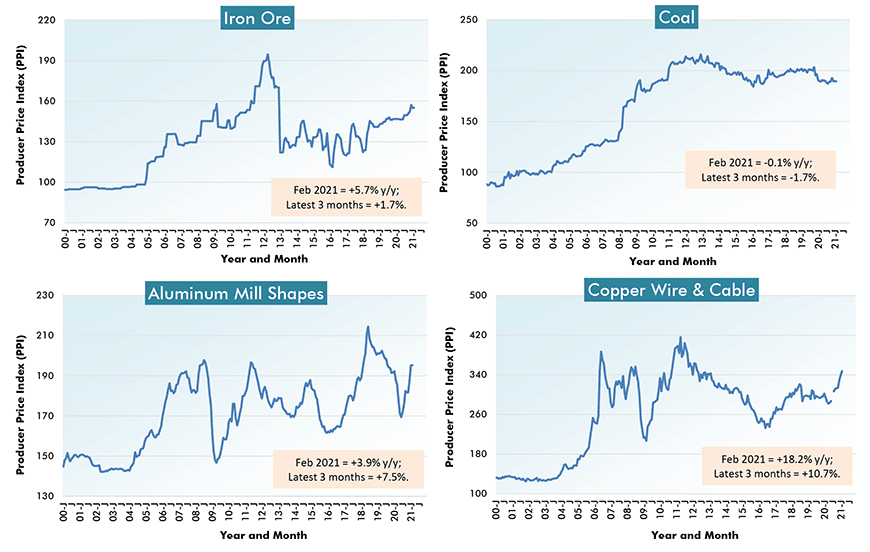
From Table 1, steel bar, plate and structural shape prices are +15.2% y/y after climbing +16.2% in the latest three months. They’ve been driven higher by iron and steel scrap prices, +45.7% y/y and +36.1% over the latest three months.
Copper wire and cable prices are +18.2% y/y and +10.7% in the latest three months.
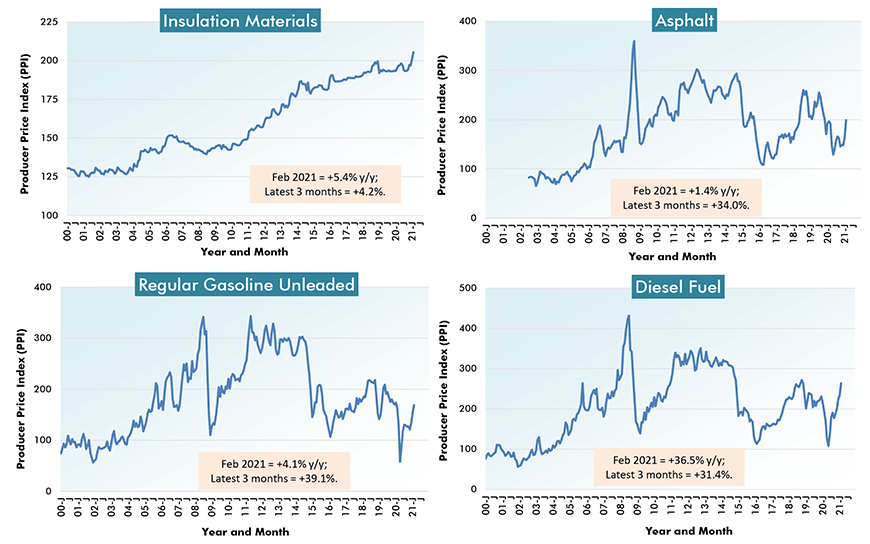
Diesel fuel is +36.5% y/y and +31.4% versus three months earlier.
Adding to the upward trajectory of material costs, as recorded in the latest three months, are aluminum mill shapes, +7.5%; asphalt, +34.0%; and regular unleaded gasoline, +39.1%.
The price increases for fossil fuel-derived products results from the climb in the world price of oil, back to around $60 USD per barrel. (There was a brief moment in 2020 when crude slipped below zero dollars per barrel.)
From Producer Price Index (PPI) Series
– February 2021
Charts: ConstructConnect.
Five Charts Covering 20 Construction Material Inputs
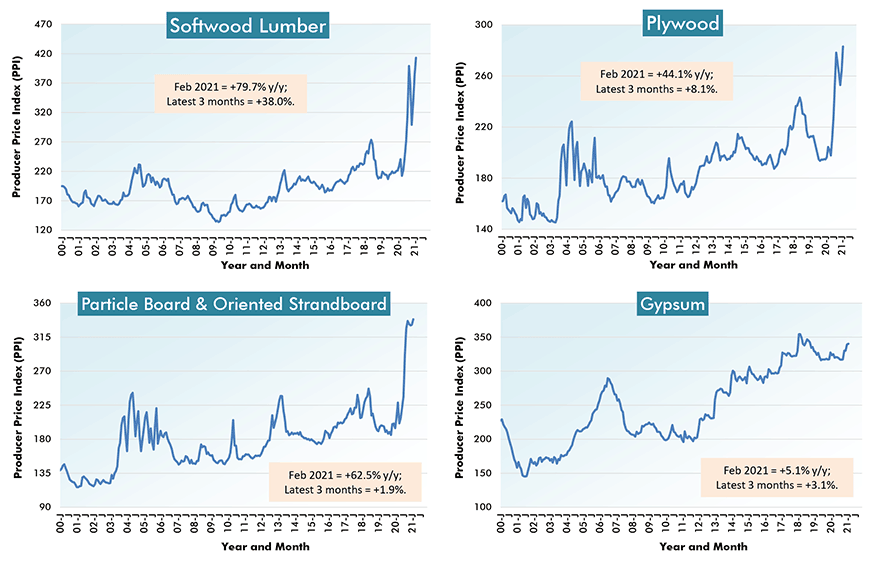
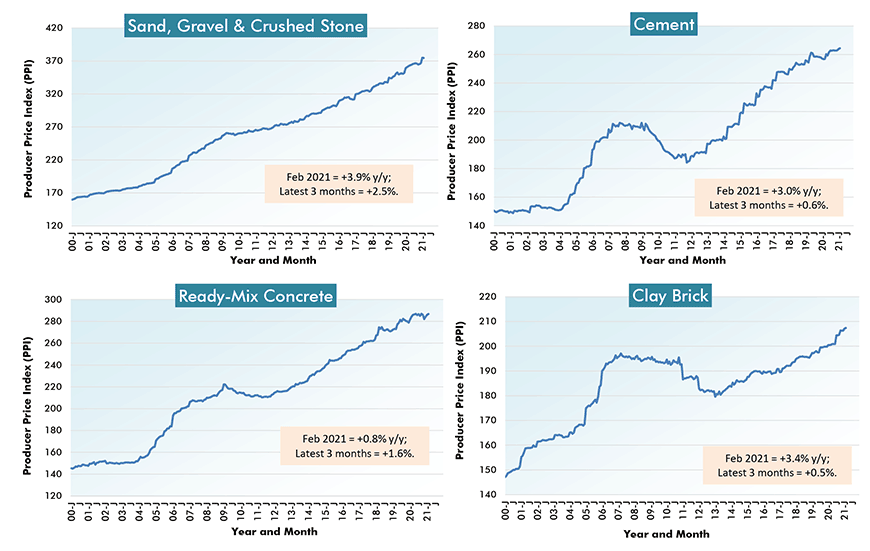
The next five charts (each with a cluster of four graphs) show the monthly histories of key PPI material price indices since January 2000.
Chart 1 mainly focuses on lumber products, with gypsum (as an interior wall covering) included as well.
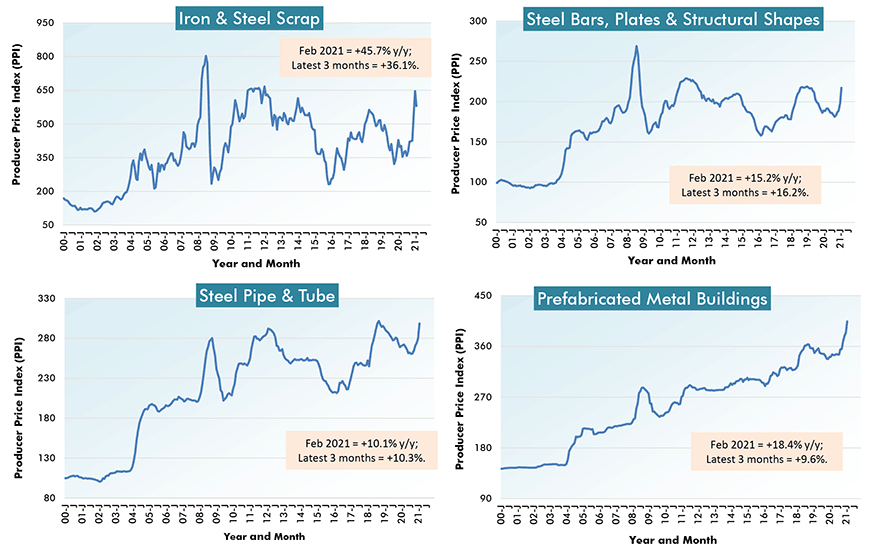
Chart 2 deals with steel, plus prefabricated metal buildings which weren’t mentioned in section one, but which have notched noteworthy price increases of late (+18.4% y/y and +9.6% in the latest three months).
Chart 3 keys on cement and concrete. You’ll notice the price increases for these products move in a steadier, less volatile, fashion than for most of the other series.
Chart 4 looks at base materials: iron ore, coal, aluminum and copper. Coal is the only commodity covered in this story with a year-over-year decline (albeit miniscule) in price, -0.1%.
Chart 5 is about fossil fuel derivatives that are either incorporated into construction projects or are consumed in the building of structures.
Charts: ConstructConnect.
Charts: ConstructConnect.
Charts: ConstructConnect.
Charts: ConstructConnect.
Charts: ConstructConnect.
Nevertheless, Bid Price Index Stays Muted
Table 1 at the beginning of this article is a condensed version of Table 2 below. Table 2 sets out the cost changes for a much longer list of construction material inputs (i.e., 35 such products and a service or two), over five different time frames.
There’s a PPI ‘final demand’ index in the top line of Table 2. It reflects what owners see when they review bid prices. The ‘final demand construction’ index includes more than just material costs, adding labor, all other expenses and margins (profits) to the mix as well.
The final demand index is just +1.0% year over year. That’s in stark contrast to the ‘inputs to new construction’ indices at the bottom of Table 2, which fluctuate around +10.0% y/y. For the moment, at least, it would appear contractors are prepared to absorb higher costs in order to win contracts.
% Change in the February 2021 Index from:
| 3 Years | 1 Year | 6 months | 3 months | 1 month | |||||
| Ago | Ago | Ago | Ago | Ago | |||||
| Final Demand/Service/Commodity/Energy/Input: | |||||||||
| Final Demand Construction | 10.1% | 1.0% | 0.4% | 0.5% | 0.3% | ||||
| New warehouse building construction | 7.7% | -0.6% | 0.2% | -0.1% | -0.2% | ||||
| New school building construction | 11.0% | 0.9% | -0.2% | 0.2% | 0.3% | ||||
| New office building construction | 10.9% | 1.7% | 1.3% | 1.0% | 0.5% | ||||
| New industrial building construction | 12.2% | 1.8% | 0.1% | 0.6% | 0.1% | ||||
| New health care building construction | 8.7% | 0.3% | -0.5% | 0.2% | 0.3% | ||||
| Architectural & engineering services | 5.0% | 1.4% | 2.5% | 2.3% | 0.7% | ||||
| Construction machinery & equipment | 9.8% | 1.3% | 1.3% | 1.2% | 0.1% | ||||
| Asphalt | 13.6% | 1.4% | 20.2% | 34.0% | 22.4% | ||||
| Plastic construction products | 10.7% | 8.0% | 6.5% | 2.1% | 1.1% | ||||
| Softwood lumber | 65.6% | 79.7% | 30.3% | 38.0% | 7.9% | ||||
| Hardwood lumber | 3.2% | 16.9% | 16.2% | 8.4% | 2.5% | ||||
| Millwork | 16.0% | 11.0% | 6.8% | 3.7% | 0.3% | ||||
| Plywood | 24.2% | 44.1% | 11.3% | 8.1% | 7.2% | ||||
| Particle board & oriented strandboard (OSB) | 55.4% | 62.5% | 15.5% | 1.9% | 2.2% | ||||
| Gypsum | -4.0% | 5.1% | 7.3% | 3.1% | 0.3% | ||||
| Insulation materials | 6.8% | 5.4% | 6.3% | 4.2% | 2.2% | ||||
| Construction sand, gravel & crushed stone | 13.1% | 3.9% | 2.2% | 2.5% | -0.1% | ||||
| Cement | 6.0% | 3.0% | 0.6% | 0.6% | 0.2% | ||||
| Ready-mix concrete | 7.1% | 0.8% | 0.6% | 1.6% | 0.3% | ||||
| Precast concrete products | 13.8% | 4.1% | 3.5% | 2.4% | 1.0% | ||||
| Prestressed concrete products | 6.5% | 0.0% | 0.7% | 0.7% | -0.1% | ||||
| Brick (clay) | 6.3% | 3.4% | 1.5% | 0.5% | 0.1% | ||||
| Coal | -4.6% | -0.1% | 1.2% | -1.7% | -0.2% | ||||
| Iron ore | 25.3% | 5.7% | 3.6% | 1.7% | 0.0% | ||||
| Iron & steel scrap | 13.1% | 45.7% | 54.4% | 36.1% | -10.3% | ||||
| Steel bars, plates & structural shapes | 16.0% | 15.2% | 18.2% | 16.2% | 9.9% | ||||
| Steel pipe & tube | 21.9% | 10.1% | 14.6% | 10.3% | 6.8% | ||||
| Fabricated structural metal products | 13.2% | 6.2% | 6.0% | 5.9% | 3.3% | ||||
| Prefabricated Metal Buildings | 23.9% | 18.4% | 17.1% | 9.6% | 5.4% | ||||
| Aluminum mill shapes | 0.8% | 3.9% | 11.1% | 7.5% | 0.1% | ||||
| Flat glass | 4.9% | 1.9% | 2.1% | 1.9% | -0.1% | ||||
| Paints, architectural coatings | 13.7% | 2.4% | 0.0% | 0.0% | -0.1% | ||||
| Lighting fixtures | 9.6% | 1.3% | 0.9% | 0.3% | 0.2% | ||||
| Plumbing fixtures & fittings | 7.9% | 1.3% | 1.5% | 0.3% | 0.4% | ||||
| Elevators & escalators | 8.5% | 1.5% | 1.6% | 1.3% | 1.5% | ||||
| Heating equipment | 11.9% | 2.5% | 1.7% | 1.9% | 1.7% | ||||
| Air conditioning equipment | 11.7% | 4.6% | 2.8% | 2.0% | 1.1% | ||||
| Copper wire & cable | 14.4% | 18.2% | 13.4% | 10.7% | 2.2% | ||||
| Regular gasoline unleaded | -9.2% | 4.1% | 30.7% | 39.1% | 9.2% | ||||
| Diesel Fuel | 16.5% | 36.5% | 38.2% | 31.4% | 12.7% | ||||
| Inputs to new construction | 14.1% | 10.0% | 7.3% | 5.5% | 2.5% | ||||
| Inputs to new residential construction | 14.8% | 11.2% | 7.0% | 4.9% | 3.0% | ||||
| Inputs to new non-res construction | 13.3% | 8.6% | 7.5% | 6.2% | 1.9% | ||||
| Inputs to commercial construction | 12.9% | 7.9% | 7.2% | 5.8% | 1.6% | ||||
| Inputs to healthcare structures | 13.4% | 8.7% | 7.0% | 5.6% | 1.6% | ||||
| Inputs to industrial structures | 13.5% | 7.4% | 7.0% | 5.5% | 1.5% | ||||
| Inputs to highways & streets | 10.8% | 6.0% | 6.8% | 6.2% | 1.7% | ||||
| Inputs to power & communication structures | 11.5% | 8.0% | 7.6% | 6.4% | 2.0% | ||||
| Inputs to educational & vocational structures | 14.4% | 9.5% | 7.2% | 5.6% | 1.7% | ||||
| Construction materials (PPI ‘Special Index’) | 15.3% | 12.4% | 9.4% | 7.9% | 3.5% |
The ‘service’, ‘commodity’ and ‘energy’ indices (in the middle section of the table) are based on ‘factory-gate’ sales prices.
The ‘input’ indices (at bottom) reflect costs faced by contractors. They exclude capital investment (i.e., machinery & equipment), labor & imports.
The ‘input’ indices are built up from the ‘service’ (design, legal, transport & warehousing, etc.) ‘commodity’ and ‘energy’ indices.
Table: ConstructConnect.
Please click on the following link to download the PDF version of this article:
Economy at a Glance Vol. 17, Issues 48 and 49 – U.S. Construction Material Cost Shock Escalates – PDF
Alex Carrick is Chief Economist for ConstructConnect. He has delivered presentations throughout North America on the U.S., Canadian and world construction outlooks. Mr. Carrick has been with the company since 1985. Links to his numerous articles are featured on Twitter @ConstructConnx, which has 50,000 followers.


Recent Comments