
North America’s major stock market indices generally ended May in fine fashion, but there were some changes in month-to-month performances that perhaps hold important significance for future construction activity.

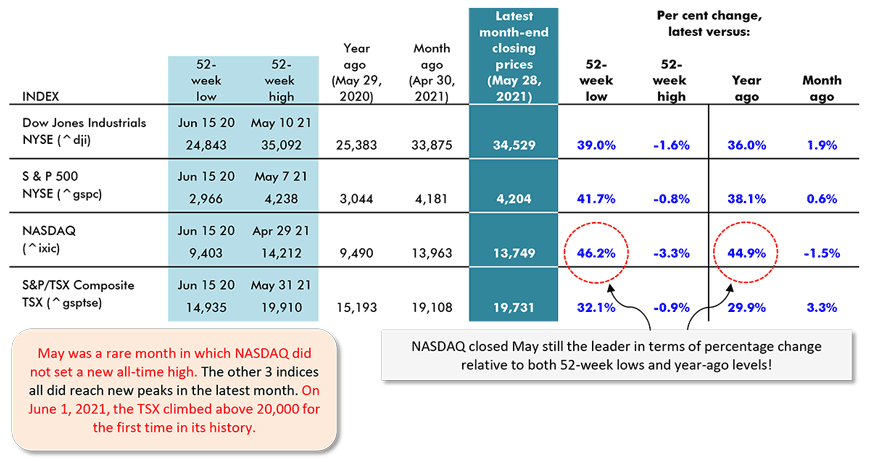
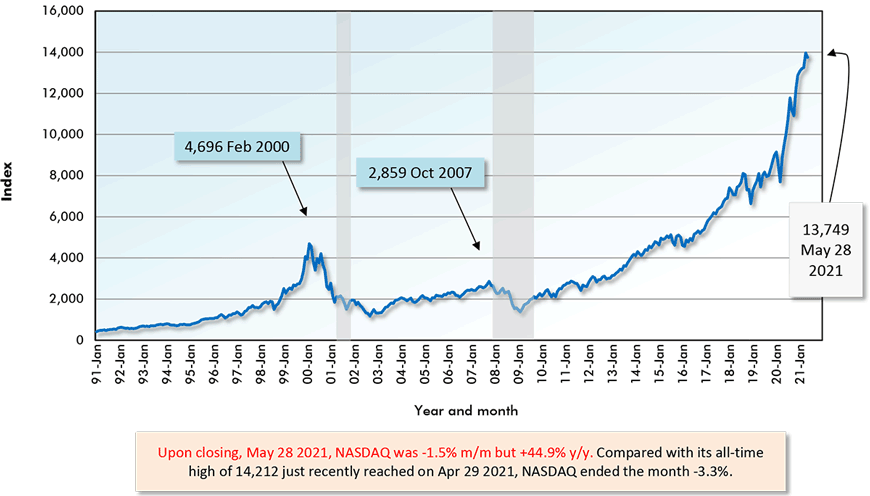
May was one of those rare months when the NASDAQ index did not rush onward to establish a new all-time high. In fact, NASDAQ in the latest period was -1.5% m/m.
Nor did the Russell 2000 small-cap index make much noise. It was only +0.1% m/m.
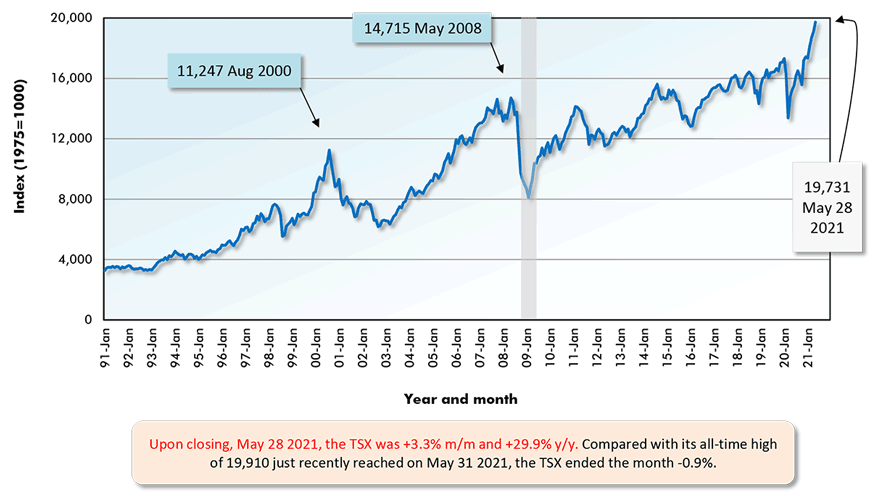
Instead, the leader among the indices on a month-to-month basis was the Toronto Stock Exchange, +3.3%. This is quite a departure for the TSX. It hasn’t been out front much for more than a decade.
Since 2009, NASDAQ has been driven upwards in meteoric fashion by growth in the high-tech sector. High-tech jobs are primarily office jobs. Therefore, prior to the pandemic and prior to ‘work from home’ directives, the success of NASDAQ led directly to surges in office building construction in major cities throughout the U.S. and Canada.
Next Leading Waves of Growth
It may finally be the case, however, that investors are anticipating the next leading waves of growth will be switching back to more tradition sources.
Over the years ahead, cyclical manufacturing will be receiving boosts from deglobalization, a more stringent ‘Buy America’ policy, observance of USMCA rules on sourcing and even a trillion-dollar or more infrastructure spending plan, provided it achieves passage.
Infrastructure projects gobble up vast arrays of building materials, including steel, cement and lumber for formwork.
Furthermore, the Biden Administration’s clear support for electrification signals a demand for copper (e.g., in distribution lines) and nickel (e.g., in electric batteries) that will kick off an old-fashioned revival in raw materials extraction.
Plus, other metals and minerals such as lithium and cobalt are finding their moments in the sun.
New mega-sized resource projects, entailing massive construction undertakings, have been nearly absent from the scene since back in the 00s.
The Toronto Stock Exchange is known for its heavy weighting in resource sector firms. It’s no coincidence that the pickup in the TSX is corresponding with the improving outlook for commodities.
As a final note on this subject, the price of oil, both for West Texas Intermediate (WTI) and Brent crude, has recently zoomed (although briefly) past $70 USD per barrel after languishing for years.
Securities Dealers Automated Quotations (NASDAQ), Toronto Stock Exchange (TSE) and Reuters.
Table: ConstructConnect.
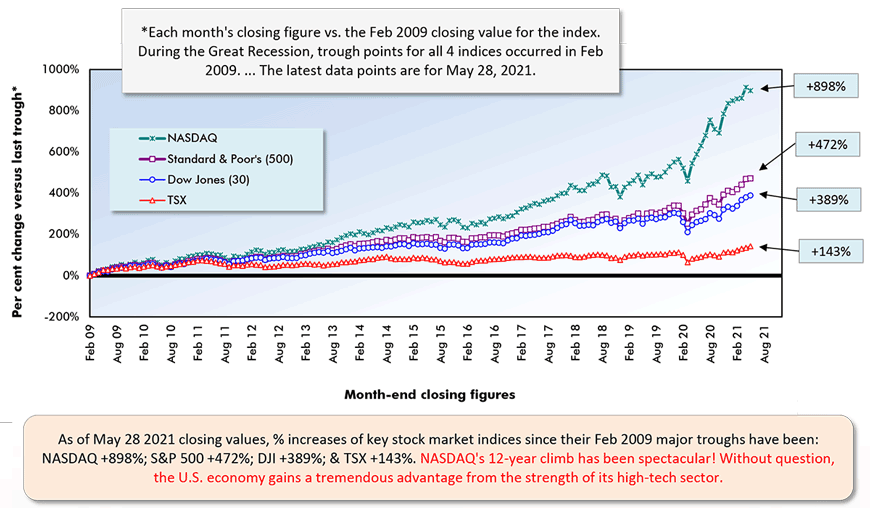
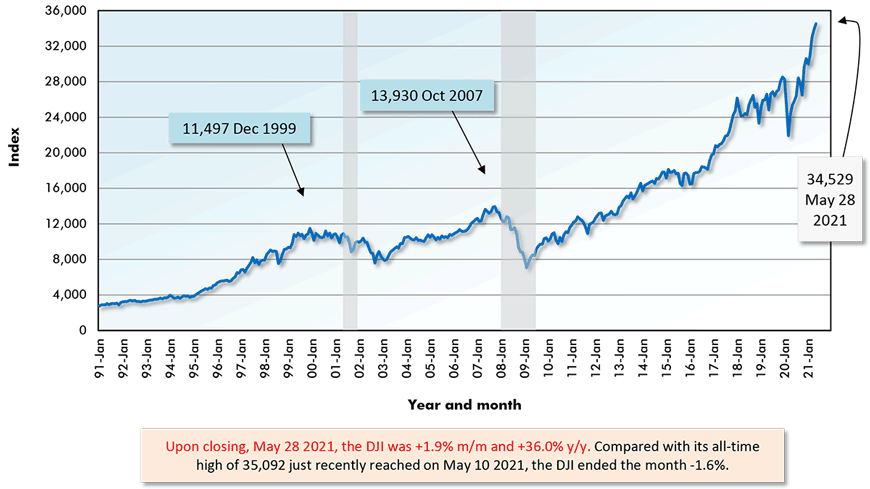
Red vertical lines denote Feb 2009 major ‘troughs’ for the indices.
Securities Dealers Automated Quotations (NASDAQ), Reuters & Yahoo.
Chart: ConstructConnect.
Other Highlights from the Tables & Graphs
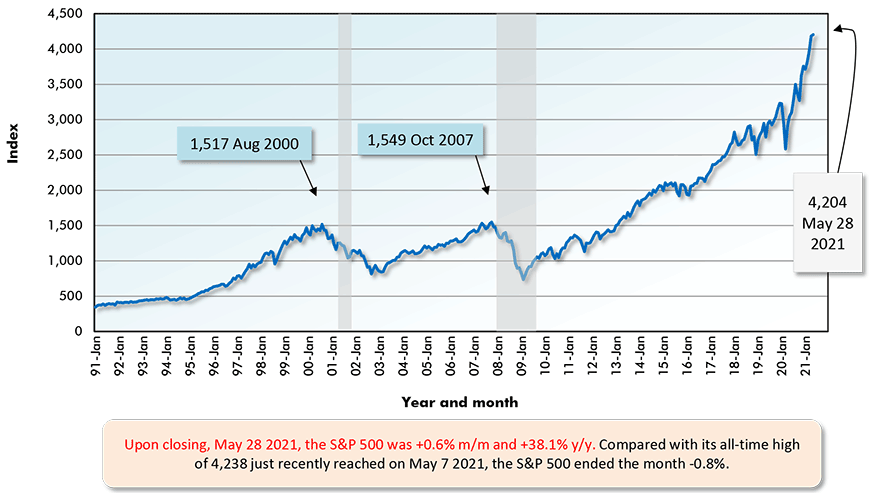
From Graph 3, February 2009 marked the last major trough points for the U.S. and Canadian stock market indices.
As of May 2021’s closing values, NASDAQ was +898%, the S&P 500, +472% and the DJI, +389% compared with their bottoms of a dozen years ago. Those are truly remarkable gains.
NASDAQ has managed a nearly tenfold increase in the past dozen years. The benefits accruing to the U.S. economy from its high-tech head office strength cannot be overstated.
The present level of the TSX compared with its value in February 2009 is only +143%. No wonder Canadians look to house prices for their asset holding increases rather than share prices.
From Table 2, the biggest year-over-year increase in index value internationally currently belongs to the Russell 2000, +62.8%. But second place goes to iShares Emerging Markets Asia, +47.3%, beating NASDAQ, +44.9%.
On a month-to-month basis on the global stage, the leader is the Shanghai Composite Index, +4.9%. Second spot belongs to the iShares Frontier 100 for Pre-emerging Markets Index, +4.2% m/m.
Securities Dealers Automated Quotations (NASDAQ), Toronto Stock Exchange (TSE) and Reuters.
Chart: ConstructConnect.
Securities Dealers Automated Quotations (NASDAQ), Toronto Stock Exchange (TSE) and Reuters.
Chart: ConstructConnect.
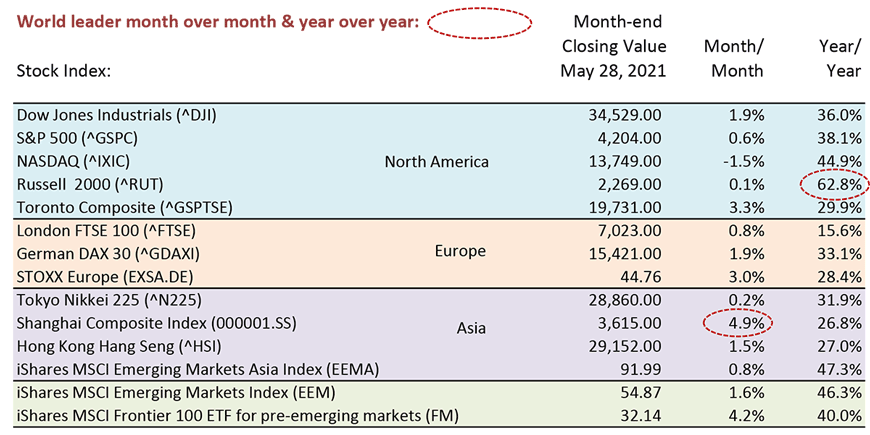
Table: ConstructConnect.
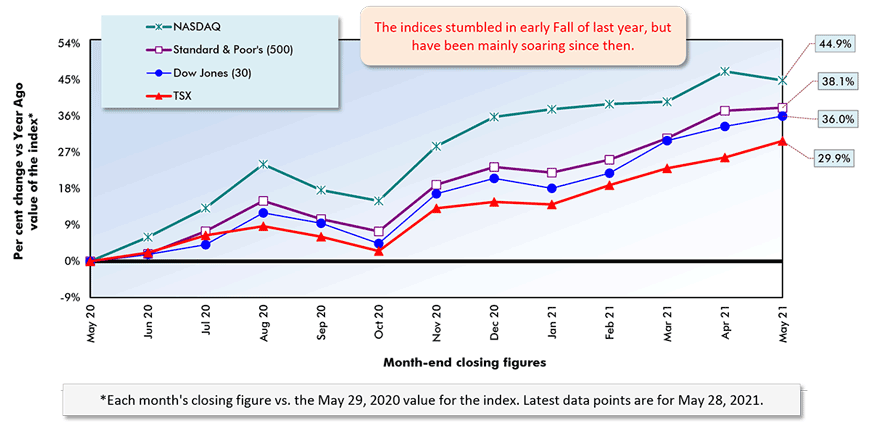
Year over Year as of Month-end Closings, May 28, 2021
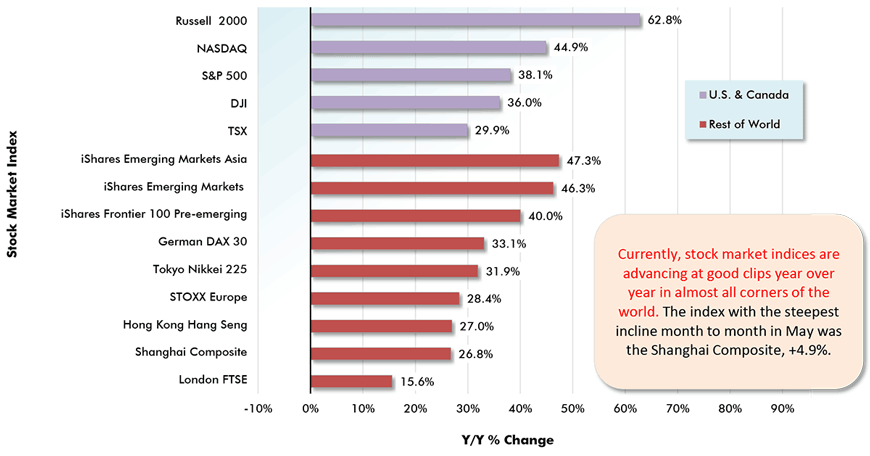
Chart: ConstructConnect.
Securities Dealers Automated Quotations (NASDAQ), Toronto Stock Exchange (TSE) and Reuters.
Chart: ConstructConnect.
Securities Dealers Automated Quotations (NASDAQ), Toronto Stock Exchange (TSE) and Reuters.
Chart: ConstructConnect.
Securities Dealers Automated Quotations (NASDAQ), Toronto Stock Exchange (TSE) and Reuters.
Chart: ConstructConnect.
Securities Dealers Automated Quotations (NASDAQ), Toronto Stock Exchange (TSE) and Reuters.
Chart: ConstructConnect.
Please click on the following link to download the PDF version of this article:
Economy at a Glance Vol. 17, Issues 41 and 42 – What’s to Like or Not Like About February’s +379,000 U.S. Jobs Count – PDF
Alex Carrick is Chief Economist for ConstructConnect. He has delivered presentations throughout North America on the U.S., Canadian and world construction outlooks. Mr. Carrick has been with the company since 1985. Links to his numerous articles are featured on Twitter @ConstructConnx, which has 50,000 followers.


Recent Comments
comments for this post are closed