
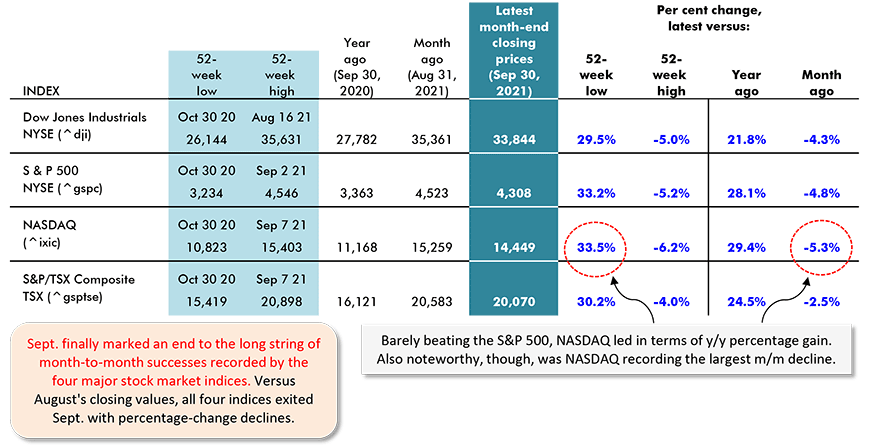
For the first time in nearly a year, the four major stock market indices featured in Table 1 fell into a rough patch in September, all declining in a range that extended from -2.5% for the TSX to -5.3% for NASDAQ.

It’s uncharacteristic for NASDAQ to have the worst performance among the four equity price monitors. Serving as one depressant, the ethical practices of some of the biggest high-tech firms are presently coming under the critical scrutiny of Congress.
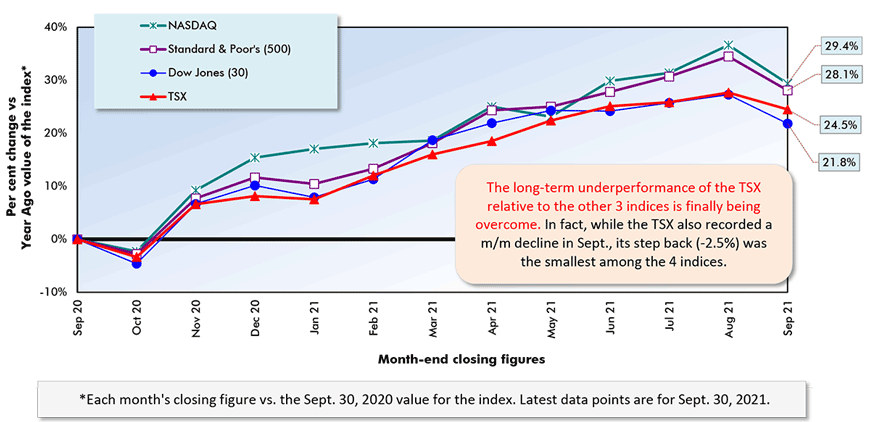
Nor has it been usual for the Toronto stock exchange to outperform its American cousins. But in the latest month, the TSX managed a smaller retreat m/m (-2.5%) than the DJI (-4.3%), S&P 500 (-4.8%) and NASDAQ (-5.3%). Furthermore, on a year-over-year basis, the TSX’s advance of +24.5% exceeded the DJI’s gain of +21.8%.
During the last several months, the prices of many major commodities have been springing to life again and that’s put a livelier step in the share prices of the big resource sector owners who make up a significant part of the TSX index.
But what is one to make of September’s retreat by all four indices? Is it just a pause allowing investors to catch their breath before going on to new heights or is it a signal that a re-assessment of economic prospects is underway?
The Pullback was a Global Event
The first thing to note is that the pullback in equities in September was a global event. Another U.S. index, the Russell 2000, which monitors share prices for firms with smaller capitalizations, was -3.1% m/m in September. (It should be mentioned that the Russell 2000 lays claim to the biggest year-over-year advance among all indices globally, +46.2% (see Table 2))
As for major non-North American indices, Table 2 sets out that only one recorded a significant month-to-month increase in September, Tokyo’s Nikkei’s 225, +4.9%. The Shanghai Composite was basically flat, +0.7%, and all others fell with the Hong Kong Hang Seng setting an outer boundary of -5.0% (which, by the way, was still less than NASDAQ’s m/m setback of -5.3%.)
Three Concerns are Impacting Share Prices
The concerns impacting share prices seem to coalesce around three issues. First, the coronavirus, and particularly its rogue variants, remain not yet fully tamed. The prospect of more economy-slowing lockdowns has not been totally removed from the table.
Second, inflation has heated up to the point where many analysts believe it will be an engrained and long-term phenomenon and not just the temporary nuisance, due mainly to supply shortages, that central bankers have been hypothesizing. Rapid general price movement carries the risk of quicker action to rein in monetary stimulus and raise interest rates.
Third, there’s the Evergrande factor. Evergrande is a huge Chinese real estate firm. It rode to success and immense size (i.e., branching out into other sectors of the economy and even buying a soccer club) during an earlier boom in homebuilding activity in China.
But now China’s population has aged, there’s a disproportionate number of single adult males and the prospects for residential real estate sales and appreciation are no longer what they once were. Evergrande is on the cusp of defaulting on large domestic and foreign loans.
The danger is that without strong intervention by Beijing, a collapse by Evergrande could cut a wide swath through China’s economy. Japan’s real estate collapse in the 1990s, followed by three decades of stagflation, is held up as the prime example of how badly matters might veer off course.
China’s remarkable record of ‘real’ (inflation-adjusted) GDP growth of +12% annually in the 00s and +6% to +7% per annum in the subsequent ten years has been a major contributor to world economic prosperity. Within its Asian economic sphere, and indeed on the world stage, there’s no substitute for China’s economy not performing well.
Securities Dealers Automated Quotations (NASDAQ), Toronto Stock Exchange (TSE) and Reuters.
Table: ConstructConnect.
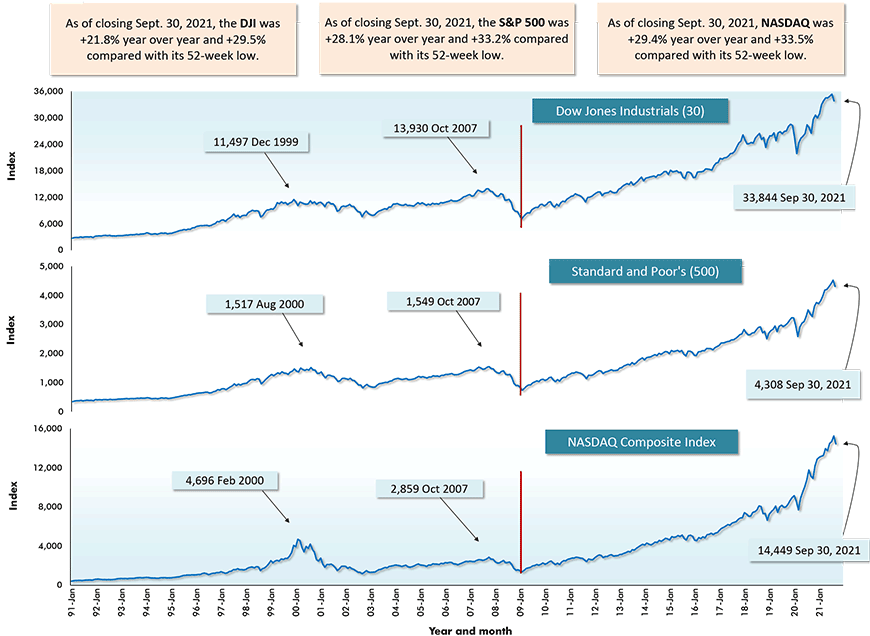
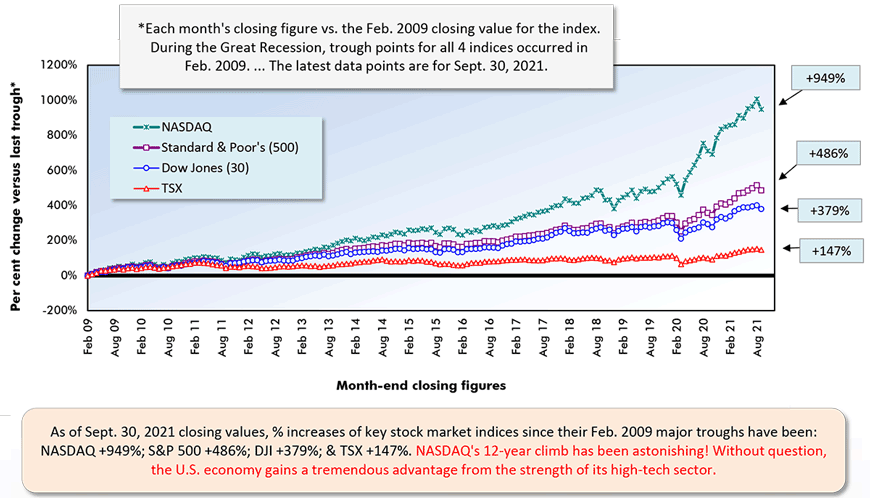
Red vertical lines denote Feb 2009 major ‘troughs’ for the indices.
Securities Dealers Automated Quotations (NASDAQ), Reuters & Yahoo.
Chart: ConstructConnect.
Securities Dealers Automated Quotations (NASDAQ), Toronto Stock Exchange (TSE) and Reuters.
Chart: ConstructConnect.
Securities Dealers Automated Quotations (NASDAQ), Toronto Stock Exchange (TSE) and Reuters.
Chart: ConstructConnect.
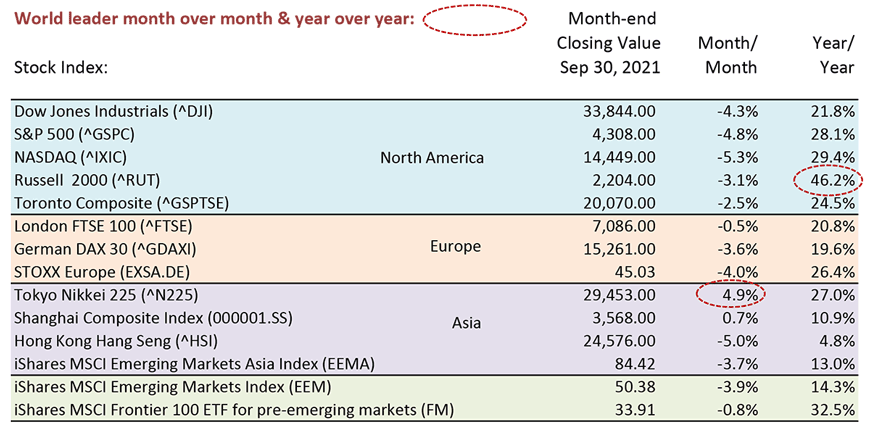
Table: ConstructConnect.
Year over Year as of Month-end Closings, September 30, 2021
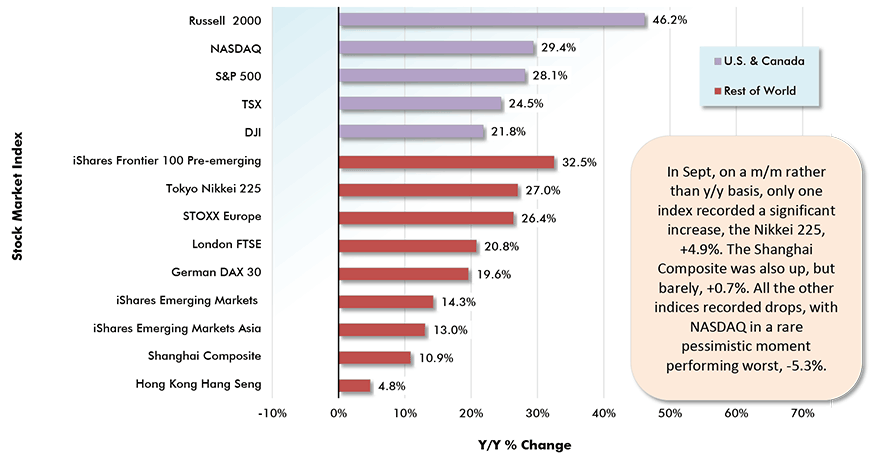
Chart: ConstructConnect.
Alex Carrick is Chief Economist for ConstructConnect. He has delivered presentations throughout North America on the U.S., Canadian and world construction outlooks. Mr. Carrick has been with the company since 1985. Links to his numerous articles are featured on Twitter @ConstructConnx, which has 50,000 followers.
Please click on the following link to download the PDF version of this article:
Economy at a Glance Vol. 17, Issue 141 – Stock Market Indices in September: Catching Their Breath or Re-assessing? – PDF


Recent Comments