
Canadian construction starts year to date, as calculated by ConstructConnect, are set out in Table 1 below. By dollar volume, the total is +5.7% versus January-to-October 2020, with residential at +22.0%; nonresidential buildings, +19.9%; and engineering, -20.2%.

But the numbers are so chipper mainly due to one extraordinary input. Canadian starts can be inordinately affected by the initiation of a mega project or two. (A mega project, in dollar terms, carries an estimated value of a billion or more.)
In October of this year (i.e., the latest month for which data is available), there was a groundbreaking on such a project in Saskatchewan, the Jansen potash mine for BHP Billiton, carrying a price tag of $7.5 billion.
With the Jansen Mine project, total Canadian starts year to date in October were +5.7%; without it, they would have been -4.8%. Total nonresidential starts year to date were about even with last year, -1.2%; without Jansen, they would have been -16.2%.
This is a perfect illustration of how important the tie-in can be between foreign trade, often facilitated by huge resource projects, and Canadian construction starts.
Graph 1 shows the advantage Canada has in the trade of potash. The blue line for exports bobs up and down at mighty levels. The red line for imports hugs the zero x-axis and is barely discernible.
Canada has experienced seven months of ‘goods’ foreign trade surplus so far in 2021, a way better showing than in most other years since the 2008-2009 recession. A prime reason for the positive turnaround has been the general uptick in commodity prices.
Perhaps most helpful, oil and natural gas have been showing more pricing strength this year. Among categories of merchandise trade exports, Canada’s biggest surplus is usually to be found in energy products. The energy products surplus through the first ten months of this year has doubled versus the same time frame of last year, moving from +$35.6 billion CAD to +$71.9 billion CAD.
Among the 19 top provincial export products featured in Graph 4, three of the four percentage change leaders are Saskatchewan energy products, +62.7%; Alberta energy products, +55.9%; and B.C. energy products, +52.2%. Only B.C. forestry products, +58.4%, ‘travels in the same circle’.
Graph 4 highlights that only one provincial export product is in sales decline ytd, -7.4% for Ontario motor vehicles and parts. The explanation lies in the shortage of computer chips that has taken some major U.S. carmakers off-line for stretches of time this year.
This leads into discussion of another mega project that was a boon to construction starts a month ago (September 2021), but in America rather than Canada. Of course, what’s being spoken of is the $20 billion expansion (and approximately $8 billion for construction alone) of Intel’s chip-making facilities in Chandler, Arizona, just southeast of Phoenix.
Table 1: Canada Construction Starts Year to Date (Through Oct 2021) – ConstructConnect
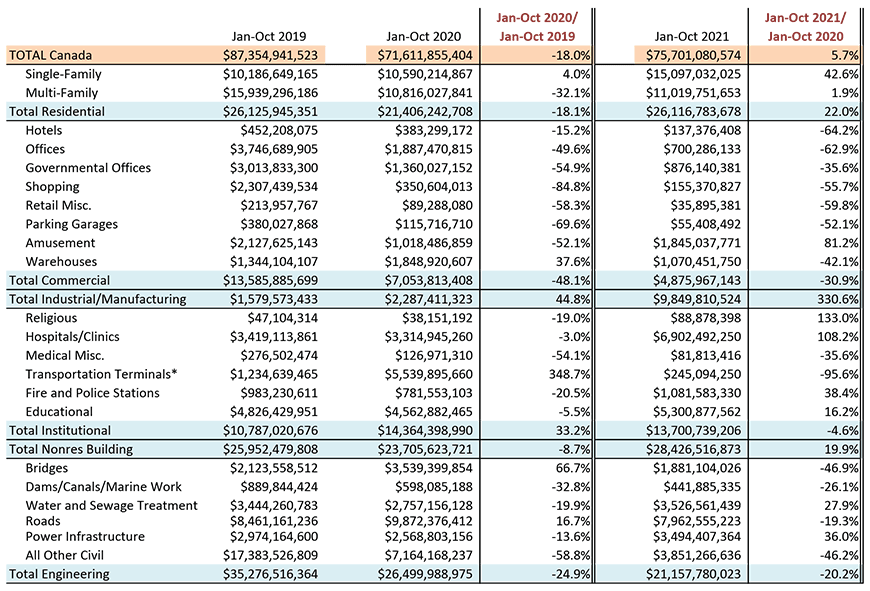
When U.S. ‘starts’ are compiled, the category ‘transportation terminals’ appears within commercial.
Groundbreaking on the $7.5 billion Jansen potash mine in Saskatchewan signifiantly lifted the industrial figure in October 2021.
Data source and table: ConstructConnect.
Graph 1: Canada’s Foreign Trade in Potash
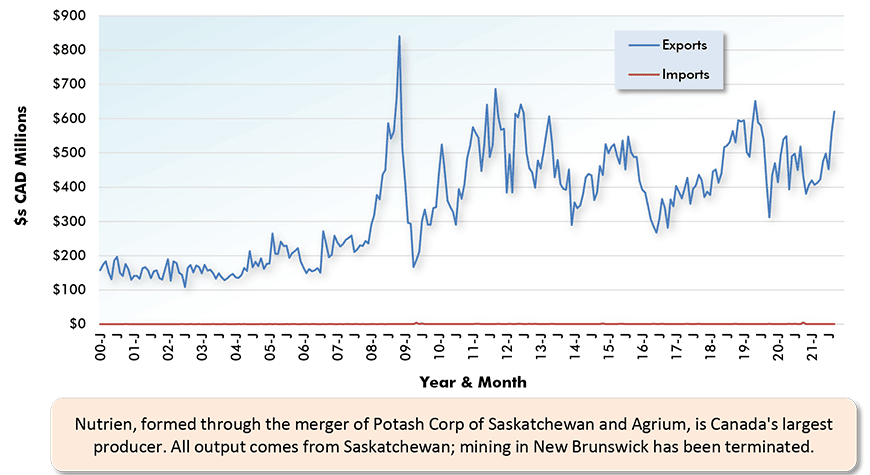
Latest data points are for September 2021.
Data source: Statistics Canada.
Chart: ConstructConnect.
Graph 2: Canada’s Foreign Trade: The Merchandise Trade Balance − September 2021
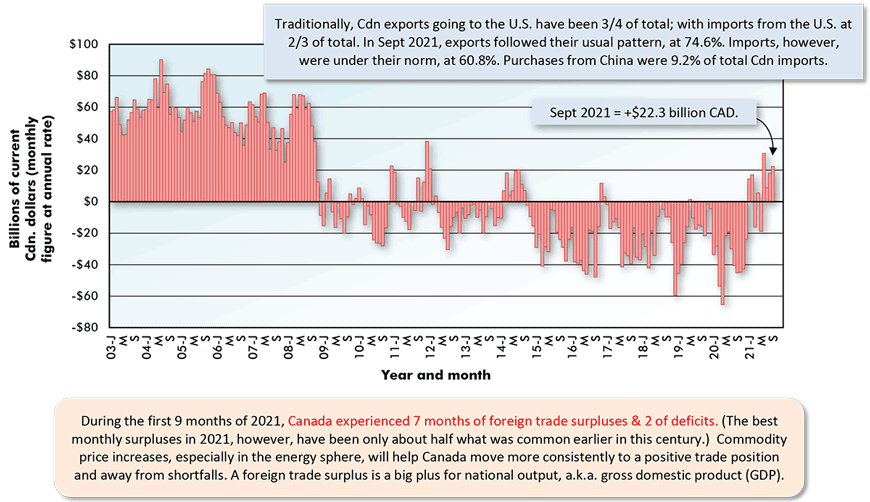
The last data point is for August 2021.
Based on seasonally adjusted monthly figures, projected at an annual rate.
Data source: Statistics Canada.
Chart: ConstructConnect.
Graph 3: Provincial Export Sales, Jan-Sept, 2021
Ranked by $ Volume
(Also Showing YTD% Changes – i.e., vs Jan-Sept, 2020)
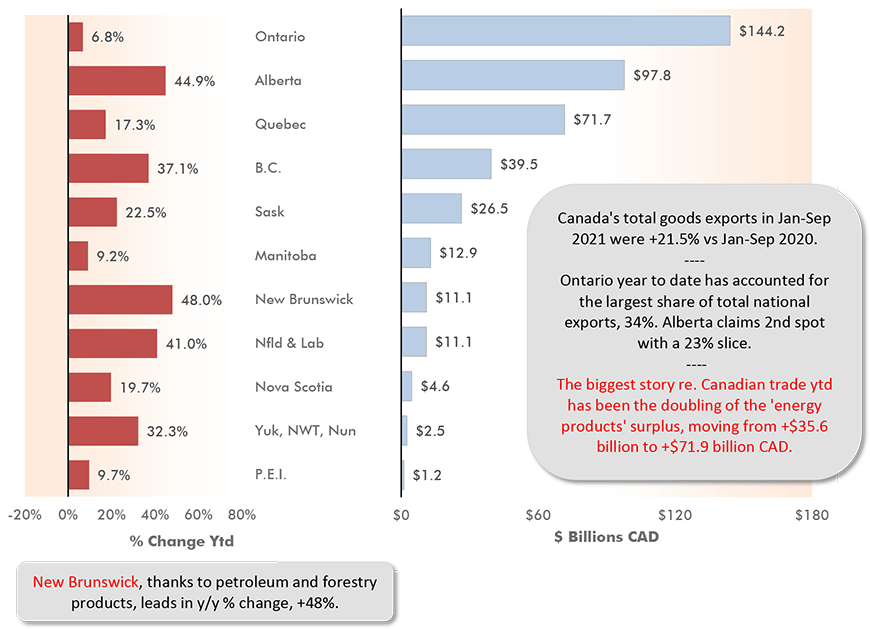
Data source: Statistics Canada.
Chart: ConstructConnect.
Graph 4: Canada’s Key Export Product Sales by Province
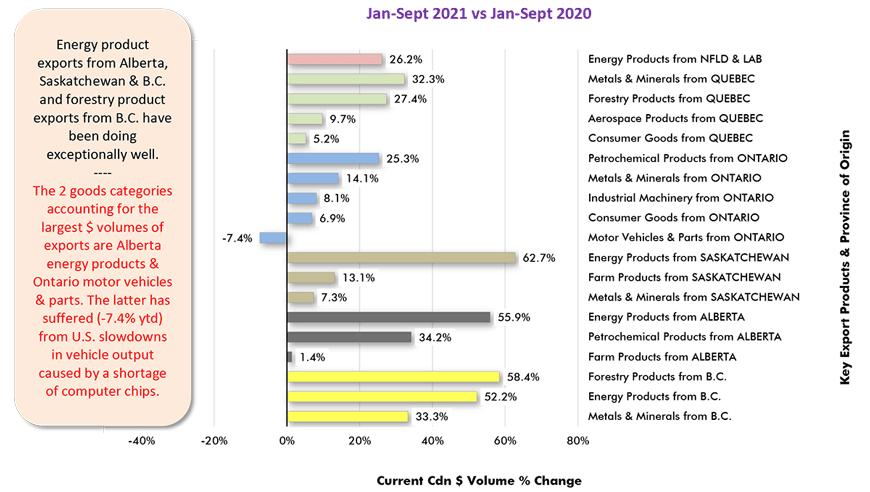
Data source: Statistics Canada Table 12-10-0119-01.
Chart: ConstructConnect.
Table 2: 12 of the Top Suppliers of U.S. Oil Imports
Year to Date (YTD) September, 2021
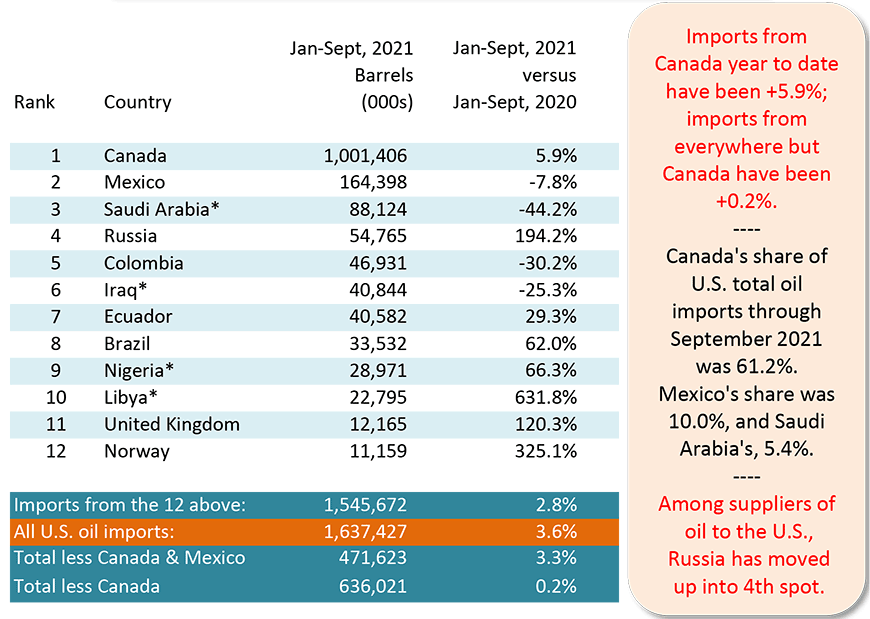
* OPEC nations.
Data source: Bureau of Economic Analysis (BEA).
Chart: ConstructConnect.
Graph 5: Foreign Sources of U.S. Imported Oil
% of Total Barrels – Jan-Sept 2021
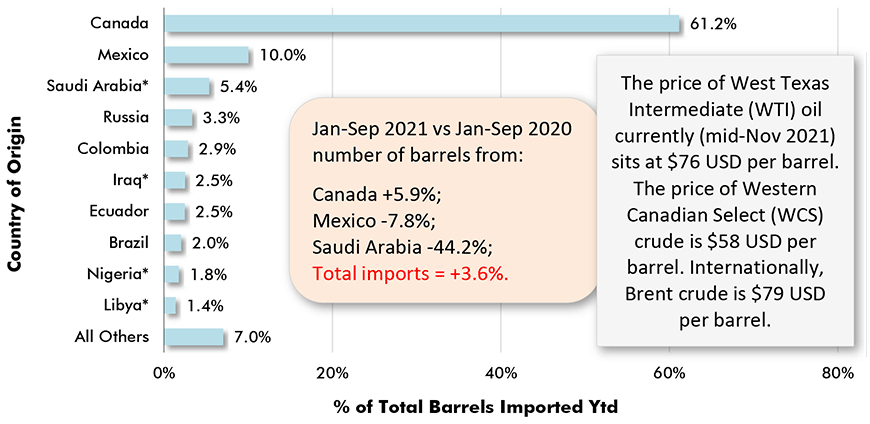
* Asterisk indicates country among OPEC members. Ecuador left OPEC in January 2020.
Data source: Census Bureau & Bureau of Economic Analysis (BEA).
Chart: ConstructConnect.
Alex Carrick is Chief Economist for ConstructConnect. He has delivered presentations throughout North America on the U.S., Canadian and world construction outlooks. Mr. Carrick has been with the company since 1985. Links to his numerous articles are featured on Twitter @ConstructConnx, which has 50,000 followers.


Recent Comments
comments for this post are closed