
U.S. Retail Sales take Exuberant Route
There are a lot of explanations for why souped-up inflation has become so troubling in recent months. Heading the list is supply shortages.

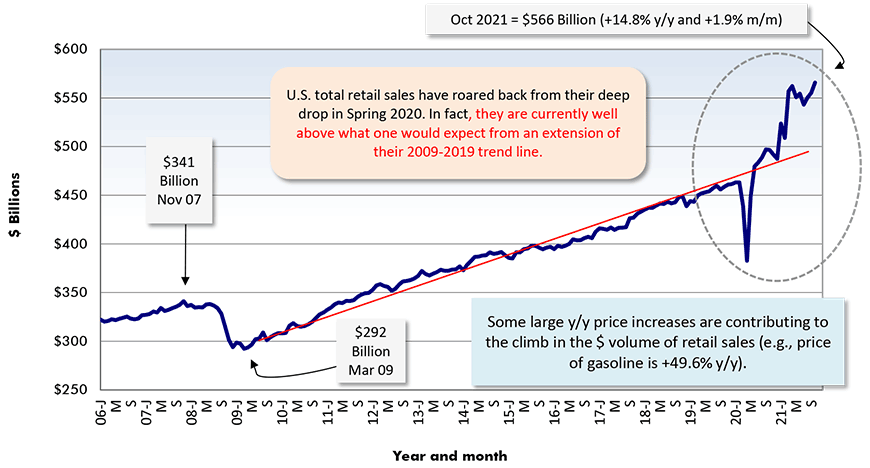
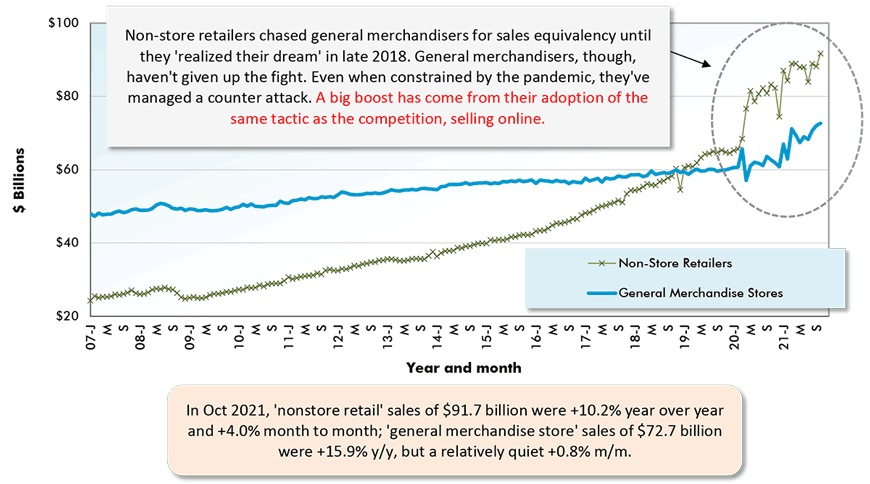
Graph 1 points out, however, that those supply shortages wouldn’t likely have reared up so glaringly if demand hadn’t veered so markedly from its normal pattern.
Instead, U.S. demand for retail goods has taken off in an unprecedented fashion. The curve for actual retail sales has soared way above a forward extension of the trend line that applied for 11 years from 2009 through 2019.
Moreover, in statistical terms, that trend line is an exceptionally good fit. From 2009 to 2019, there were no great deviations from ‘actuals’ to trend line.
The big jump in the savings rate, resulting from ‘organic’ austerity measures while sheltering at home (i.e., cutbacks in travel, entertainment, etc.), plus income support initiatives, have provided the fuel to stoke up the spending splurge.
It’s noteworthy, though, that the take-off in U.S. retail sales has not been matched in Canada.
Canadian total retail sales from Graph 8 have fully recovered from their trip to previously unplumbed depths last year, but they are now nicely in line with what might be expected from their past pattern.
Other highlights from the U.S. retail sales numbers include the following.
Some of the biggest gains in shopkeeper receipts (Graph 2) have come about because the prices for the products they sell have galloped ahead as well. For example, gas station sales are +46.8% year over year, but that flows directly from the price of petrol being +49.6% y/y.
Sales by ‘furniture and home furnishing’ stores are +11.9% y/y. It’s not just a coincidence that the ‘furniture’ sub-index in the Consumer Price Index is +12.0% y/y.
Among all the shopkeeper categories appearing in Graph 2, ‘health and personal care’ stores are recording the weakest year-over-year sales growth, +7.4%. CVS has recently announced it will be closing hundreds of its outlets. One reason given is that the company currently has too many locations, and in some of them, mainly in downtown cores, there’s been a creeping shift towards dowdiness. CVS management feels a modernization drive has become necessary.
Also, striking a negative chord, a court ruling has found the big drugstore chains (CVS, Walgreens, Walmart) culpable in contributing to the opioid epidemic.
Also, concerning U.S. retail trade, and as if surviving the pandemic wasn’t challenging enough, ‘brick and mortar’ retailers in some cities (e.g., Louis Vuitton in Chicago and Nordstrom in San Francisco) have come under robbery assault by flash mobs.
And finally, from Graph 4, the mini boom in U.S. housing starts and the strong pick-up in home renovation projects lifted the sales of building material suppliers by a third year over year in the Spring of this year. A doubling in the price of lumber caught everyone’s attention.
But then sawmills were re-opened and home starts leveled off and the price of lumber eased back down again. But that may not be the end of the story. Only a little over two-thirds of the softwood product going into U.S. homes comes from domestic sources and the duties imposed on lumber being imported from Canada have just been adjusted upwards some more.
Adjusted for seasonality and trading day differences, but not for price changes (i.e., figures are in ‘current’ dollars).
Chart: ConstructConnect.
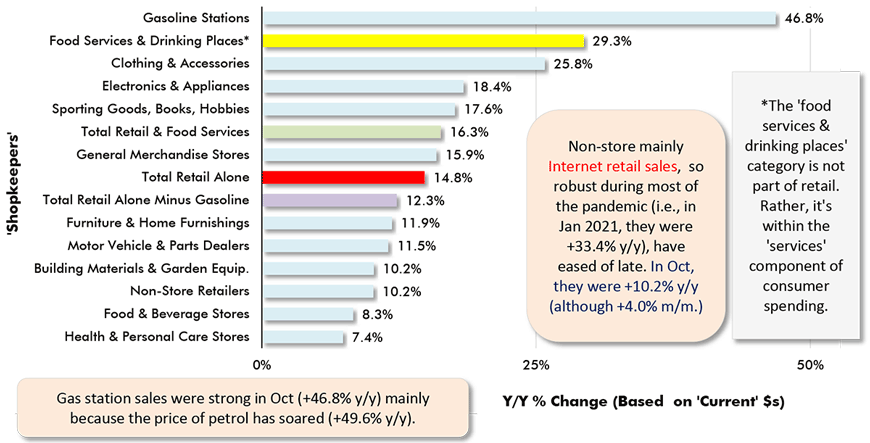
Chart: ConstructConnect.
Chart: ConstructConnect.
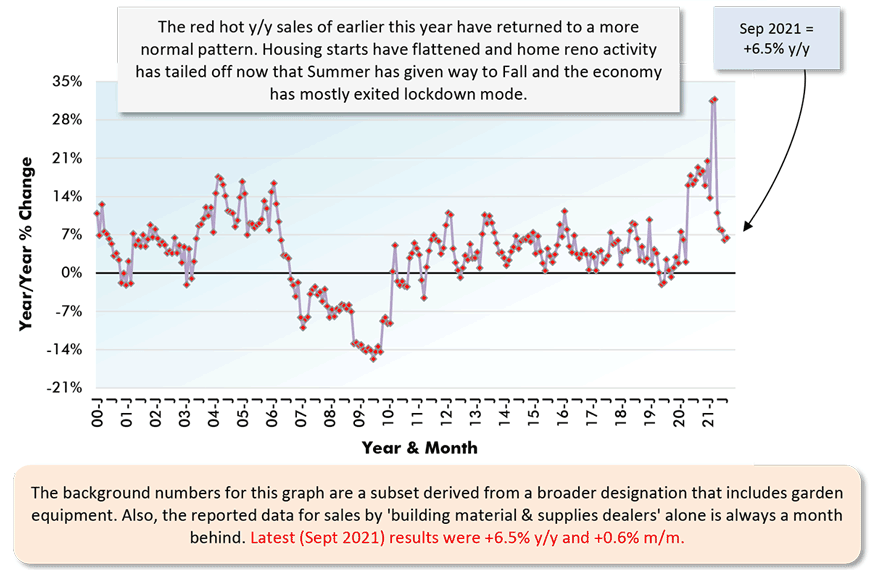
Chart: ConstructConnect.
(i.e., Internet Platforms & E-Auction Houses)
Adjusted for seasonal variation, holiday and trading day differences, but not for price changes.
Chart: ConstructConnect.
Adjusted for seasonal variation, holiday and trading day differences, but not for price changes.
Chart: ConstructConnect.
Canadian Retail Sales follow Steadier Path
Graph 7 takes monthly dollar volumes of total retail sales in the U.S. and Canada and turns them into indexed series.
For each country, the July 2009 dollar volume of total retail sales is adopted as the base and set equal to 100.0. (July 2009 was the first recovery month after the last recession.) The index value for each subsequent month is then its dollar volume divided by July 2009’s dollar volume, times 100.
Adopting the same base period and setting its level equal to 100.0 means the two series can be shown on the same graph with the same starting points. Relative performances after July 2009 become easy to visualize.
From Graph 7, Canadian total retail sales kept up fine with their U.S. counterpart from July 2009 through early 2020. But then disaster, in the form of COVID-19, struck. U.S. total retail sales plunged to a position about halfway between their ten-year pickup from 2009 to 2019.
Canadian retail sales did much worse. They fell all the way back to where they’d been a decade earlier. The Canadian versus American descent was twice as severe.
Total retail sales in both countries managed quick rebounds. Nevertheless, it’s readily apparent that a significant and widening gap has developed between soaring U.S. results and the more measured progress being displayed in Canada.
It’s not clear, though, that Canada has something to worry about. From Graph 8, total Canadian retail sales are now moving along an upward sloping trajectory that roughly corresponds with what might be expected from observing 2009 to 2019’s gradual steady climb, before the pandemic blew up economic orthodoxy.
Some other points of interest from the Canadian retail sales numbers include the following.
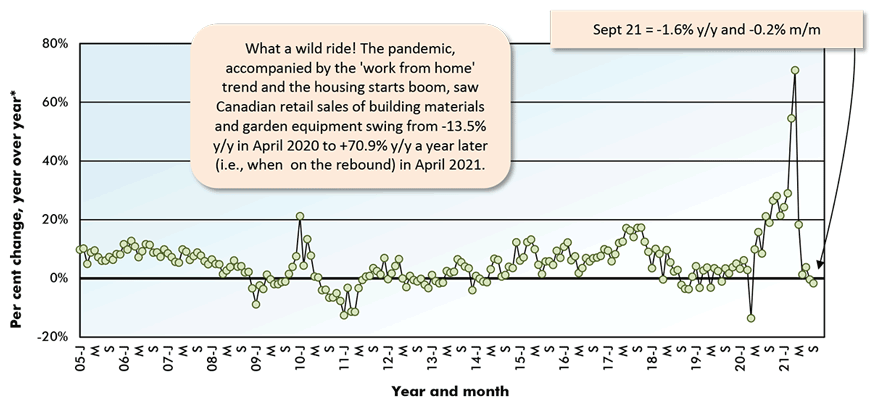
‘Building material and garden equipment’ sales in Canada, after being ahead by as much as +71% year over year in April 2021, have now turned negative, -1.6%. This reflects the several months’ slide in housing start in Canada since they attained an all-time peak of 333,000 units, seasonally adjusted and annualized (SAAR), in March of this year.
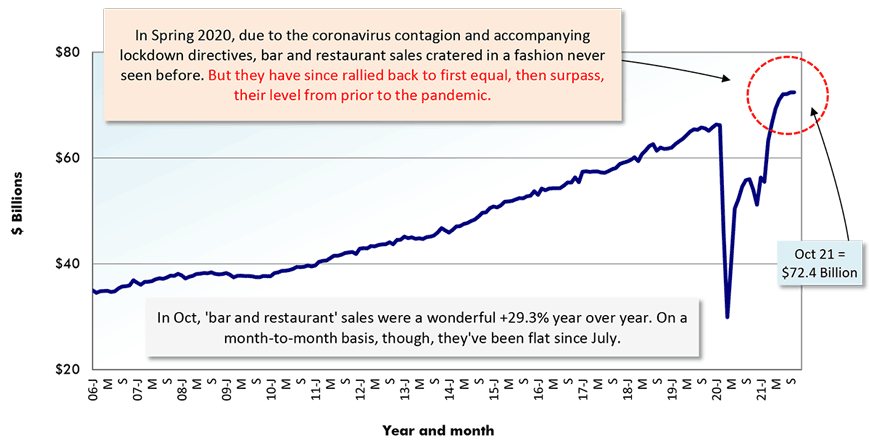
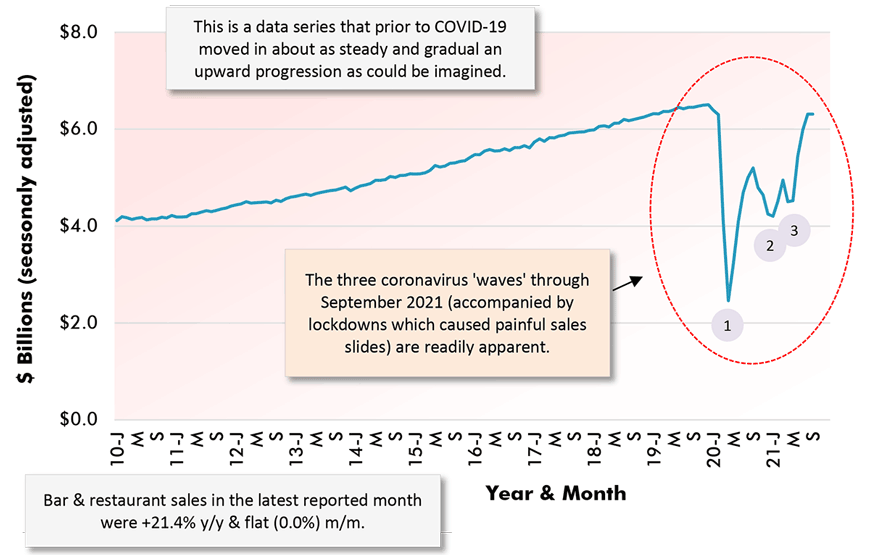
Also, from an analyst’s point of view, there’s much to like about Graph 10. It records the monthly history of food services and drinking place sales in Canada. Phrased more colloquially, these are restaurant and bar sales.
Among pre-pandemic economic indicators, they showed a rare lack of volatility as they gradually inclined from 2009 through 2019. Then they succumbed to the whirlwind. Each of the successive waves of coronavirus-related lockdowns can be clearly identified and numbered from one to three so far. Encouragingly, the depths of the troughs have been diminishing.
Based on Data Adjusted for Seasonal, Holiday & Trading Day Differences
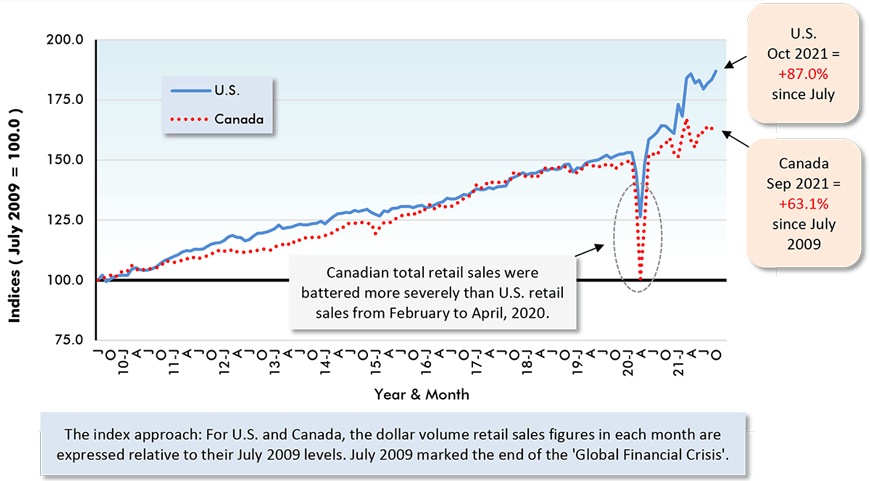
Chart: ConstructConnect.
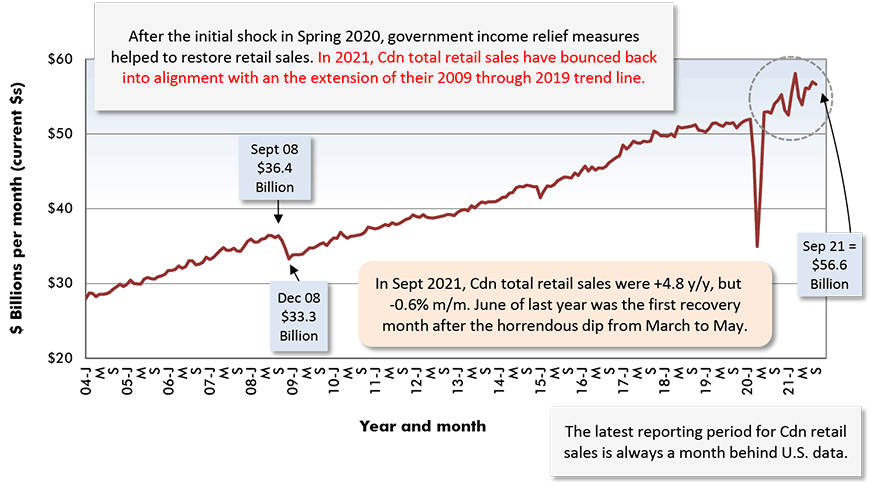
Chart: ConstructConnect.
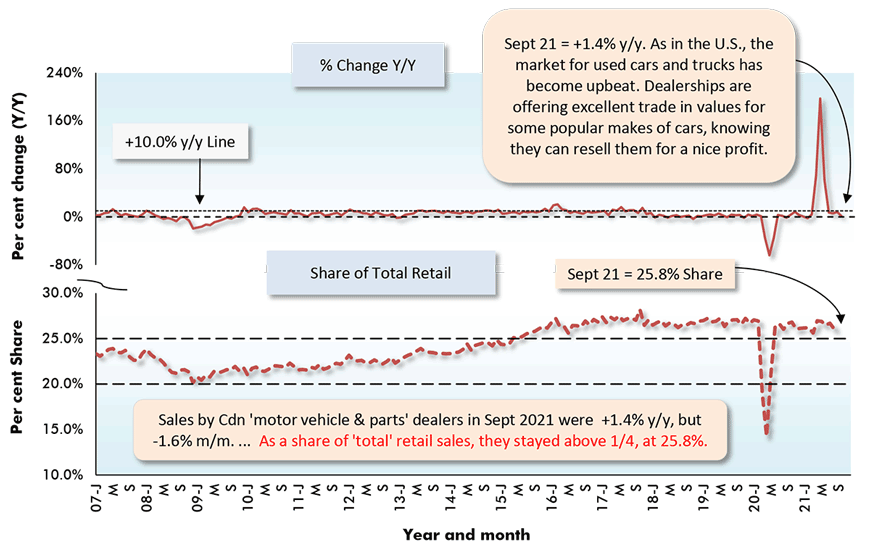
Chart: ConstructConnect.
Latest data point is for September 2021.
Chart: ConstructConnect.
Latest data point is for September, 2021.
Chart: ConstructConnect.
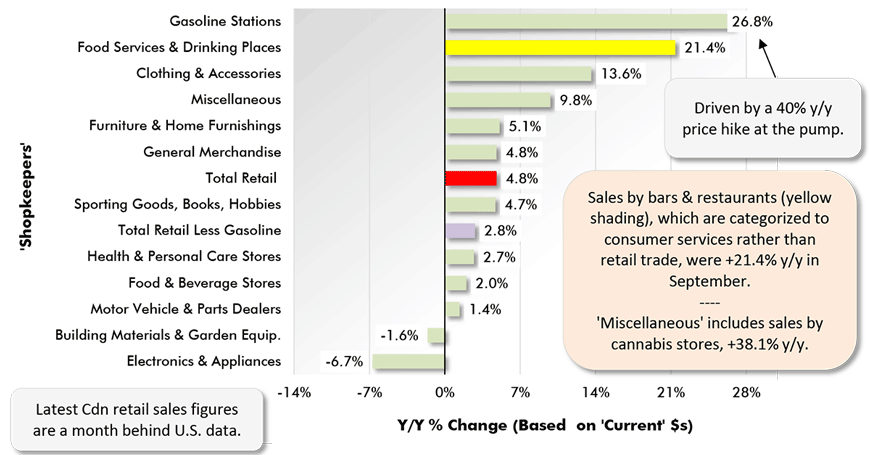
Chart: ConstructConnect.
September 2021 Year-over-Year (Y/Y) & Shares
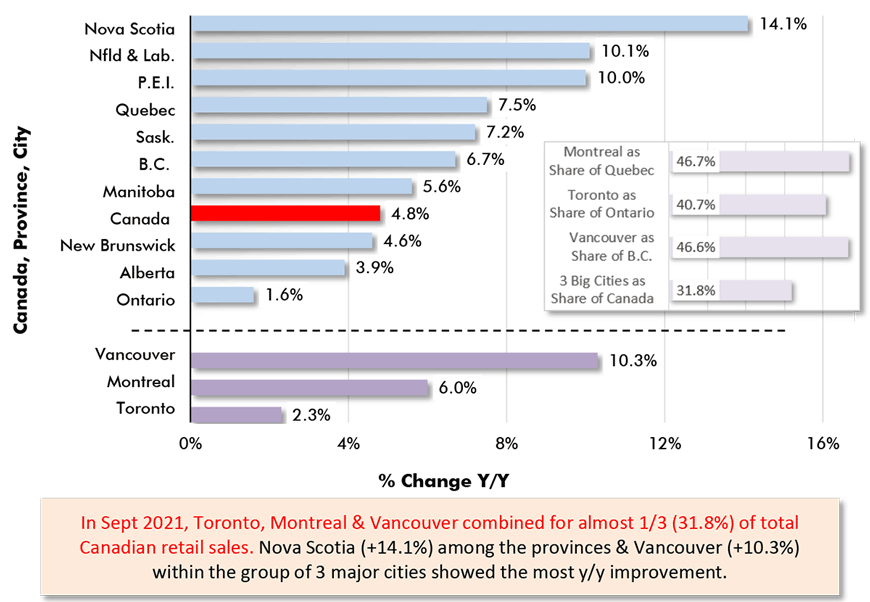
Chart: ConstructConnect.
Alex Carrick is Chief Economist for ConstructConnect. He has delivered presentations throughout North America on the U.S., Canadian and world construction outlooks. Mr. Carrick has been with the company since 1985. Links to his numerous articles are featured on Twitter @ConstructConnx, which has 50,000 followers.


Recent Comments
comments for this post are closed