The breakouts in U.S. construction material input costs showed few signs of abating in March.
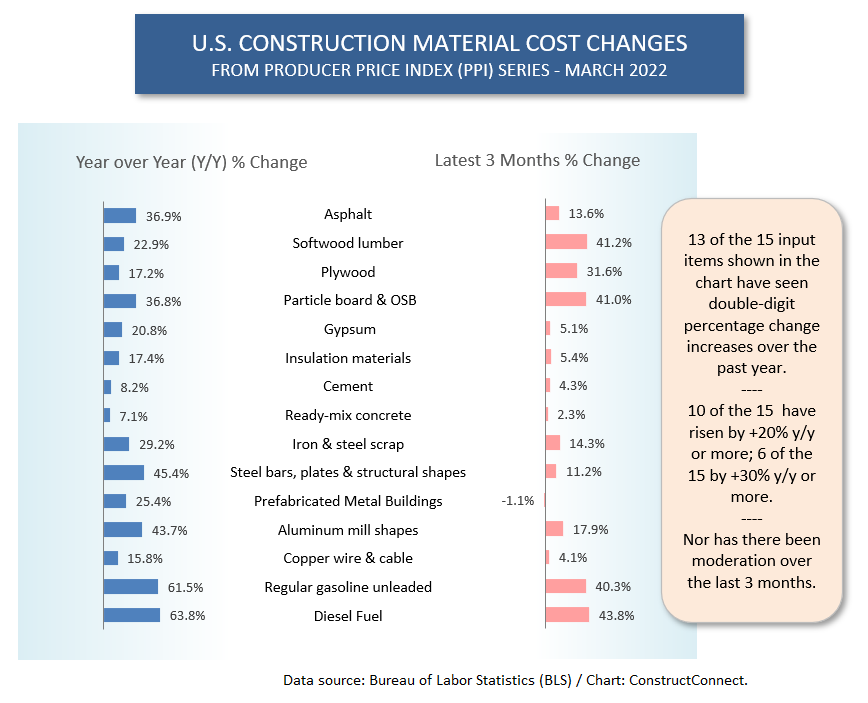
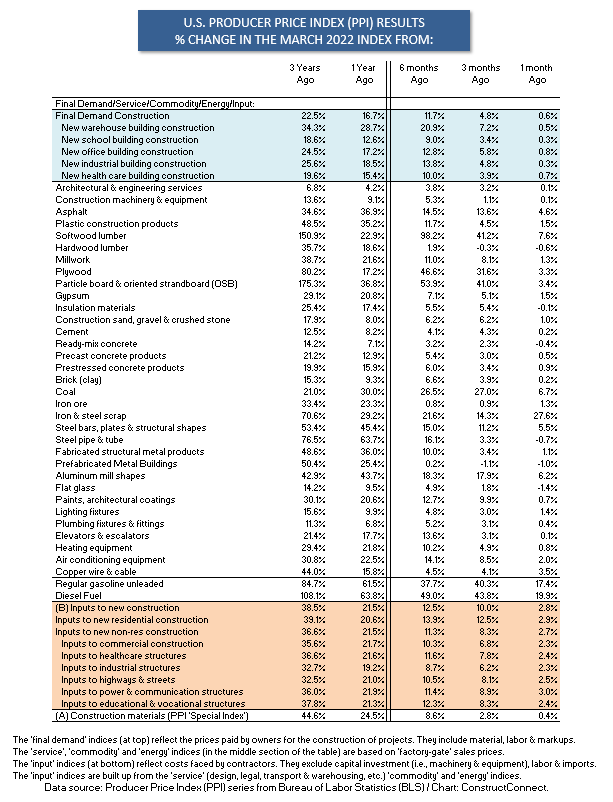
Table 1 presents year-over-year and latest-three-month percentage-change results for 15 Producer Price Index (PPI) series that bear on the materials cost side of construction projects. March 2022’s year-over-year percentage changes were in double digits in 13 of the 15 series; were +20% or more in 10 of the 15 series; and were +30% or more in 6 of the 15 series.
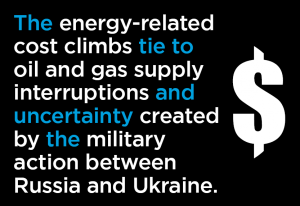
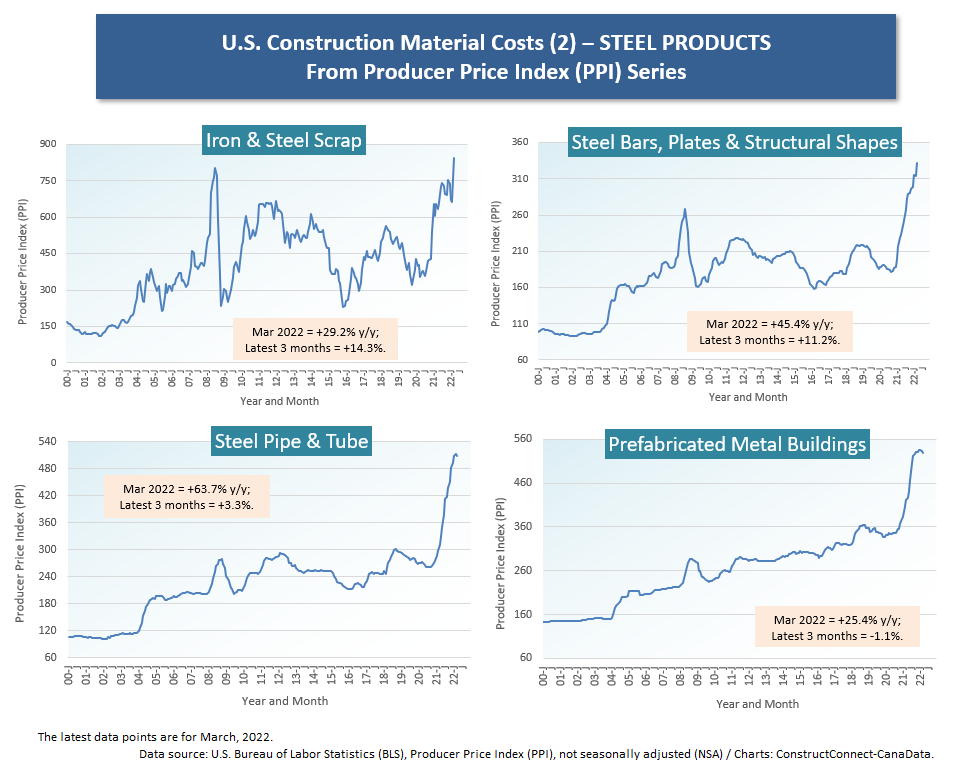
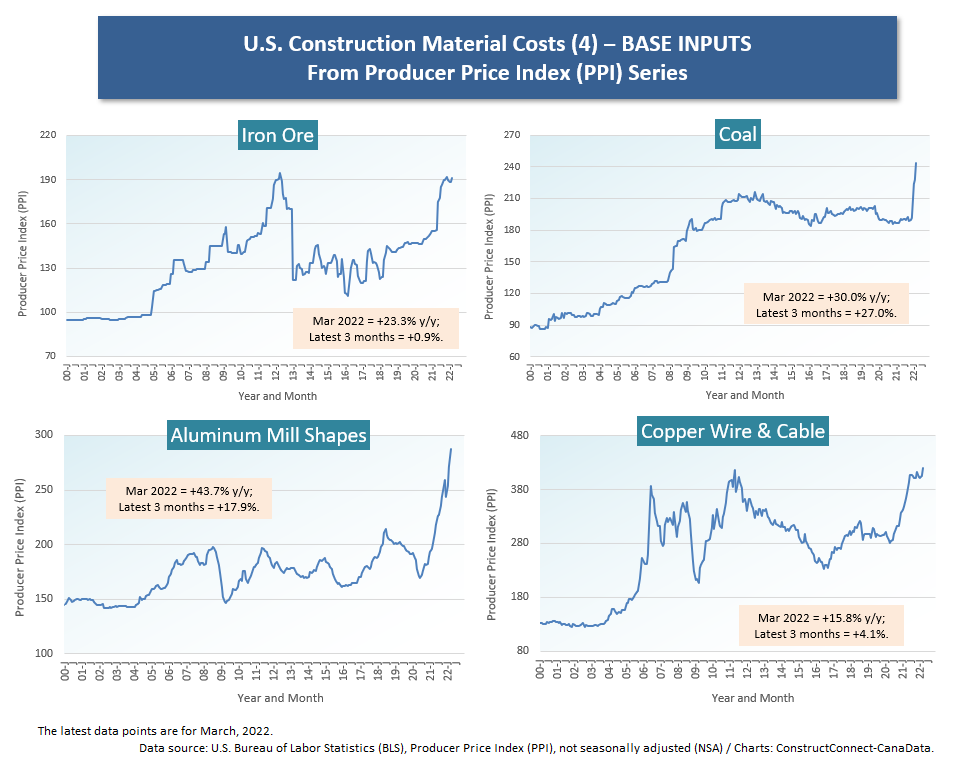
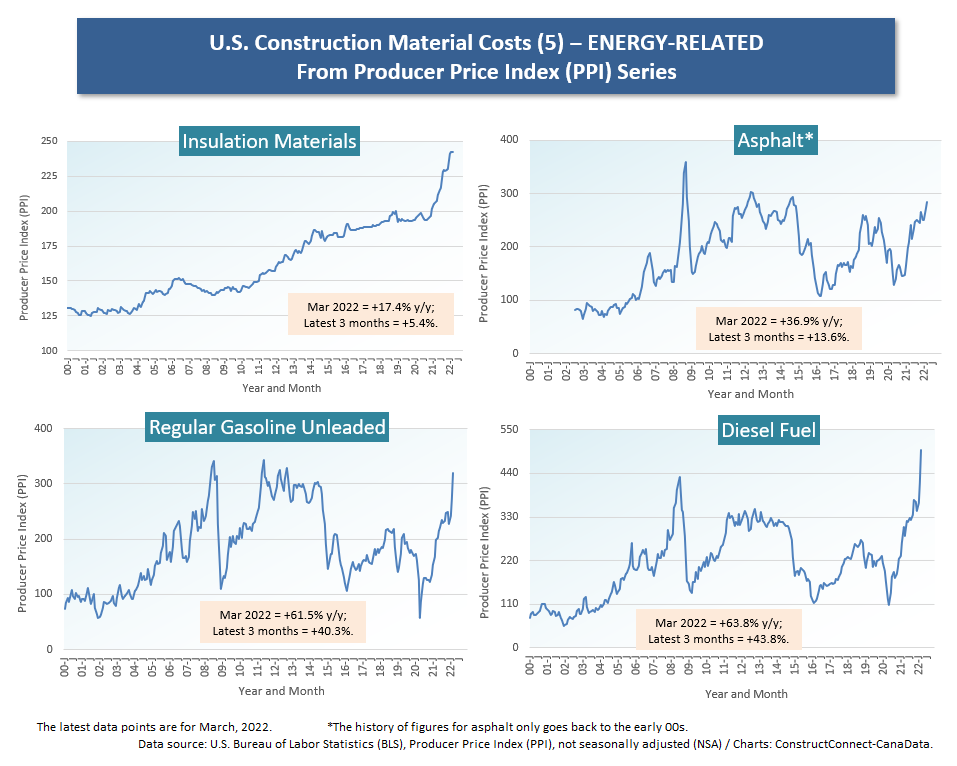
Beyond the big and not unexpected year-over-year energy-related cost jumps for diesel fuel (+63.8%), gasoline (+61.5%) and asphalt (+36.9%), the next greatest increases were recorded for steel bars, plates, and structural shapes (+45.4%), aluminum mill shapes (+43.7%) and particle board and OSB (+36.8%). The energy-related cost climbs tie to oil and gas supply interruptions and uncertainty created by the military action between Russia and Ukraine.
Over a shortened period, running from December 2021 to March 2022, percentage-change increases were led by diesel fuel (+43.8%), softwood lumber (+41.2%), particle board and OSB (+41.0%), gasoline (+40.3%) and plywood (+31.6%).
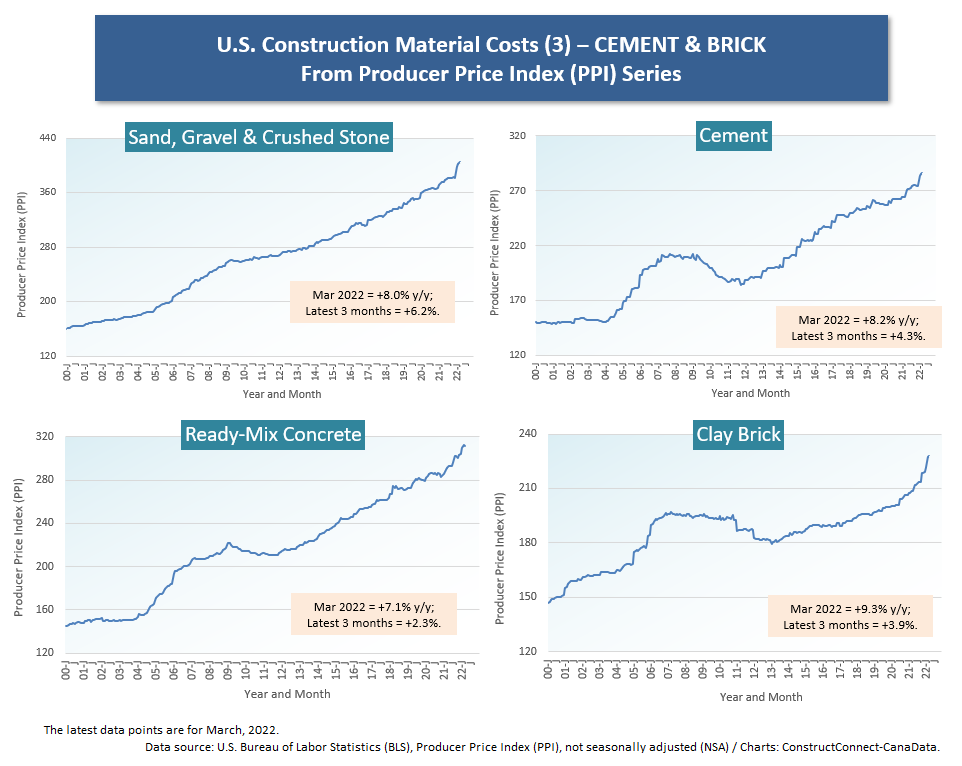
The smallest percentage-change increases in the latest three months came in ready-mix concrete (+2.3%), copper wire and cable (+4.1%) and cement (+4.3%). There was one decline among the indices, for prefabricated metal buildings (-1.1%).
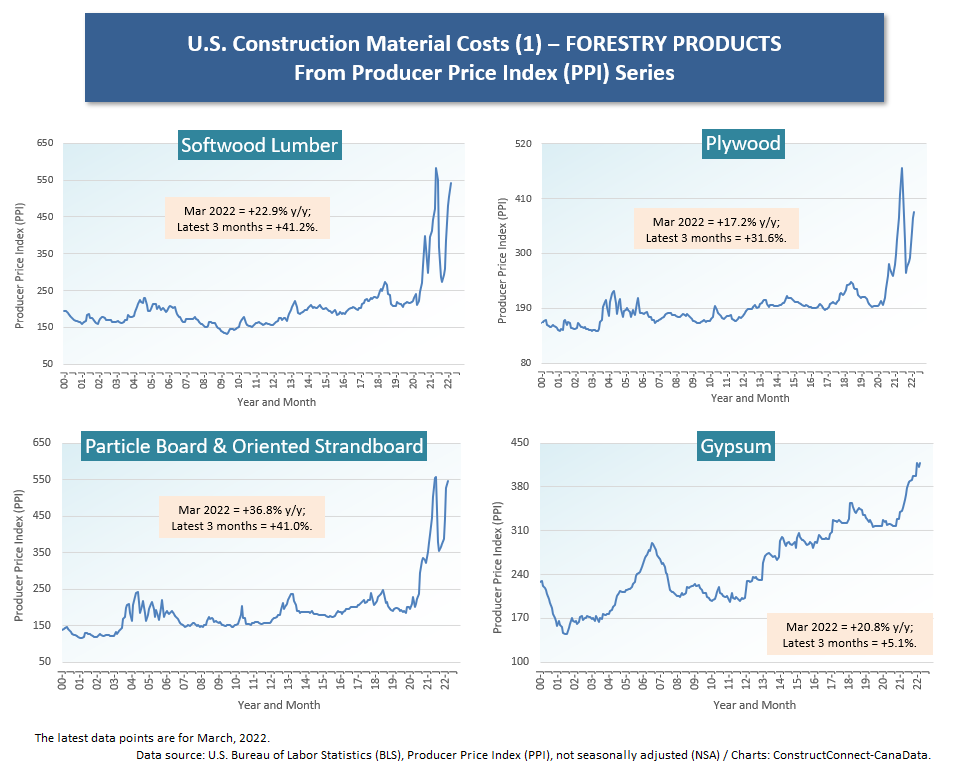
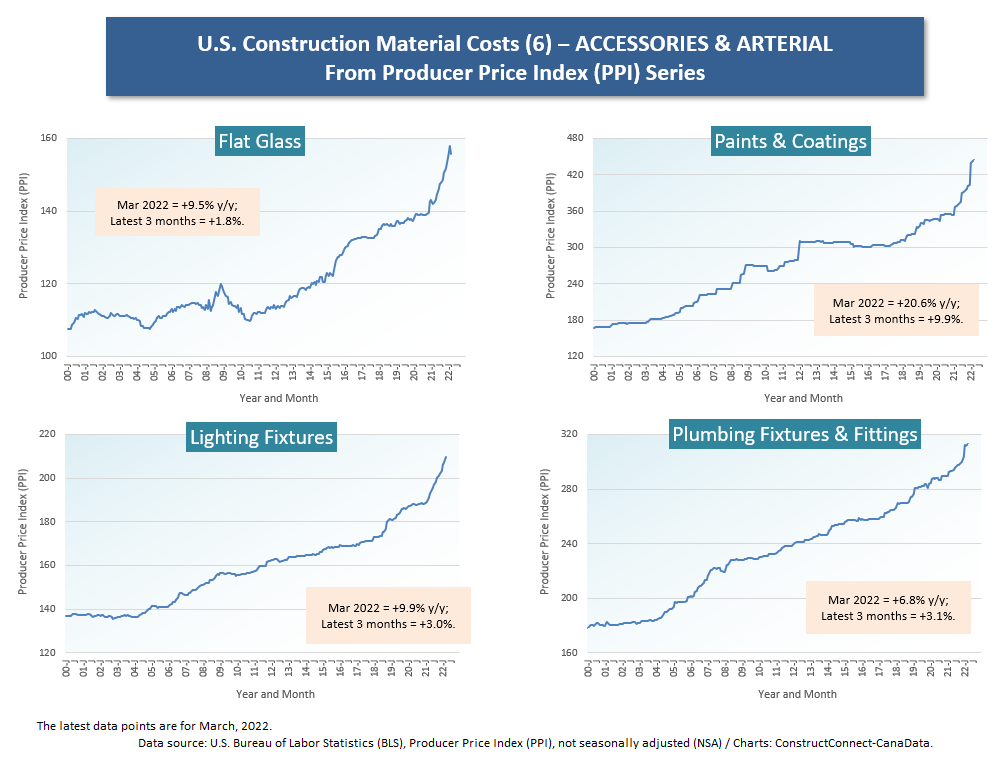
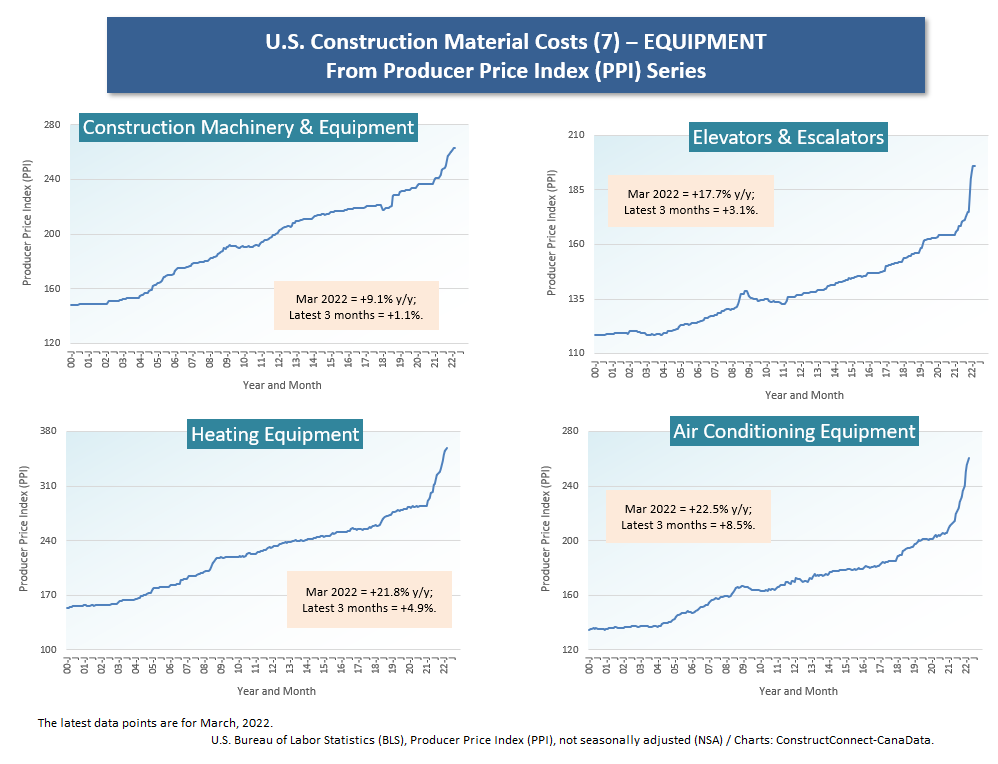
Following Table 1 are seven cluster charts of four graphs each for many of the key components going into construction projects. The data points in the 28 graphs show the history of each series from January 2000 to the most recent reported-on month, March 2022.
The simplest way to describe the appearances of the 28 graphs in the cluster charts is to say there are currently spikes everywhere. Every one of the cluster charts features slopes in most of the four graphs that, presently, are ascending sharply.
There are some instances where peaks have been reached and sideways movement has become evident, most notably in iron ore and copper wire and cable. But in nearly every instance, new heights are being established and the slopes of the curves have turned dramatically vertical.
Even such normally staid input items as ‘heating equipment’ and ‘air conditioning equipment’ are up by a fifth year over year, +21.8% and +22.5% respectively.
Some other outsized y/y increases to remark on are: ‘steel pipe and tube’, +63.7%; ‘coal’, +30.0%; and ‘elevators and escalators’, +17.7% y/y. Coal’s construction connection is in steelmaking, but it is now being called on, especially in Europe, to replace fossil fuels in power generation. The price is set internationally.
There’s one bit of encouragement to take away from March’s full PPI data set. There are two specific indices that measure the composite cost of an array of materials going into construction projects. One, which we’ll call (A), has a longer history but is comprised of a smaller number of material components than the other, (B).
(A) is presently +24.5% y/y and (B), +21.5% y/y. Their average is +23.0% y/y, which as Graph 2 highlights, is a step down from February (+25.5% y/y) and two steps down from January (+27.3%).
The bottom text box accompanying Graph 2 has a fuller explanation of (A) and (B).
The ‘final demand construction’ index from the PPI data set, otherwise known as the ‘bid price’ index, has been moving in the other direction. In March, as part of a continuing effort by contractors to restore ‘margins’, it jogged higher to +16.7% y/y.
Graph 2 makes clear there is a narrowing gap between still-frenzied material cost hikes y/y and trying-to-catch-up bid prices, also y/y, and that does signal the emergence of a somewhat healthier construction marketplace.
Graph 1
Cluster Chart 1 – Forestry Products
Cluster Chart 2 – Steel Products
Cluster Chart 3 – Cement & Brick
Cluster Chart 4 – Base Inputs
Cluster Chart 5 – Energy-Related
Cluster Chart 6 – Accessories & Arterial
Cluster Chart 7 – Equipment
Graph 2
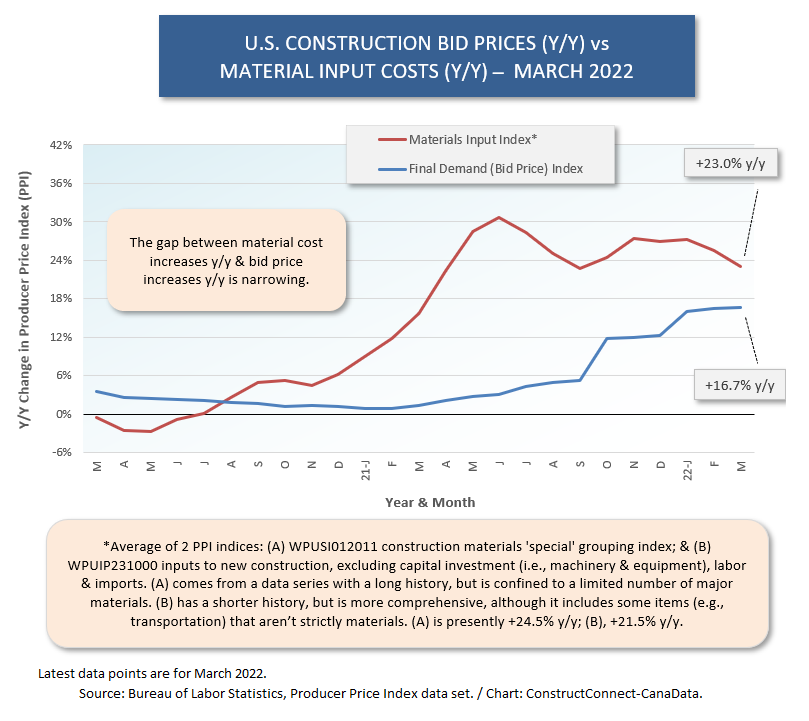
Table 1
Alex Carrick is Chief Economist for ConstructConnect. He has delivered presentations throughout North America on the U.S., Canadian and world construction outlooks. Mr. Carrick has been with the company since 1985. Links to his numerous articles are featured on Twitter @ConstructConnx, which has 50,000 followers.


This just keeps getting better and better…..what’s next?