
It seems everyone is talking about recession. Are we already in one? Should we pencil one in for 2023? Is there any possibility one can be avoided entirely? Stock market investors in North America, Europe and Japan no longer seem terribly worried.
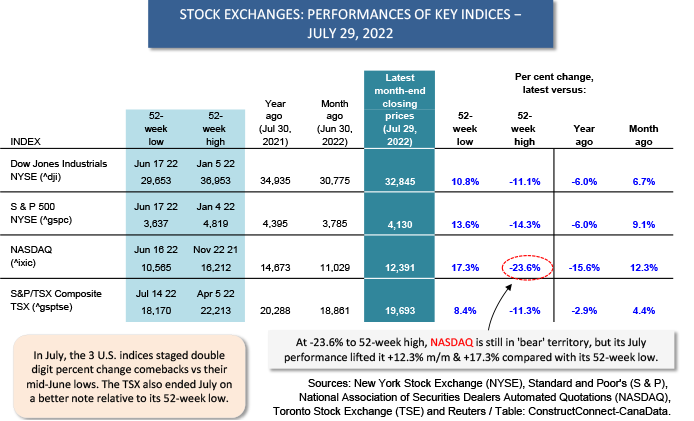
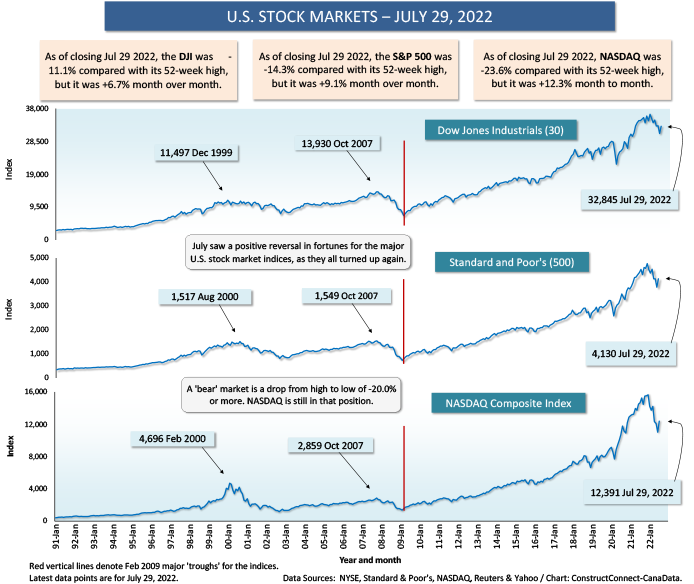
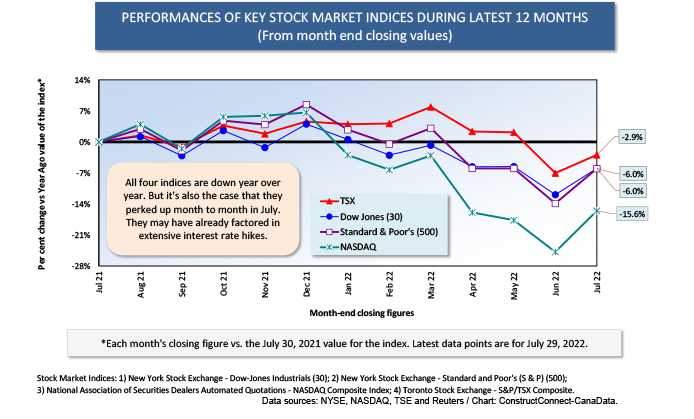
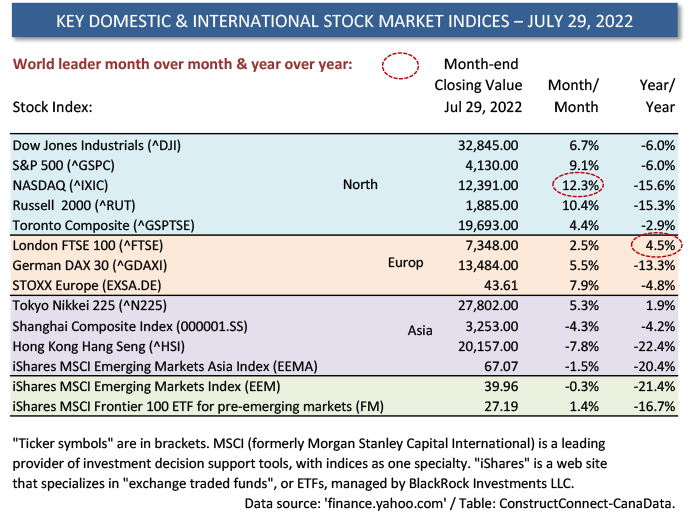
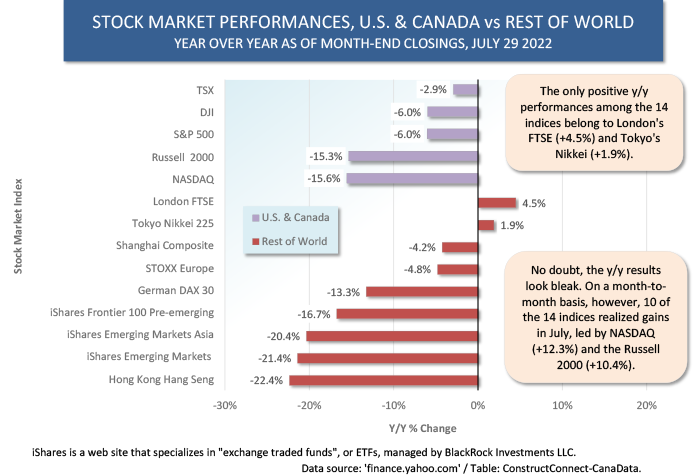
 In July, eight key indices (as set out in Table 2) cast aside their cloaks of gloom and went looking for the sun again. NASDAQ performed best (+12.3% month to month), followed by the Russell 2000 (+10.4% m/m), S&P 500 (+9.1%), STOXX Europe (+7.9%), the DJI (+6.7%), the German DAX (+5.5%), Tokyo’s Nikkei (+5.3%) and London’s FTSE (+2.5%).
More than half of Q2 earnings have now been reported and results versus estimates have been better than expected. It must be acknowledged, though, that this is partly the result of downward revisions to target estimates due to a slowing economy. U.S. ‘real’ (i.e., after inflation) GDP change in Q1 of this year was -1.6% annualized and in Q2, -0.9%.
There are two kinds of confidence that have a great deal of bearing on where economies will meander next. The first of these is consumer confidence.
The Conference Board’s July measure of consumer confidence was a figure of 95.7, where the year 1985 has been chosen as the base period equal to 100.0. In other words, the current reading is weak, but it’s not abysmal. In early 2020, at the beginning of the pandemic, the metric fell into the low 80s.
The consumer sentiment measure calculated by the University of Michigan has generally skewed bleaker. It fell to a record low of 50.0 in June. In July, however, it ticked up to 51.5.
In an assessment of manufacturing activity, the Purchasing Managers’ Index (PMI) of the Institute for Supply Management (ISM) fell to its lowest level in July since June 2020. Nevertheless, at a current reading of 52.8%, it indicates ongoing growth in both manufacturing activity and in the overall economy.
What caught many by surprise was July’s improvement in the ISM’s non-manufacturing PMI, reflecting the services side of economic activity. It bounced higher to 56.7% in July from 55.3% in June and reversed a decline of three months’ duration.
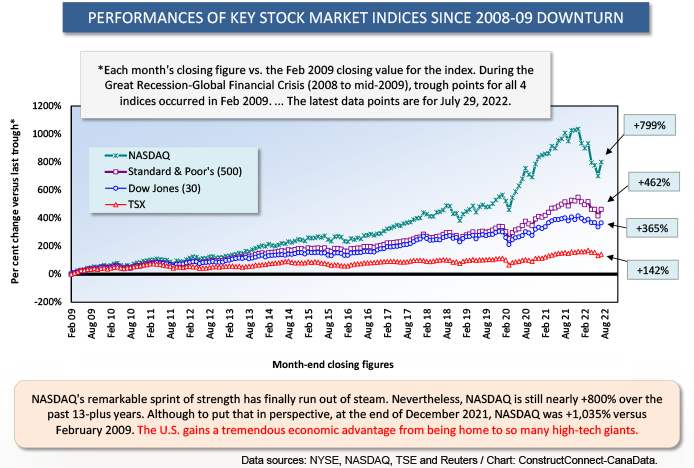
The other kind of confidence that is always of concern has to do with investor confidence. This is where the stock markets come in. How the indices move is generally assumed to be a good gauge of investor confidence. (In turn, rousing ‘animal spirits’ in stock markets, through IPOs and the facilitation of other means to raise capital, are good for construction activity.)
July’s rebounds are encouraging news. Although let’s not get ahead of ourselves. It’s universally accepted by analysts that ‘volatility’ will characterize stock market activity through the remainder of this year.
As for July’s bounce backs in major indices, the possible explanations being touted include the following.
- All the froth in markets has already been removed.
- The share prices of many equities have already been struck down as far as needed in reaction to monetary tightening.
- And, if one buys into the speculation, the Fed will note the success being achieved in dialing back the GDP growth needle and will move less aggressively on additional interest rate hikes.
The federal funds rate is presently in a range of 2.25% to 2.50. A further climb of 75 basis points (where 100 basis points = 1.00%) has been mentioned by the Fed as possible in September. Then November and December would each see +25 bps increments.
In this scenario, the federal funds rate in early 2023 would reside between 3.50% and 3.75%. It would be in a zone of ‘neutrality’, neither restrictive nor stimulative.
In March 1980, when U.S. inflation was raging at +14.8% y/y for CPI-U, the federal funds rate was lifted to an all-time high of 20.0%. Now that’s some serious tightening!
Table 1
Graph 1
Graph 2
Graph 3
Graph 4
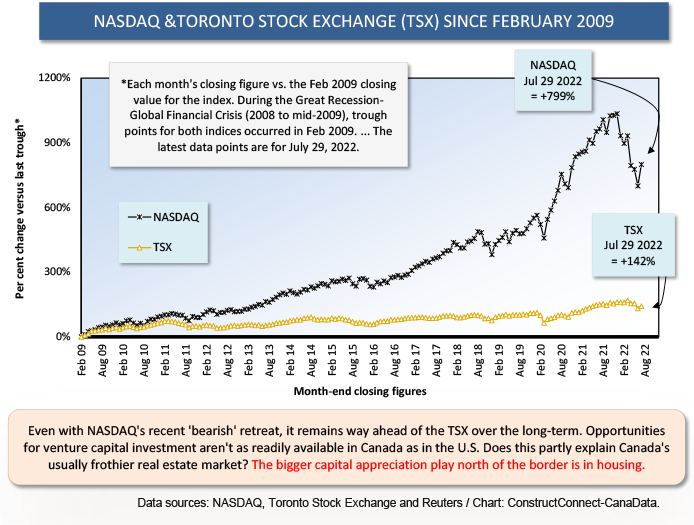
Table 2
Graph 5
Alex Carrick is Chief Economist for ConstructConnect. He has delivered presentations throughout North America on the U.S., Canadian and world construction outlooks. Mr. Carrick has been with the company since 1985. Links to his numerous articles are featured on Twitter @ConstructConnx, which has 50,000 followers.


Recent Comments
comments for this post are closed