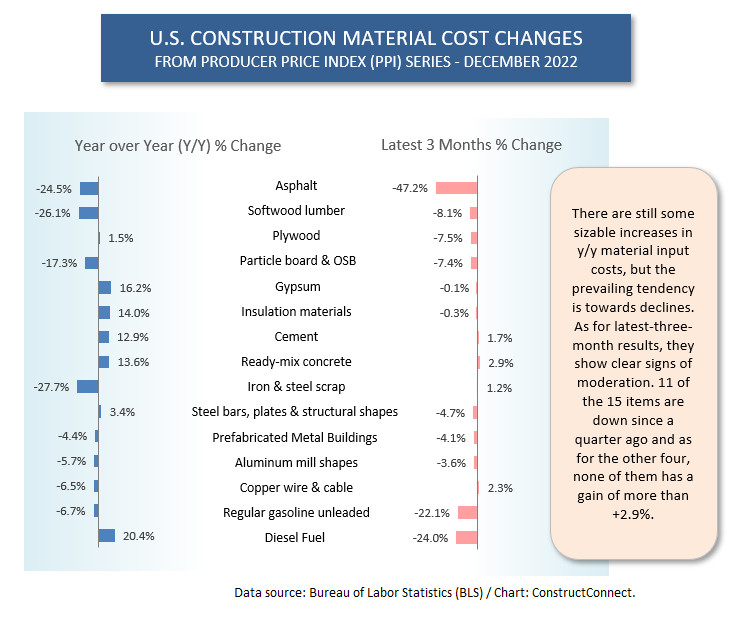
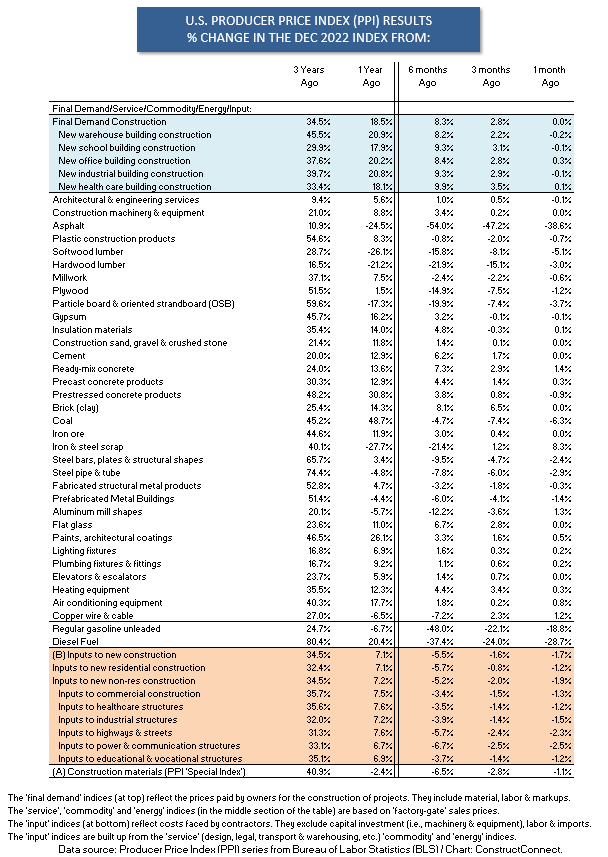
Graph 1 below shows the moderation in construction material costs that has been taking place. There’s about a 50-50 split between items with year-over-year price increases versus those with y/y declines.
 But that’s December 2022 compared with December 2021. When the focus is narrowed to just the latest three months, the easing in prices is more evident. For the 15 input items, 11 experienced a drop in price from September to the end of 2022. And as for the four other items, none of the latest three-month increases was greater than +2.9%.
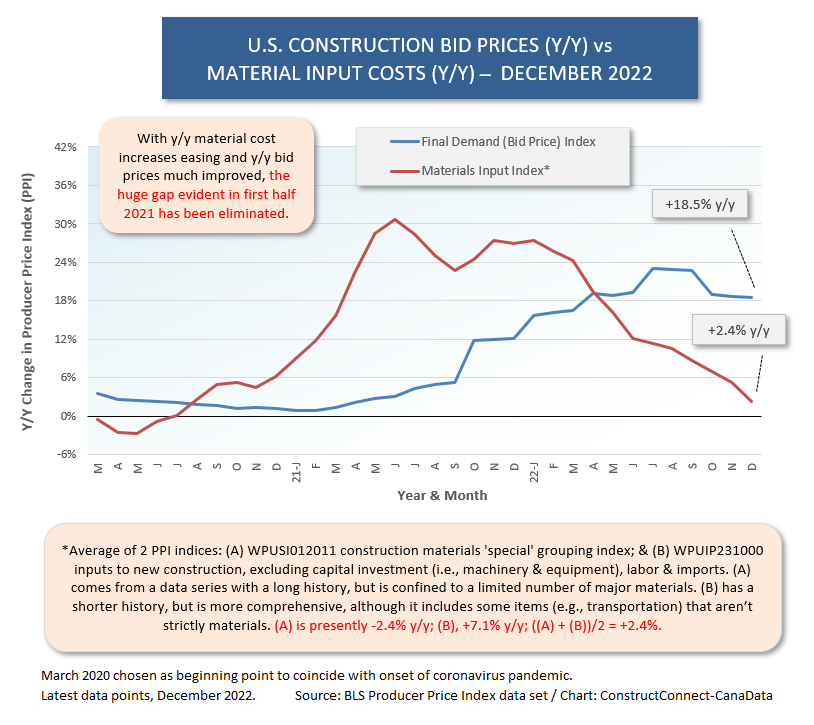
From Graph 2, the shout-out days of extraordinary y/y material cost increases, mainly in 2021, have now receded. In the Producer Price Index data series compiled by the Bureau of Labor Statistics, there are two specific material input indices, one with a longer history and a limited number of components, the other with a shorter history, but a more comprehensive make-up. (The two indices are explained more fully in a text box accompanying Graph 2.)
The average year-over-year change for those two indices has dropped to just +2.4%. The PPI ‘construction final demand’ index, generally taken to be equivalent to a ‘bid price’ index, has retreated a little, but remains elevated at +18.5% y/y.
The bid price index has simply been making up lost ground. (Graph 1 shows the huge gap that opened between upwardly exploding material costs and barely budging bid prices in 2021.)
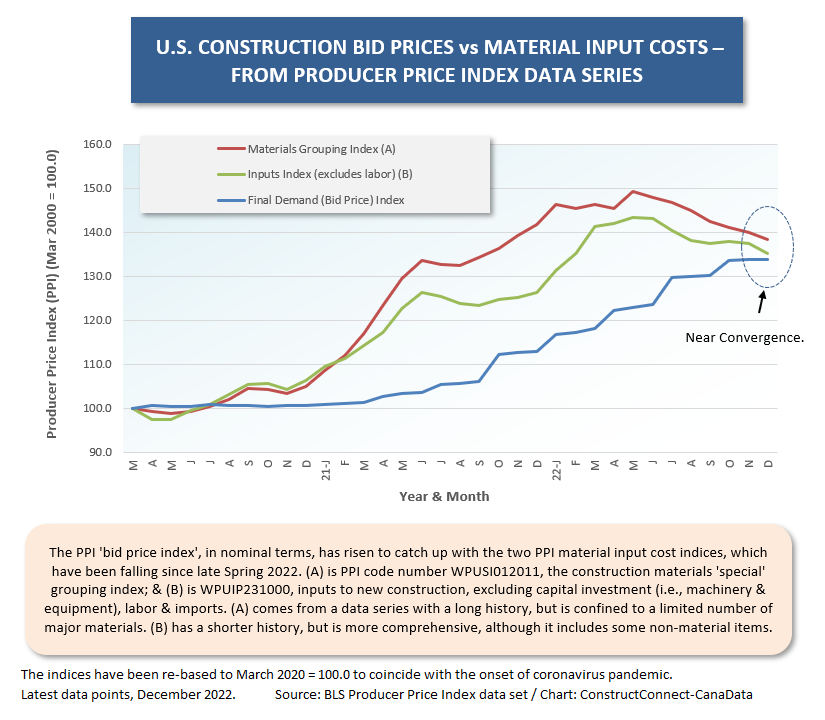
Graph 2 establishes that the period of catch-up may be approaching an end. Graph 2 takes the nominal values of the indices for materials and bid prices and re-calculates them with a different base. For all three indices, a March 2020 base is employed (i.e., March 2020 = 100.0), since that was when the first severe impacts of the coronavirus first burst on the scene in North America.
According to this approach, the three indices (two for materials and one for bid prices) are near convergence. The hefty hikes in material costs, with following pullbacks, have left them at a position where bid prices have risen to almost meet them.
The percentage change in material costs as an average of the two input indices, December 2022 versus March 2020, was +36.8%. The climb in the bid price index over the same time frame has been almost a match, +33.8%.
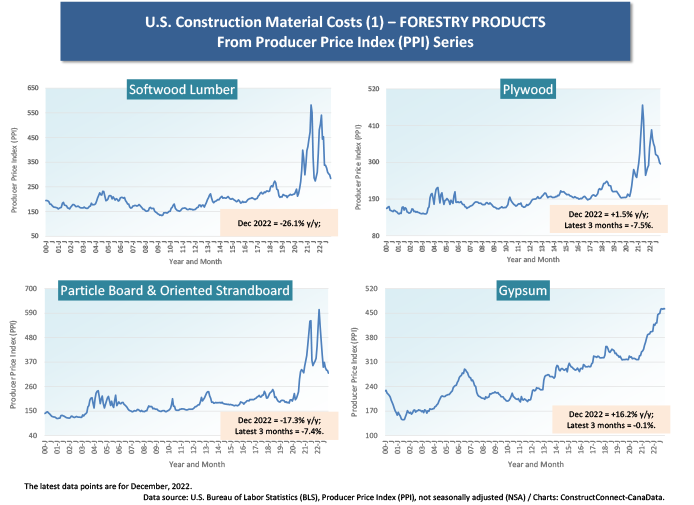
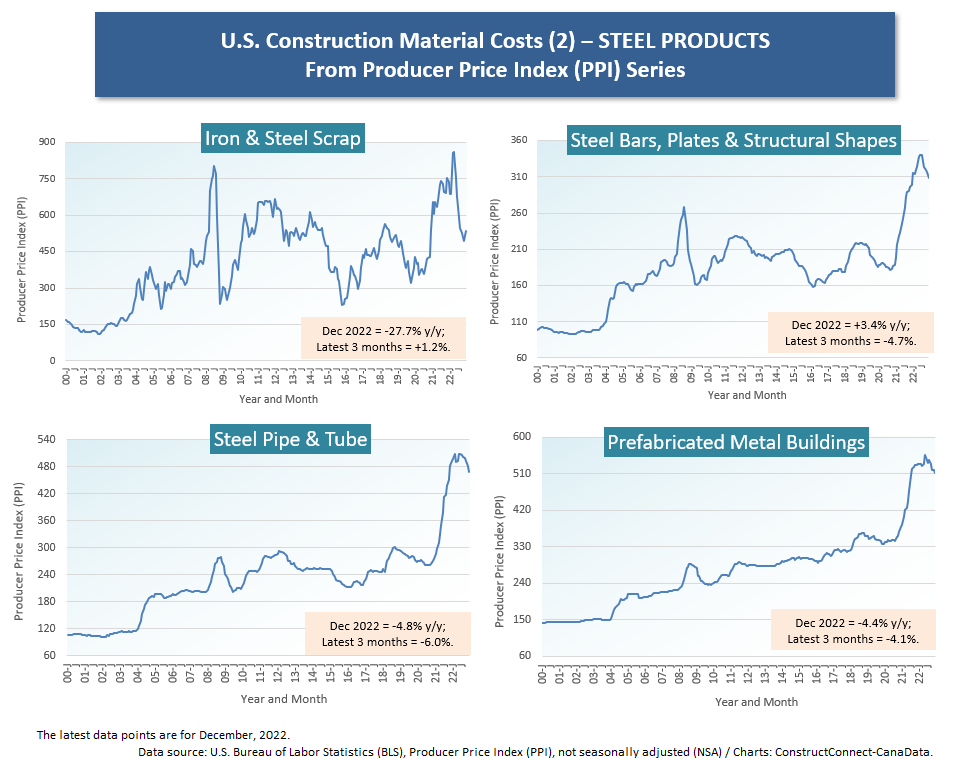
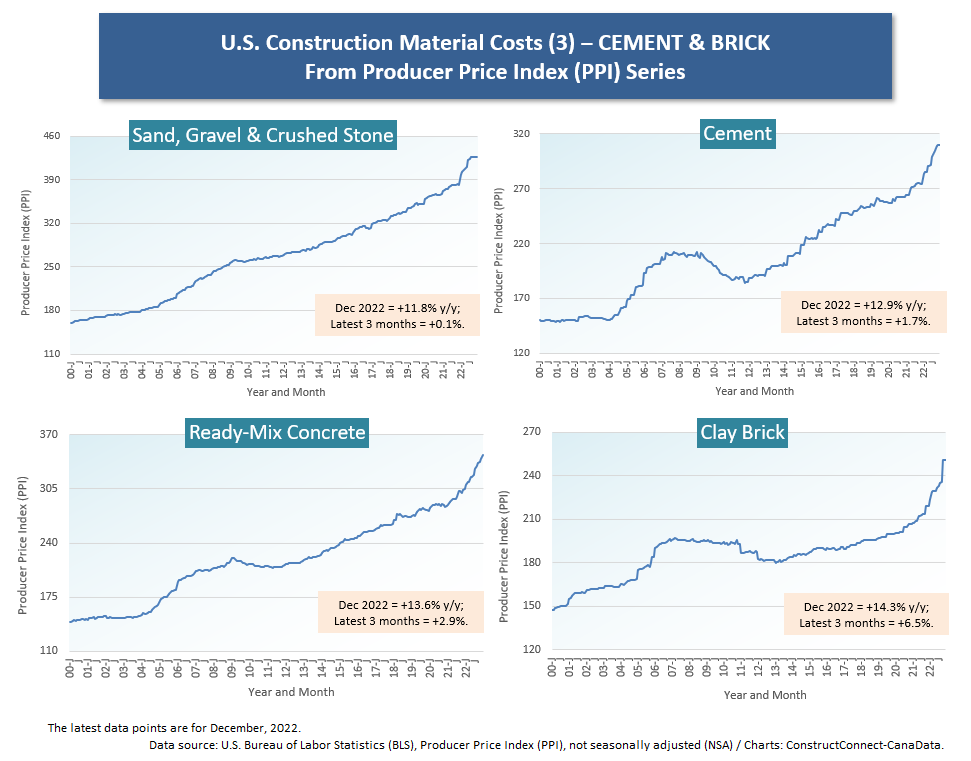
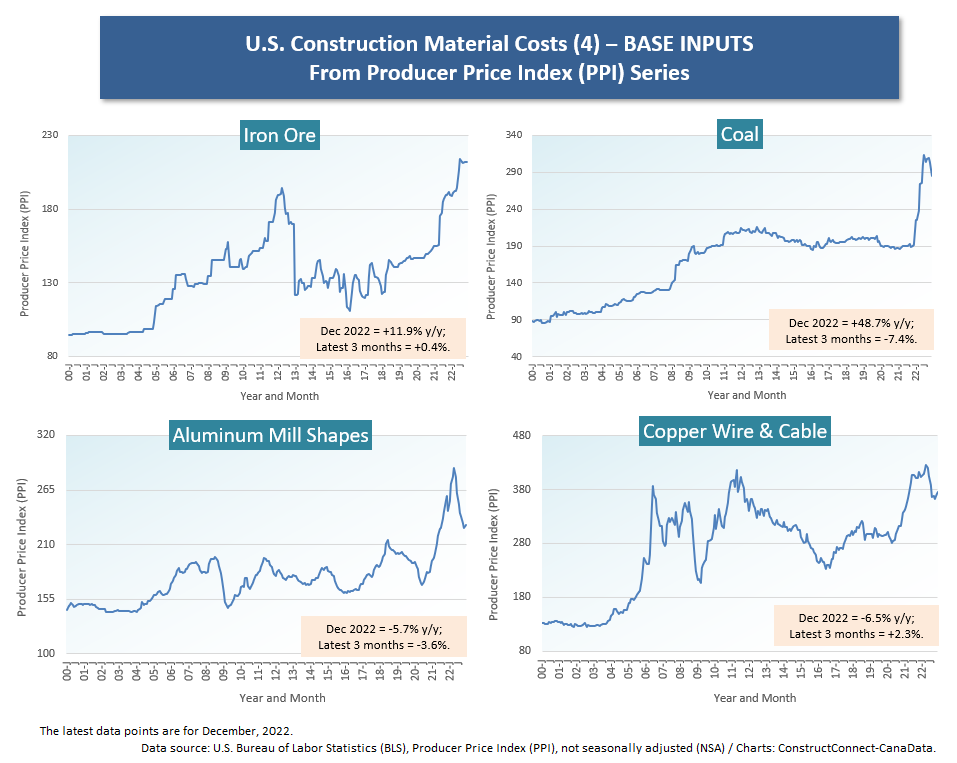
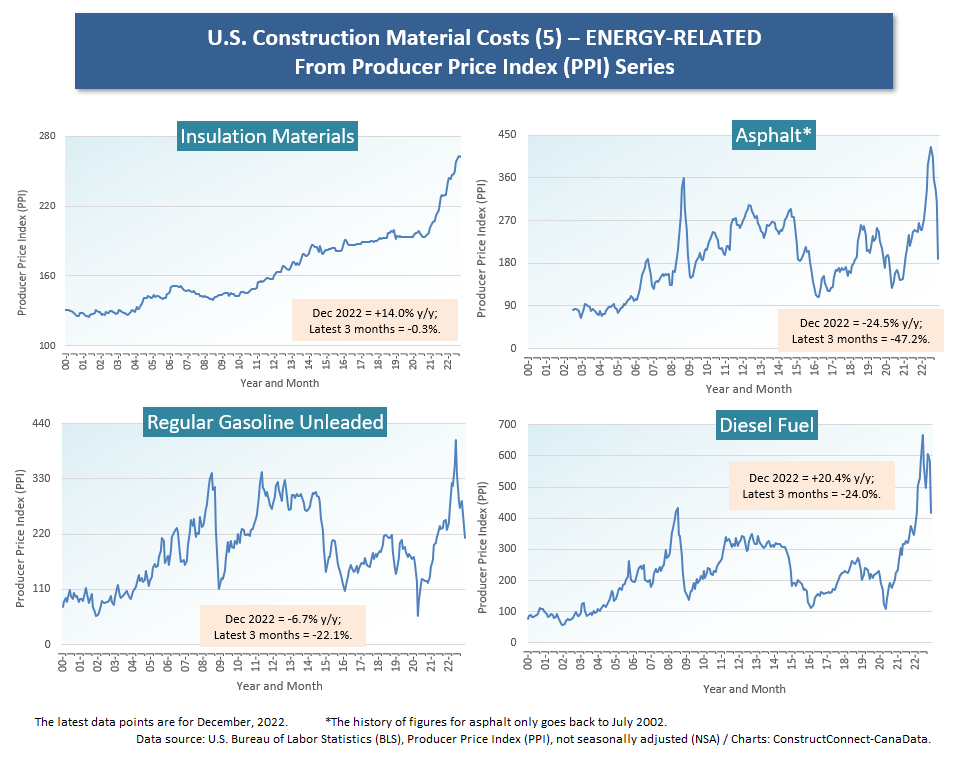
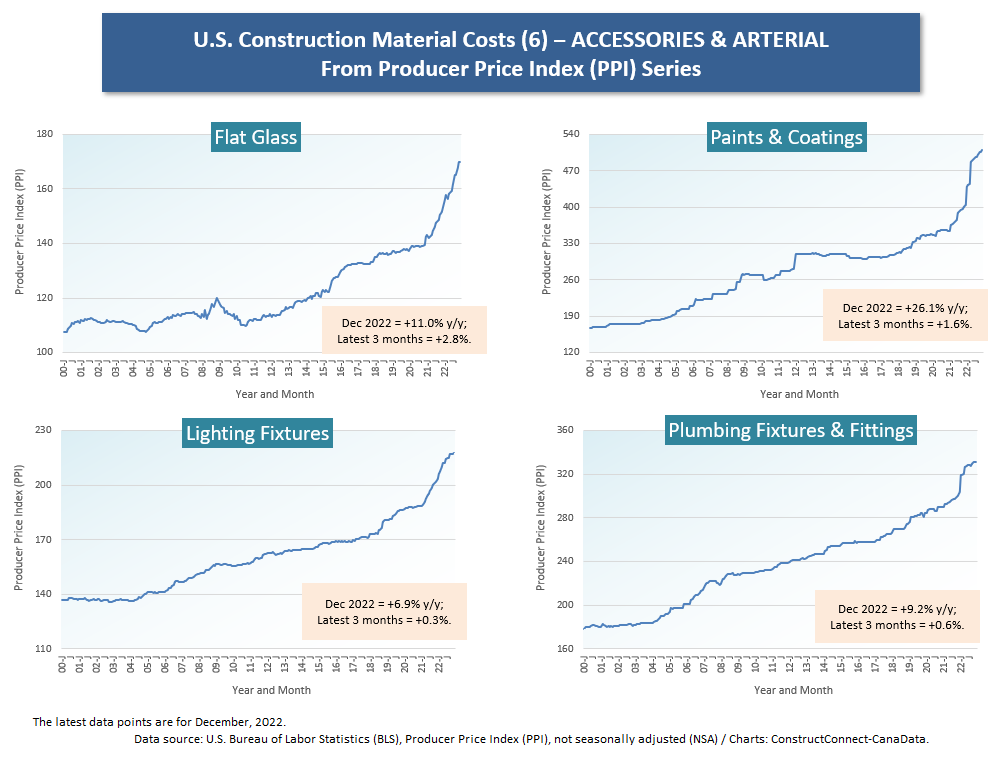
Cluster charts 1 through 7 show what has been happening for 28 inputs into construction.
Generally, there’s been a relaxation in prices for forestry, steel, aluminum, copper, and energy-related products. At a primary level, the exception has been cement-related products, where not much diversion from an upwards course has occurred so far.
Nor have more finished products including lighting and plumbing fixtures, all manner of equipment, and escalators/elevators shown an inclination, as yet, to shave much off their steep price ascents.
Graph 1
Graph 2
Graph 3
Cluster Chart 1
Cluster Chart 2
Cluster Chart 3
Cluster Chart 4
Cluster Chart 5
Cluster Chart 6
Cluster Chart 7
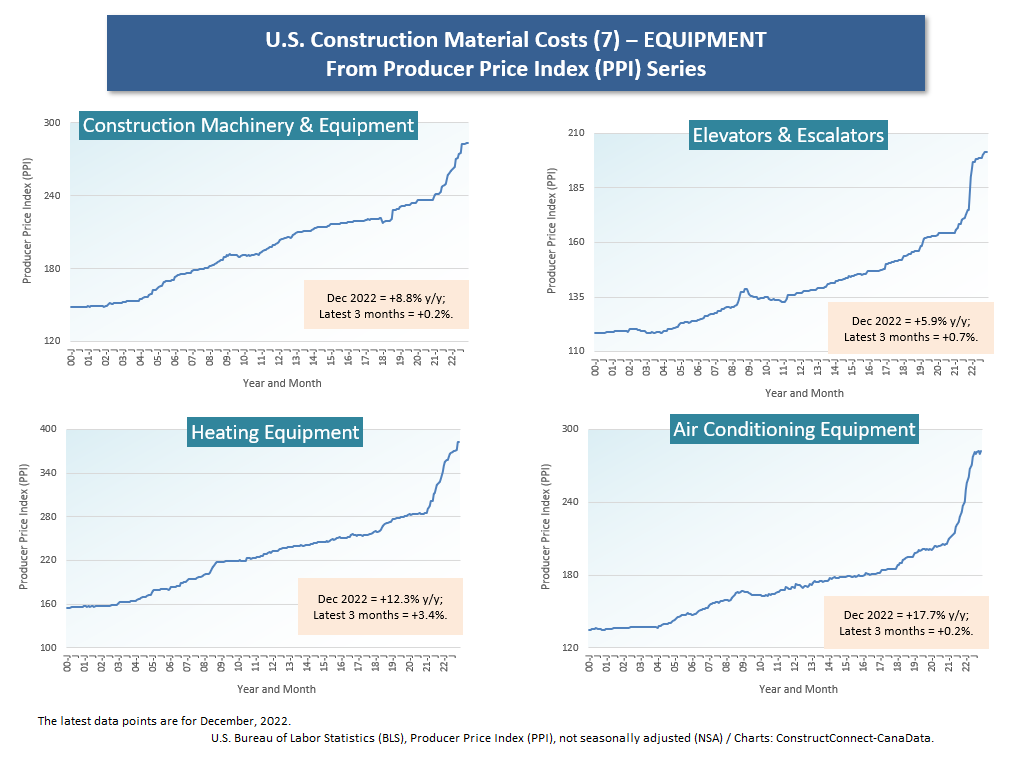
Table 1
Alex Carrick is Chief Economist for ConstructConnect. He has delivered presentations throughout North America on the U.S., Canadian and world construction outlooks. Mr. Carrick has been with the company since 1985. Links to his numerous articles are featured on Twitter @ConstructConnx, which has 50,000 followers.


Recent Comments