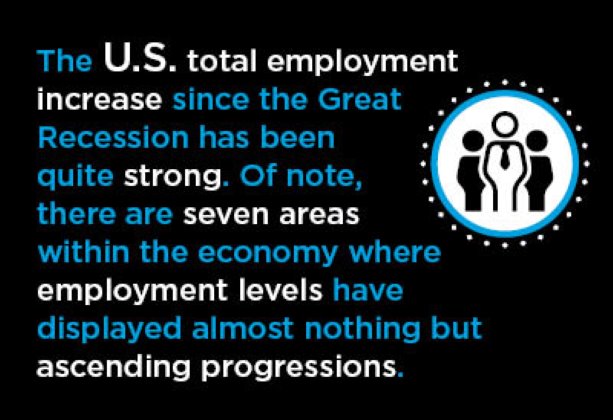
The U.S. total employment increase since the Great Recession has been quite strong. Most type-of-job categories have bounced back with remarkable resiliency.
There are seven areas within the economy, however, where the jobs improvement has gone well beyond most others. Their employment levels have displayed almost nothing but ascending progressions.
They even moved through 2008-09’s Big Dip relatively unscathed.
Due to their upbeat story, I thought it would be fun to put the seven on display in this article.
Few of the seven will come as a surprise. Most have already received much media attention.
Graph 1: Since the early 00s, the number of people working to sell goods and services over the Internet has increased by fourfold. Many ‘bricks and mortar’ retailers have been steamrollered along the way. (Graph 7 is one exception.)
Solely Internet Retail Sellers
(seasonally adjusted data)

Chart: ConstructConnect.
Graph 2: Employment with call centers and telemarketers has also skyrocketed. Those phone calls we all receive spread throughout the day may be annoying, but they’re also effective.
Call Centers & Telemarketing
(seasonally adjusted data)

Chart: ConstructConnect.
Graph 3: We’re living in a digital age and software publishers are flourishing. Each new generation of smart phones and tablets encourages the development of new applications for B2B transactions and personal enjoyment.
Software Publishing
(seasonally adjusted data)

Chart: ConstructConnect.
Graph 4: An aging population has required the hiring of more caregivers. This effect will become more dramatic in the years ahead, especially from 2025 on when the first wave of ‘baby boomers’ will reach the age of 80. (It’s good news that healthier lifestyles are extending the period of independent living beyond what was the case in the past.)
Community Care Facilities for the Elderly
(seasonally adjusted data)

Chart: ConstructConnect.
Graph 5: Who feels safe anymore? Apparently few enough of us that the business of providing ‘investigation and security services’ has taken off. Since the turn of the millennium, employment in private-sector law enforcement has risen by half and is now approaching one million jobs.
Investigation & Security Services
(seasonally adjusted data)

Chart: ConstructConnect.
Graph 6: In a big nod to environmental concerns, the number of U.S. jobs in ‘waste management and remediation services’ has been climbing steadily. Again, the percentage rise from 2000 to the present has been close to 50%.
Waste Management & Remediation Services
(seasonally adjusted data)

Chart: ConstructConnect.
Graph 7: Some retailers have managed to withstand the onslaught of Internet platforms. Payrolls at ‘pet and pet supplies stores’ have continued to ‘pounce’ forward. Maybe it has something to do with the popularity of ‘cute pet trick’ videos on Facebook and Instagram.
Pet & Pet Supplies Stores
(seasonally adjusted data)

Chart: ConstructConnect.


Recent Comments
comments for this post are closed