
This article features U.S. and Canadian maps with color-coding to highlight the varying speeds of population change in states and provinces. For the U.S., the annual population comparisons are July 1, 2017 versus July 1, 2016. For Canada, the time frame is Q4 2017 versus Q4 2016. Q4 is as at October 1st.

In both maps, blue shading represents growth rates equal to or lower than the country-wide performance. Green shading is for growth rates exceeding the country-wide level.
Do please note, however, that the country-wide rate of population growth for Canada, at +1.3%, has been nearly twice as fast as for the U.S., +0.7%.
A rule of thumb often stated or adopted is that the U.S. has a population ten times bigger than Canada’s. While that’s a close approximation, the truer ratio is nine-to-one.
The current population estimate for Canada is 36.9 million; for the U.S., 325.7 million. The math works out as follows: 36.9 ÷ 325.7 = 11% (or one-ninth).
The latest national, state and provincial population statistics yield a wealth of interesting material. The following observations arise from ‘playing’ with the numbers.
The summed populations of the four largest U.S. states, at 109 million, is 33.4% (or one-third) of the U.S. total.
Another way to express the above is to say that one in three Americans lives in California, Texas, Florida or New York.
The populations of Florida (21.0 million) and New York (19.8 million) come close to being equal.
California’s population (39.5 million), however, is about the same as Florida and New York combined.
The population of California has become surprisingly large. It’s more than the population of Canada (36.9 million). It’s 12% (or one-eighth) of the population of the entire U.S.
Stated plainly, one out of every eight Americans lives in California.
U.S. – State Population Growth Rates
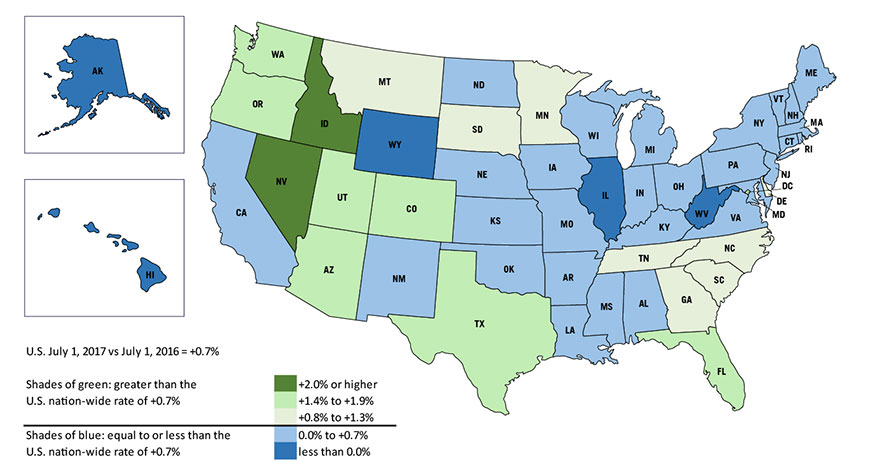
Data source: U.S. Census Bureau.
Graphic: ConstructConnect.
Table 1: U.S. States – Population
| Rank | Level (July 1, 2017) | Rank | % Change (Jul 17 vs Jul 16) | ||||
| 1 | California | 39,536,653 | 1 | Idaho | 2.2% | ||
| 2 | Texas | 28,304,596 | 2 | Nevada | 2.0% | ||
| 3 | Florida | 20,984,400 | 3 | Utah | 1.9% | ||
| 4 | New York | 19,849,399 | 4 | Washington | 1.7% | ||
| 5 | Pennsylvania | 12,805,537 | 5 | Florida | 1.6% | ||
| 6 | Illinois | 12,802,023 | 6 | Arizona | 1.6% | ||
| 7 | Ohio | 11,658,609 | 7 | Texas | 1.4% | ||
| 8 | Georgia | 10,429,379 | 8 | District of Columbia | 1.4% | ||
| 9 | North Carolina | 10,273,419 | 9 | Colorado | 1.4% | ||
| 10 | Michigan | 9,962,311 | 10 | Oregon | 1.4% | ||
| 11 | New Jersey | 9,005,644 | 11 | South Carolina | 1.3% | ||
| 12 | Virginia | 8,470,020 | 12 | North Carolina | 1.1% | ||
| 13 | Washington | 7,405,743 | 13 | Montana | 1.1% | ||
| 14 | Arizona | 7,016,270 | 14 | Georgia | 1.1% | ||
| 15 | Massachusetts | 6,859,819 | 15 | Tennessee | 1.0% | ||
| 16 | Tennessee | 6,715,984 | 16 | Delaware | 1.0% | ||
| 17 | Indiana | 6,666,818 | 17 | South Dakota | 0.9% | ||
| 18 | Missouri | 6,113,532 | 18 | Minnesota | 0.9% | ||
| 19 | Maryland | 6,052,177 | 19 | Virginia | 0.7% | ||
| 20 | Wisconsin | 5,795,483 | 20 | Nebraska | 0.7% | ||
| 21 | Colorado | 5,607,154 | 21 | California | 0.6% | ||
| 22 | Minnesota | 5,576,606 | 22 | New Hampshire | 0.6% | ||
| 23 | South Carolina | 5,024,369 | 23 | Arkansas | 0.5% | ||
| 24 | Alabama | 4,874,747 | 24 | Massachusetts | 0.5% | ||
| 25 | Louisiana | 4,684,333 | 25 | Indiana | 0.5% | ||
| 26 | Kentucky | 4,454,189 | 26 | Iowa | 0.5% | ||
| 27 | Oregon | 4,142,776 | 27 | Maryland | 0.5% | ||
| 28 | Oklahoma | 3,930,864 | 28 | Maine | 0.4% | ||
| 29 | Connecticut | 3,588,184 | 29 | Kentucky | 0.4% | ||
| 30 | Iowa | 3,145,711 | 30 | Wisconsin | 0.4% | ||
| 31 | Utah | 3,101,833 | 31 | Missouri | 0.4% | ||
| 32 | Arkansas | 3,004,279 | 32 | Ohio | 0.3% | ||
| 33 | Nevada | 2,998,039 | 33 | New Jersey | 0.3% | ||
| 34 | Mississippi | 2,984,100 | 34 | Alabama | 0.3% | ||
| 35 | Kansas | 2,913,123 | 35 | Michigan | 0.3% | ||
| 36 | New Mexico | 2,088,070 | 36 | Oklahoma | 0.2% | ||
| 37 | Nebraska | 1,920,076 | 37 | Rhode Island | 0.2% | ||
| 38 | West Virginia | 1,815,857 | 38 | Kansas | 0.2% | ||
| 39 | Idaho | 1,716,943 | 39 | Pennsylvania | 0.1% | ||
| 40 | Hawaii | 1,427,538 | 40 | New Mexico | 0.1% | ||
| 41 | New Hampshire | 1,342,795 | 41 | New York | 0.1% | ||
| 42 | Maine | 1,335,907 | 42 | Vermont | 0.0% | ||
| 43 | Rhode Island | 1,059,639 | 43 | Connecticut | 0.0% | ||
| 44 | Montana | 1,050,493 | 44 | North Dakota | 0.0% | ||
| 45 | Delaware | 961,939 | 45 | Louisiana | 0.0% | ||
| 46 | South Dakota | 869,666 | 46 | Mississippi | 0.0% | ||
| 47 | North Dakota | 755,393 | 47 | Hawaii | -0.1% | ||
| 48 | Alaska | 739,795 | 48 | Alaska | -0.2% | ||
| 49 | District of Columbia | 693,972 | 49 | Illinois | -0.3% | ||
| 50 | Vermont | 623,657 | 50 | West Virginia | -0.7% | ||
| 51 | Wyoming | 579,315 | 51 | Wyoming | -1.0% | ||
| Total U.S. | 325,719,178 | 0.7% | |||||
Data source: U.S. Census Bureau.
Table: ConstructConnect.
In Canada, two out of every five residents live in Ontario.
Ontario’s population makes up nearly 40% of the Canadian total. Quebec accounts for a little less than 25%.
There are similar large population blocs in the U.S. The South is almost 40% of the total America figure and the West is just under one-quarter.
While California has a higher population count than Texas (i.e., 39.5 million versus 28.3 million), the latter is beating the former in annual increments.
Texas added 400,000 residents in the past year to California’s extra 240,000. (Florida was in second place with 328,000 more citizens from mid-2016 to mid-2017.)
At +400,000 per annum, Texas is elevating its population count with astonishing speed.
The latest year’s total U.S. population increase was +2.3 million. It’s the South (+1.0% annually) and the West (also +1.0%) where the major gains are occurring. The Northeast (+0.2%) and Midwest (+0.3%) are dragging their feet.
In Canada, before the 2014 collapse in energy prices, Alberta (at +2.0% per annum or more) habitually led provincial population gains.
Now, however, it’s Ontario (+1.6%) and Manitoba (+1.5%) that are in the forefront. P.E.I. (+1.8%) is also a frontrunner with respect to percentage gain, but it has a low population base.
Canada’s latest annual population climb was +470,000. Between two-thirds and three-quarters of Canada’s increase each year comes from net immigration.
The latest U.S. net foreign migration number was +1.1 million.
Going forward, the Trump administration in Washington wants to significantly curb immigration. Taking the opposite stance is one of the core principles of the Trudeau government in Ottawa.
Canada – Provincial Population Growth Rates
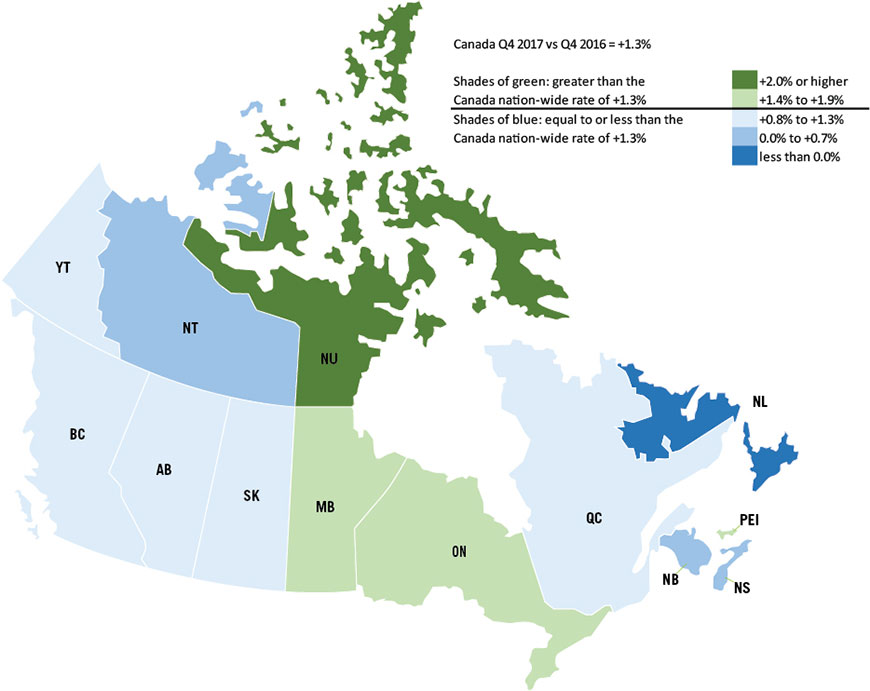
Data source: Statistics Canada.
Graphic: ConstructConnect.
Table 2: Canada Provinces – Population
| Rank | Level (Q4 2017) | Rank | % Change (Q4 17 vs Q4 16) | ||||
| 1 | Ontario | 14,279,196 | 1 | Nunavut | 2.6% | ||
| 2 | Quebec | 8,425,996 | 2 | Prince Edward Island | 1.8% | ||
| 3 | British Columbia | 4,841,078 | 3 | Ontario | 1.6% | ||
| 4 | Alberta | 4,306,039 | 4 | Manitoba | 1.5% | ||
| 5 | Manitoba | 1,343,371 | 5 | Yukon | 1.3% | ||
| 6 | Saskatchewan | 1,168,057 | 6 | British Columbia | 1.3% | ||
| 7 | Nova Scotia | 957,600 | 7 | Alberta | 1.3% | ||
| 8 | New Brunswick | 760,868 | 8 | Saskatchewan | 1.3% | ||
| 9 | Newfoundland & Lab. | 528,430 | 9 | Quebec | 1.0% | ||
| 10 | Prince Edward Island | 152,784 | 10 | Northwest Territories | 0.7% | ||
| 11 | Northwest Territories | 44,718 | 11 | Nova Scotia | 0.7% | ||
| 12 | Yukon | 38,669 | 12 | New Brunswick | 0.3% | ||
| 13 | Nunavut | 38,243 | 13 | Newfoundland & Lab. | -0.4% | ||
| Total Canada | 36,885,049 | 1.3% | |||||
Data source: Statistics Canada.
Table: ConstructConnect.


Recent Comments