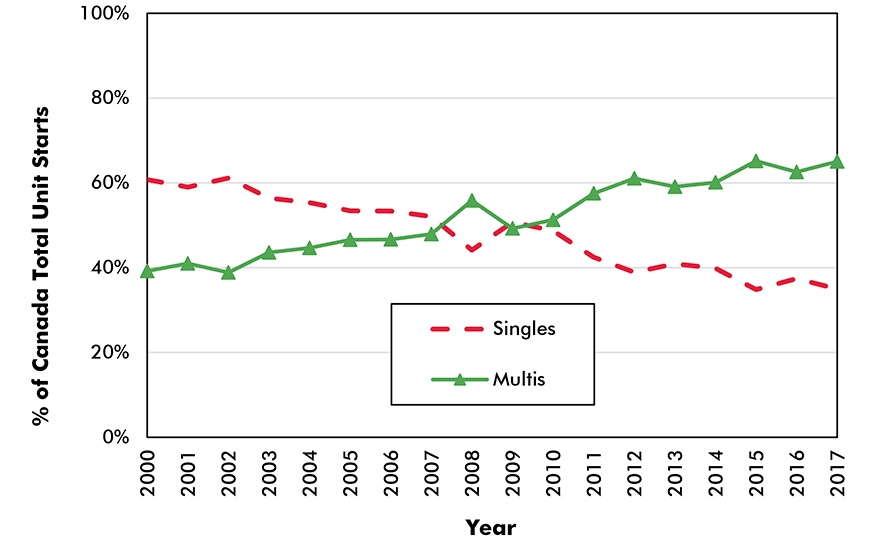
As can be seen in Graph 1, there has been a dramatic shift in the composition of Canada’s total housing starts since the door opened on the 21st century.
From the early 1980s through the early 2000s, single-family structures consistently accounted for about 60% of annual Canadian residential groundbreakings.
Multi-family structures comprised only 40% of the total. (The percentages are based on housing starts expressed in units.)
Since 2002, however, the relationship has flipped over. In 2017, multi-unit starts made up 65% of Canada’s total unit starts and singles were only 35% of the sum.
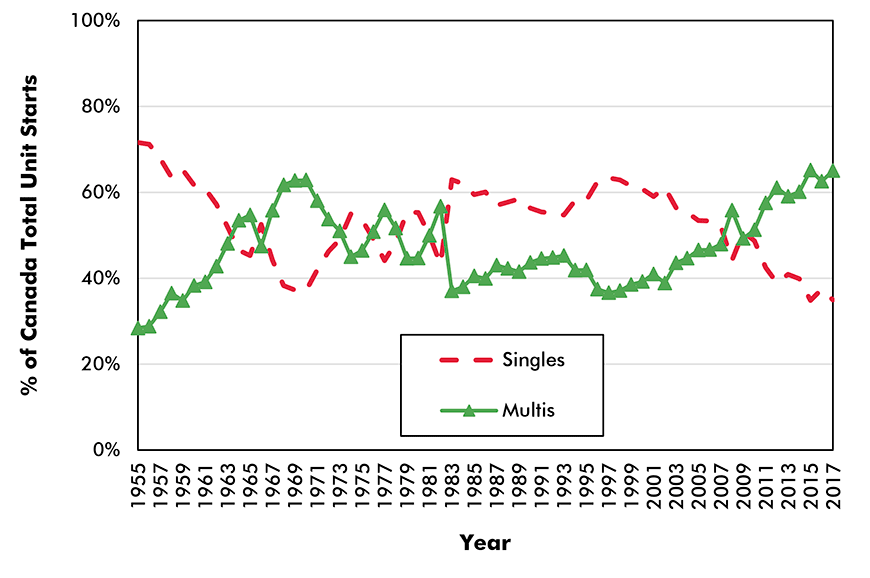
There have been other times in the history of Canada Mortgage and Housing Corporation (CMHC)’s statistics when similar large proportion-changes have occurred. In the mid-1950s (i.e., from Graph 2), the ratio of singles to multis was approximately 70% to 30%. Fifteen years later, in 1970, thanks to rapid urbanization, the ratio almost reversed to 40% for singles and 60% for multis.
Then, between 1971 and the early 1980s, there were several years when the ratios fluctuated close to equilibrium (50%-50%). By 1983, however, the market had reverted to 60% for singles and 40% for multis.
But over the past 15 years, the proportions have tumbled upside down once again, with multiples now at 60% and singles at 40%.
Graph 1: Singles vs Multiples as % of Total Housing Starts – Canada
Data source: Statistics Canada – Cansim Table: 027-0009.
Chart: ConstructConnect.
Graph 2: Singles vs Multiples as % of Total Housing Starts – Canada
Data source: Statistics Canada – Cansim Table: 027-0009.
Chart: ConstructConnect.
The question to be answered in the years ahead is, “Will the current dominance of the multi-family market continue to prevail?” There are several arguments to suggest otherwise.
Traditionally, strong employment and income growth, such as are prevalent now, provide more of a lift to single-family purchases as opposed to multis. There are currently outstanding jobs prospects in Canada. The national unemployment rate is at a 40-year low.
Also, the millennial generation is entering a key age demographic. As many millennials find their first meaningful, higher-paying jobs and begin forming families and raising children, they are expected to move out of rental accommodations in favor of homes in the suburbs, just as their parents and grandparents did before them.
As for Canadian housing starts in general, though, there are numerous forces working against unbridled optimism. Interest rates are moving upwards and the already-existing debt of many households is formidable.
New rules have been implemented requiring financial institutions to take a harder line in their mortgage approvals. Additionally, in British Columbia and Ontario, foreign buyers wishing to buy residential property must pay a penalty tax.
There will also be an ongoing sense of unease about the overall economic prospects for Canada while there is the possibility that the Trump Administration may withdraw from NAFTA.
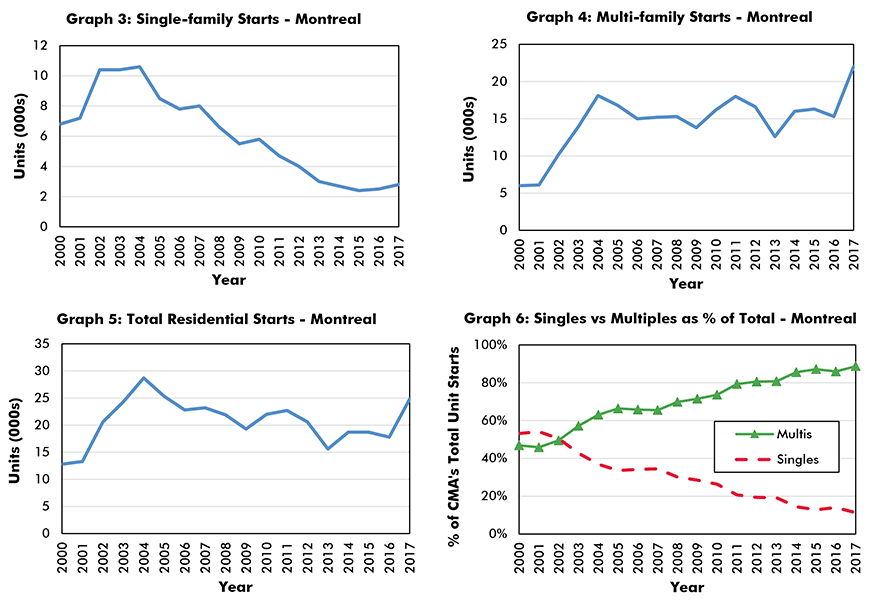
Graphs 3 through 14 set out the 2000-2017 history of housing starts in Canada’s three most populous cities.
Montreal’s single-family starts have been on a long slide downwards, although they have managed slight upticks in the latest two years. Multi-family starts oscillated around 15,000 units per year from 2003 to 2016, but soared in 2017.
Montreal is finally seeing the kind of booming condo market that has long been evident in Toronto and Vancouver.
Montreal Residential Starts
Data source: Statistics Canada – Cansim Table: 027-0009.
Chart: ConstructConnect.
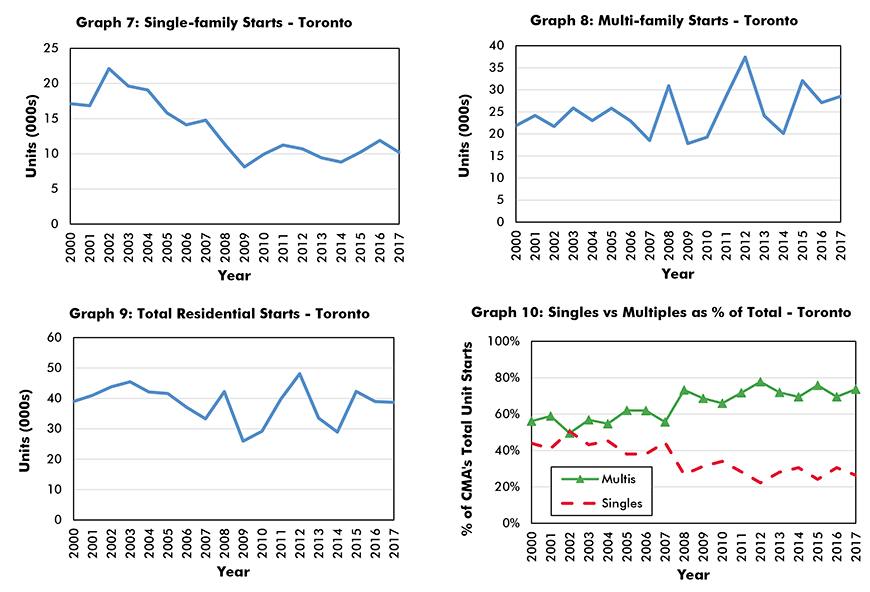
Toronto’s single-family starts fell by more than half between 2002 and 2009. They have since stayed relatively flat, at about 10,000 units per year.
Despite Toronto’s reputation for strong condominium construction, the annual starts level for multi-family units in the city has shown considerable volatility over the past ten years, swinging between 20,000 units annually and 35,000 units.
Toronto’s total home starts reached a record high in 2012, at just under 50,000 units. To put that rip-roaring level in context, it was two-thirds of the Ontario figure and it was more than any other provincial total in that year.
Toronto Residential Starts
Data source: Statistics Canada – Cansim Table: 027-0009.
Chart: ConstructConnect.
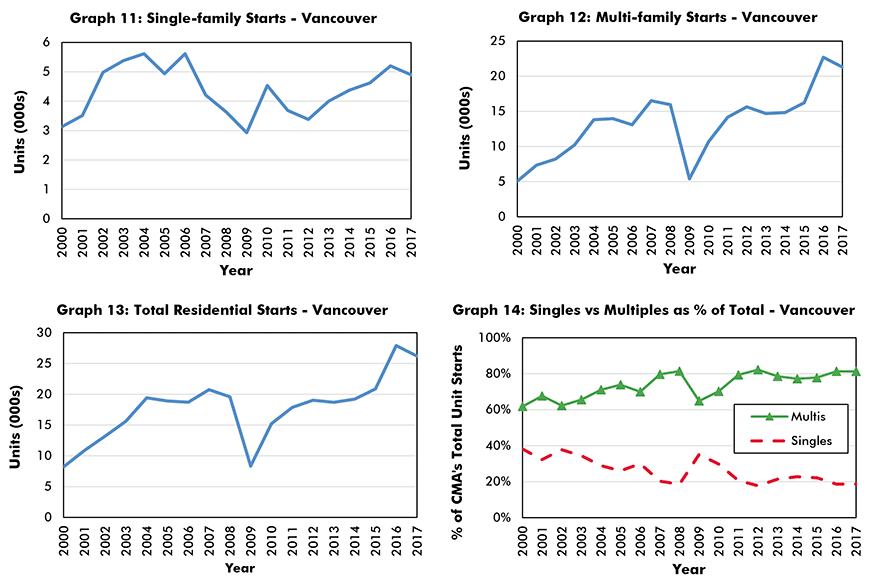
Vancouver, where the supply of land available for development is thought to be in shorter supply than in any other major city in Canada– i.e., due to river and ocean barriers, plus the proximity of a lovely-to-look-at but difficult and expensive to live on mountain range – single-family starts long-term have stayed at a steady, albeit low, level.
Multi-family starts in Vancouver scaled a new height in 2016, and climbed down from that peak only slightly in 2017.
Vancouver Residential Starts
Data source: Statistics Canada – Cansim Table: 027-0009.
Chart: ConstructConnect.
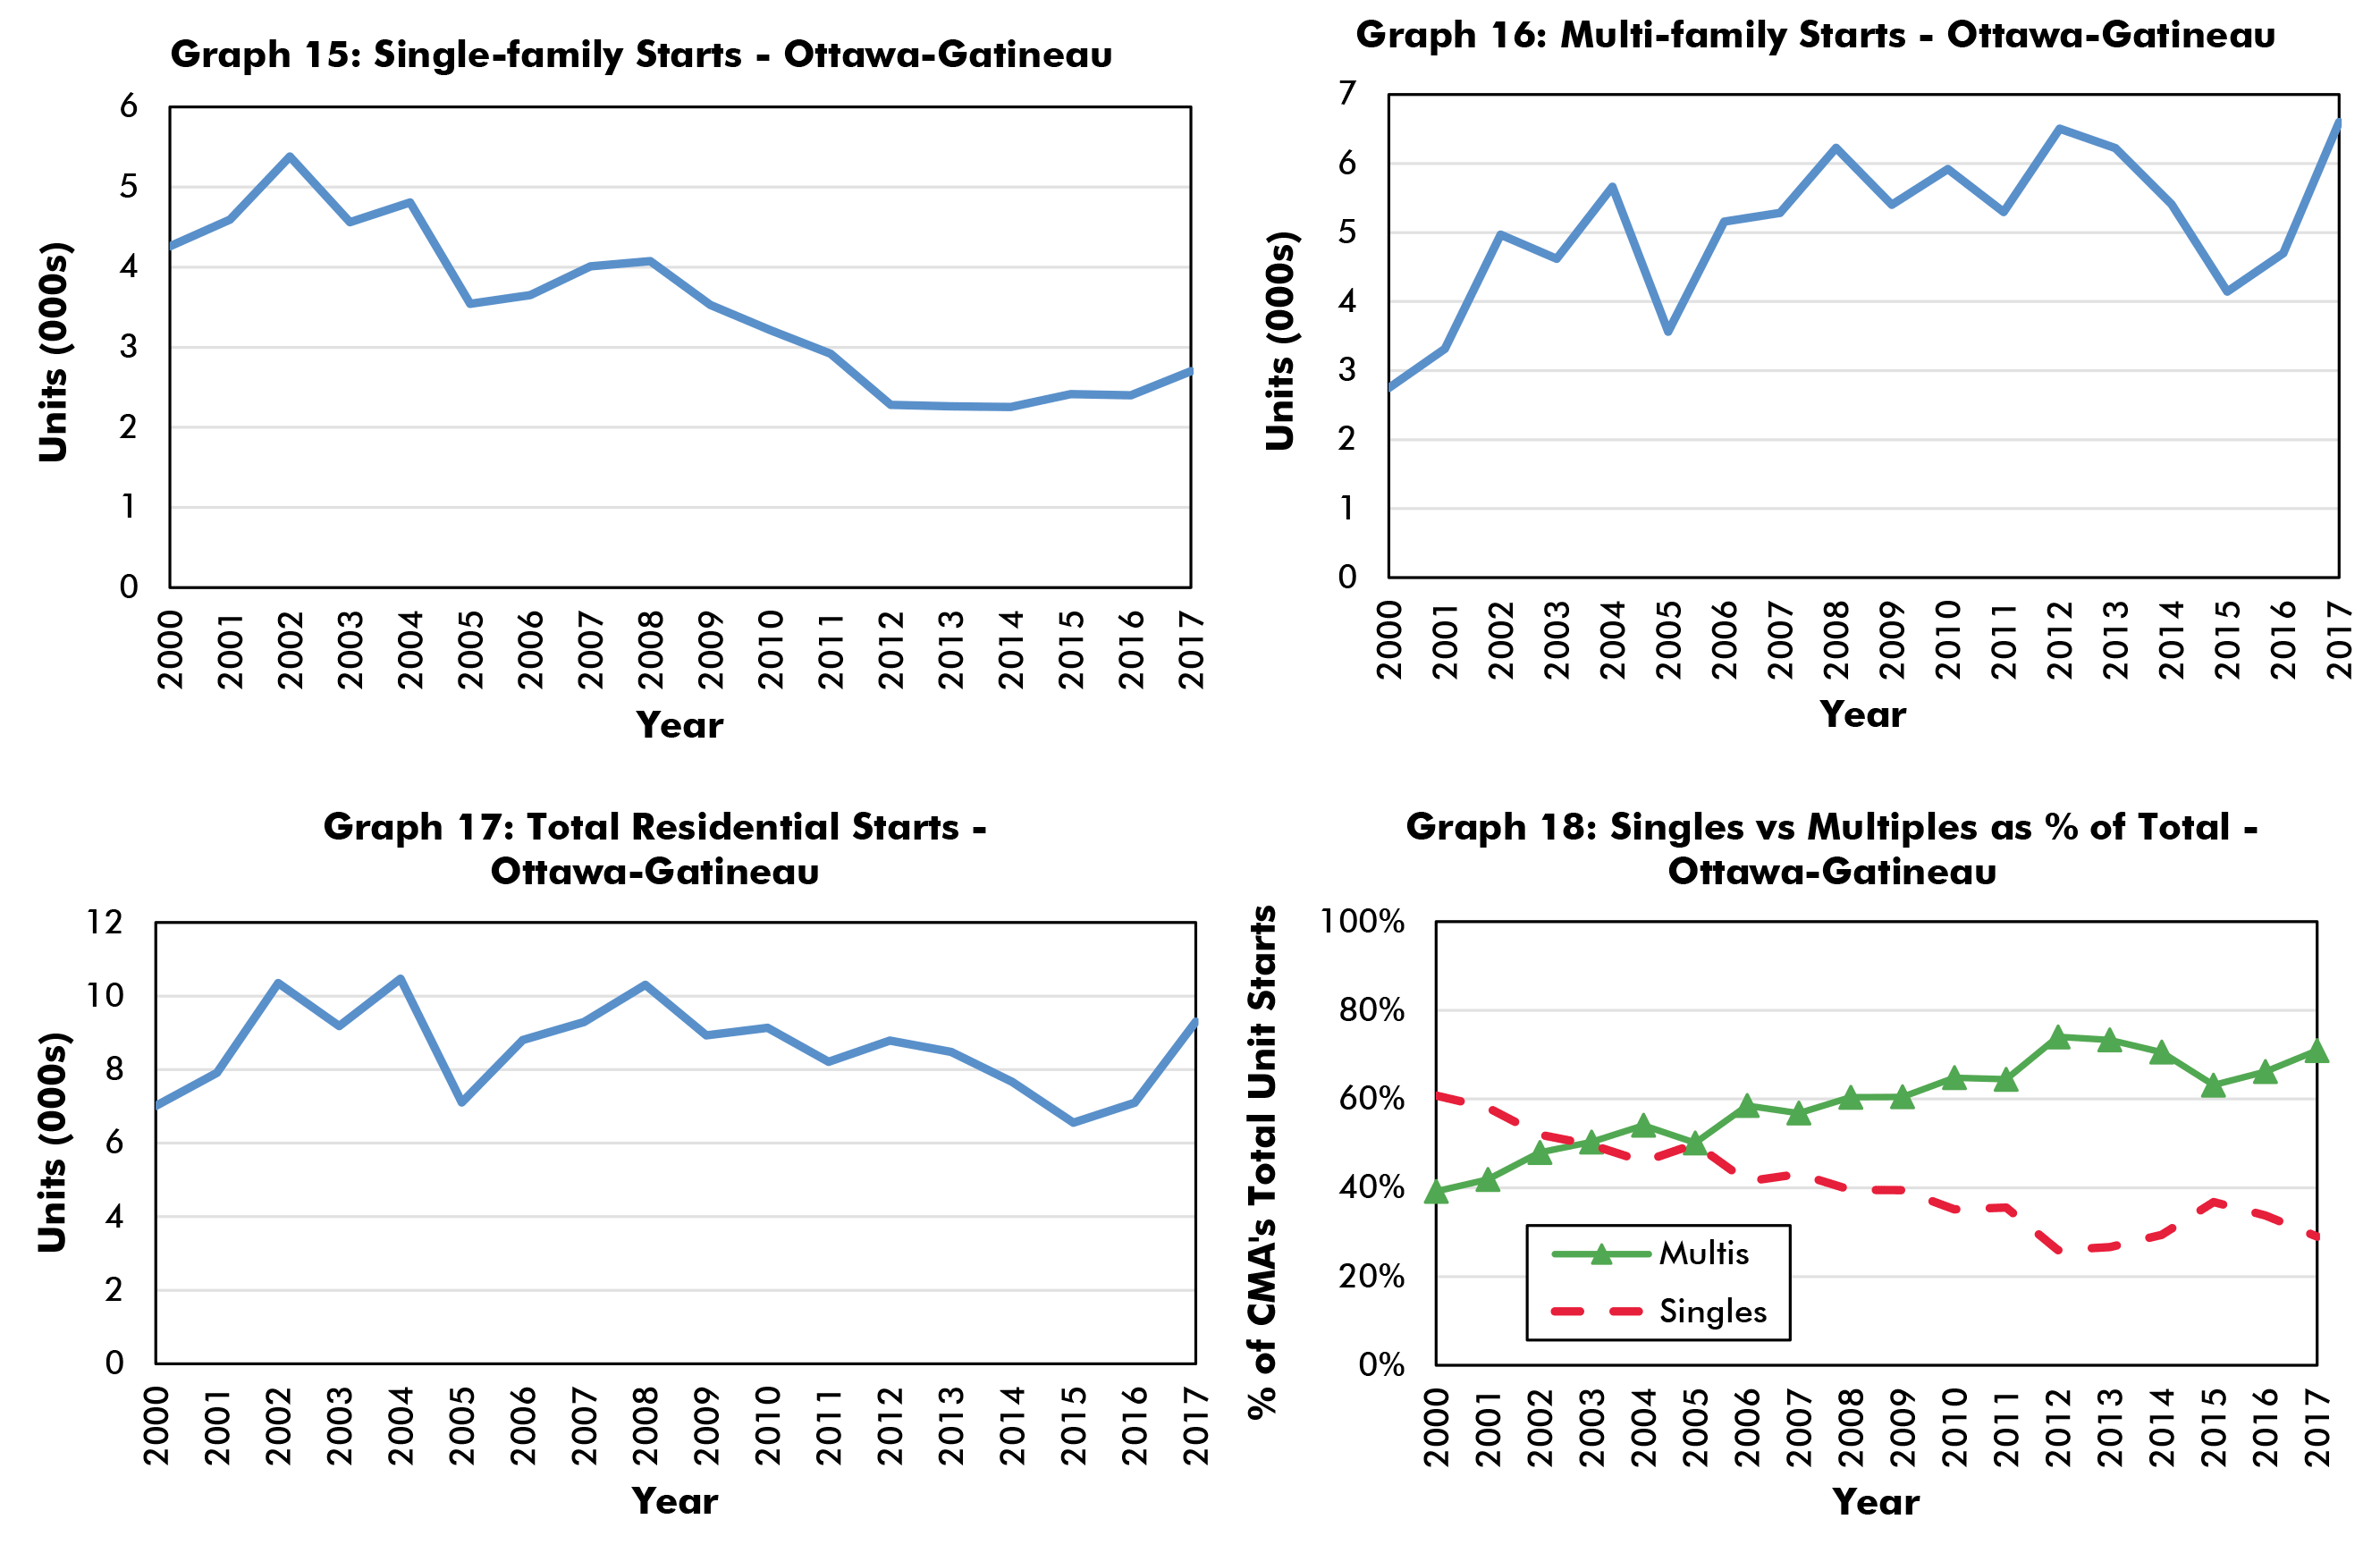
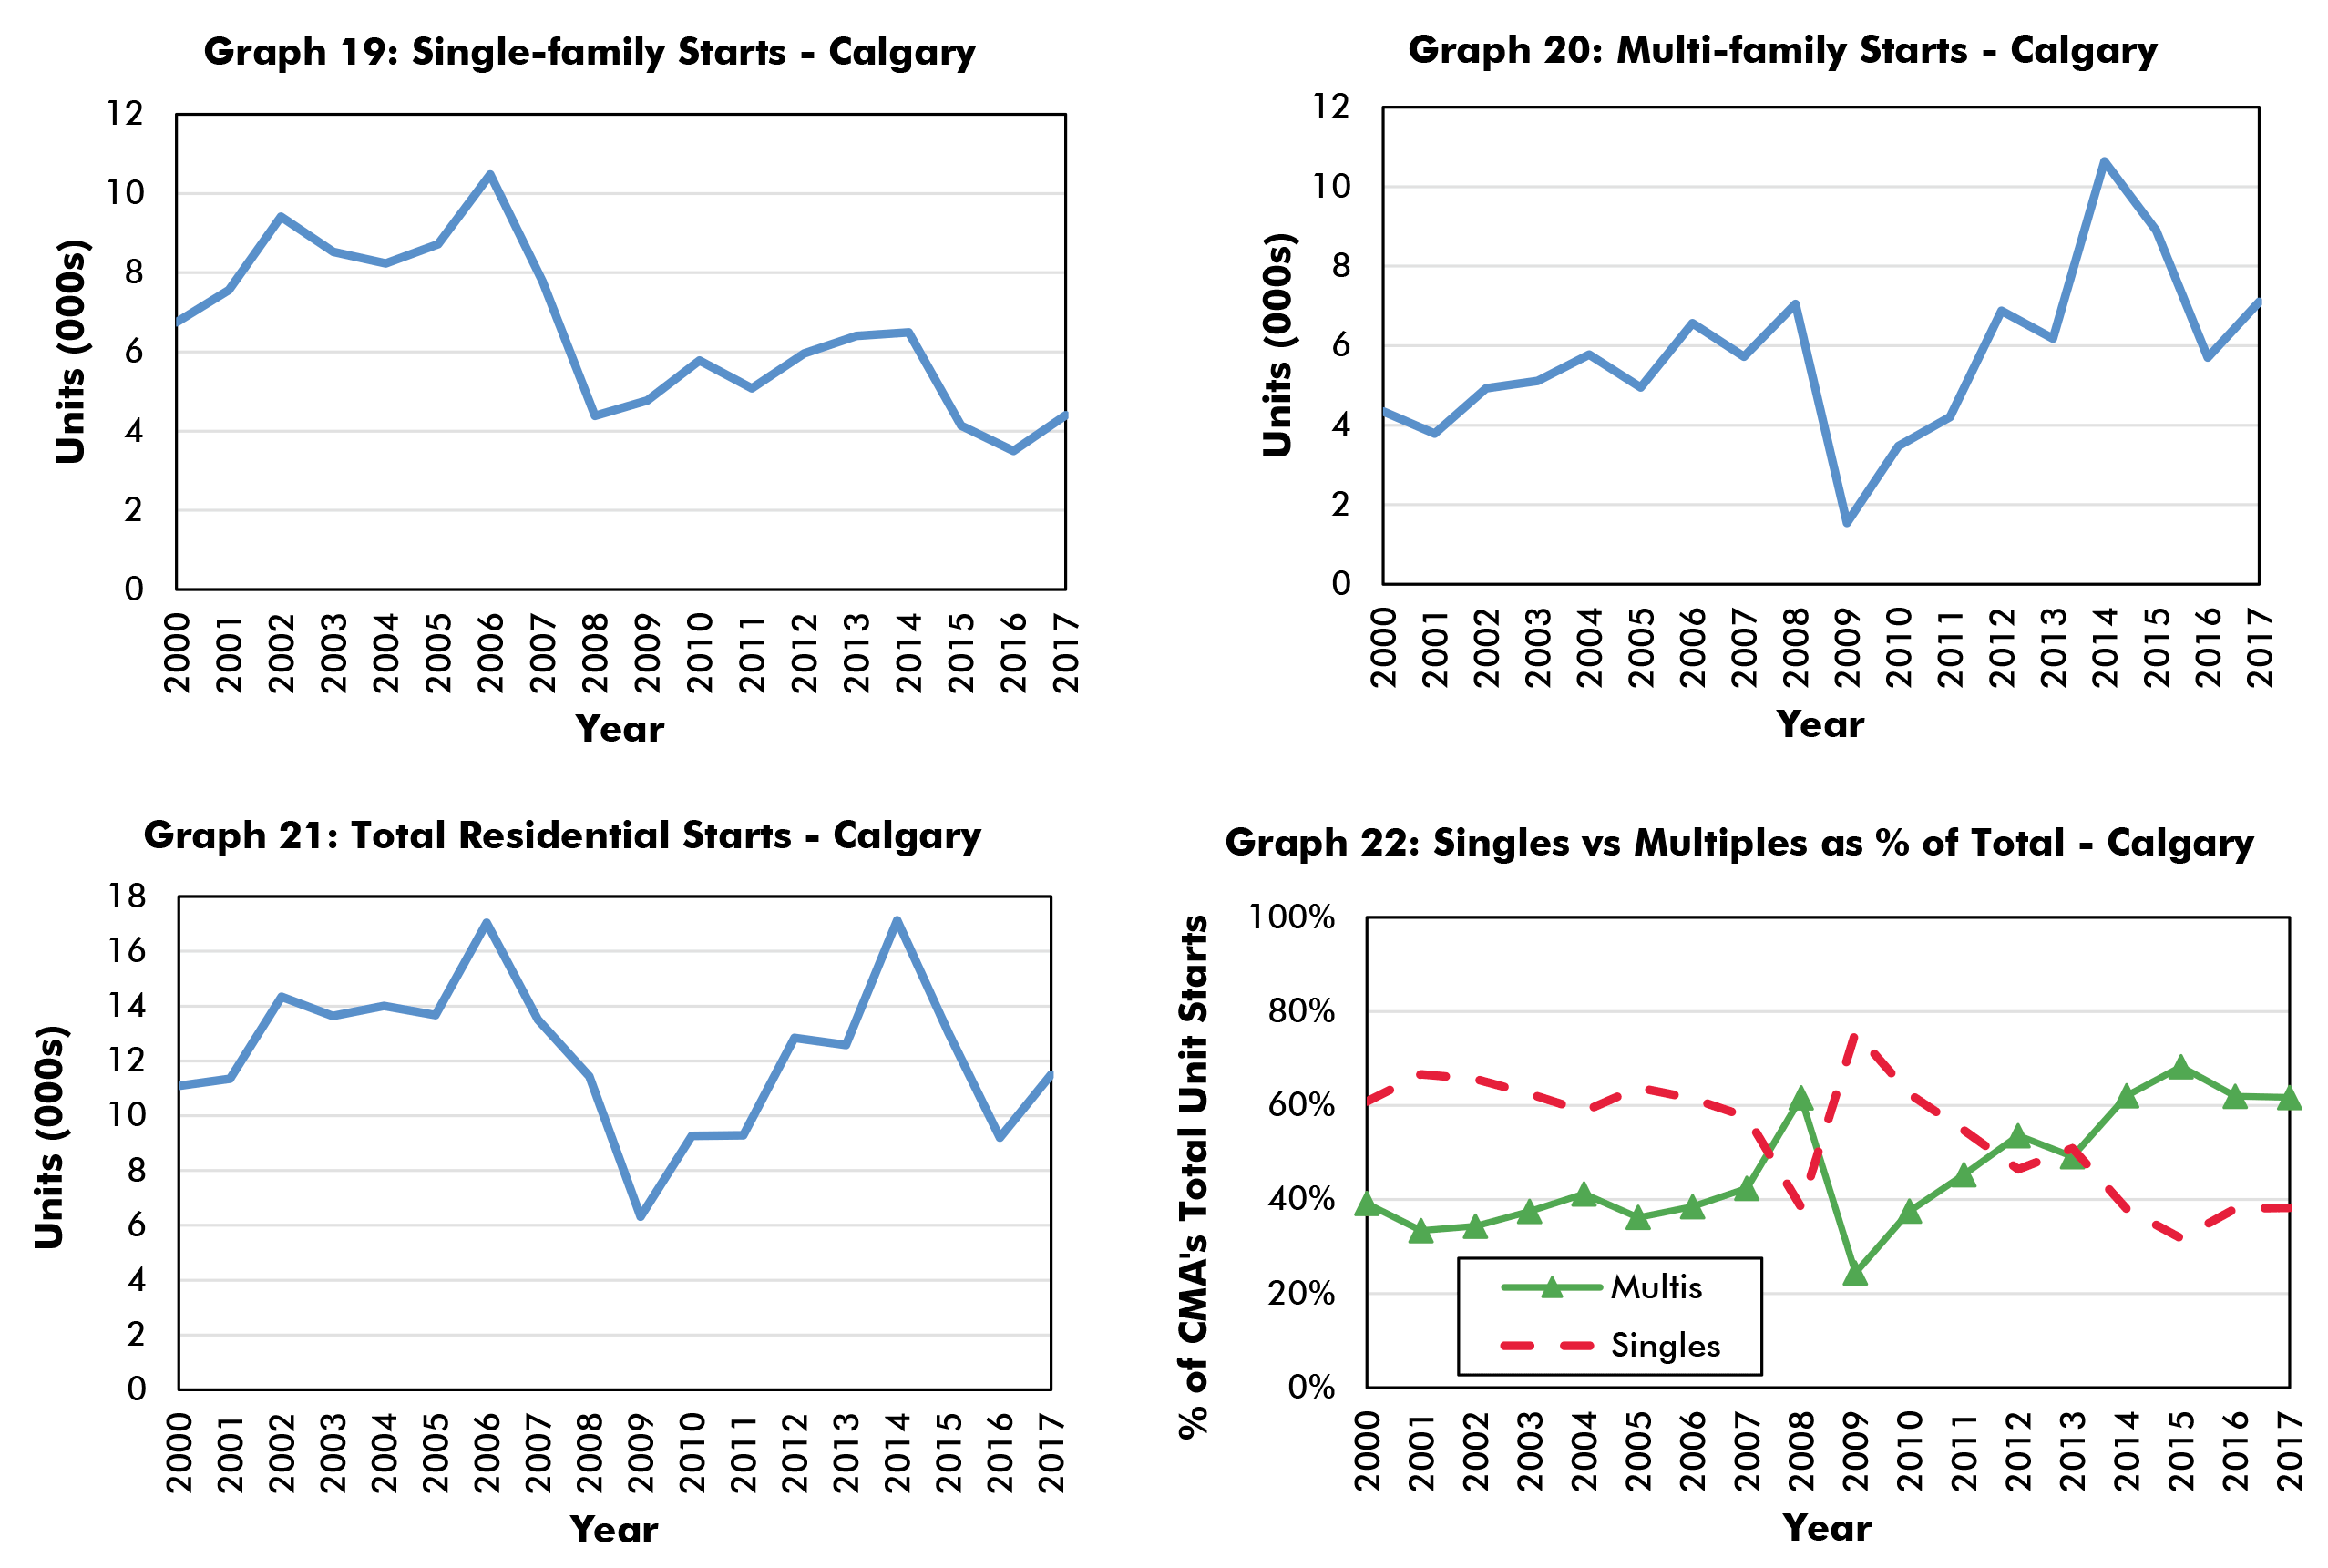
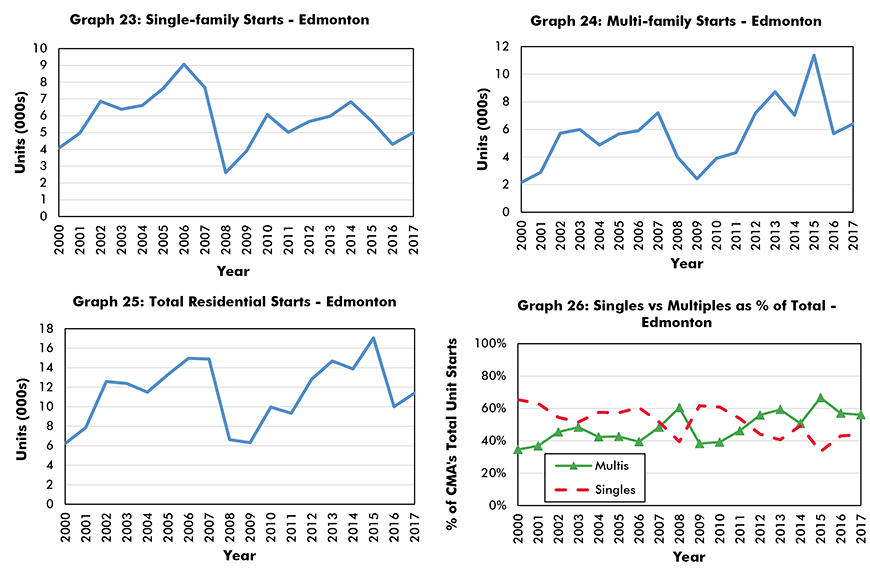
Ottawa-Gatineau has exhibited the same widening split for multiples versus singles (i.e., as a percent of total) that has been seen in Montreal, Vancouver and Toronto. But Calgary and Edmonton have experienced moments of balance at times within the last dozen years.
Ottawa-Gatineau Residential Starts
Data source: Statistics Canada – Cansim Table: 027-0009.
Chart: ConstructConnect.
Calgary Residential Starts
Data source: Statistics Canada – Cansim Table: 027-0009.
Chart: ConstructConnect.
Edmonton Residential Starts
Data source: Statistics Canada – Cansim Table: 027-0009.
Chart: ConstructConnect.
Table 1 records the shares of total starts taken by multiples for each of Canada’s six biggest cities, expressed as 2000 to 2017 averages; 2010 to 2017 averages; and for standalone 2017.
In 2017, Montreal (88.7%) was the Canadian city where multi-unit starts claimed the largest share of total starts. Indeed, almost all new housing construction in Montreal in 2017 was of the multi-unit variety.
Vancouver (81.3%) took second place, with Toronto (73.6%) in third. Next in line were Ottawa-Gatineau (71.0%), Calgary (61.7%) and Edmonton (56.1%).
As a final interesting observation, Toronto’s multi-unit starts as a percentage of total Canada multi-unit starts in 2017 was 20.5%. Montreal and Vancouver weren’t far behind, with shares of 15.9% and 15.3% respectively.
Adding together the Toronto, Montreal and Vancouver shares reveals that those three cities, all on their own, accounted for more than half (51.7%) of Canada’s total multi-units starts in 2017.
Table 1: Multiple Unit Starts as % of Total Starts
| 2000 to | 2010 to | ||
| 2017 Avg | 2017 Avg | 2017 | |
| Montreal | 70.2% | 82.7% | 88.7% |
| Ottawa-Gatineau | 59.3% | 68.5% | 71.0% |
| Toronto | 65.2% | 72.0% | 73.6% |
| Calgary | 46.0% | 55.0% | 61.7% |
| Edmonton | 48.2% | 53.9% | 56.1% |
| Vancouver | 73.7% | 78.5% | 81.3% |
Data source: Statistics Canada – Cansim Table: 027-0009.
Chart: ConstructConnect.


Recent Comments
comments for this post are closed