From the turn of the century until the present, there have been nearly 20 years during which the age of both the general population and Canada’s workforce have been climbing.
The impetus behind this shift in age structure has been the exceptional level of births that occurred after the Second World War – i.e., the much-ballyhooed post-WW II baby boom generation.
The most striking years for abnormally strong baby-boomer births occurred from 1946 through 1964.
In the labour force data calculated by Statistics Canada, ‘older workers’ are specified as being 55 years of age and over. (The U.S. Census Bureau likewise adopts a 55-plus designation for its older-worker cohort.)
Entering the foregoing information into a couple of simple mathematical equations yields some fascinating findings.
(A) The first wave of baby boomers reached age 55 in 2001 (i.e., 1946 + 55 = 2001).
(B) The last baby boomers will become aged 55 in 2019 (i.e., 1964 + 55 = 2019).
Before setting out the conclusions to be drawn from these results, however, more research needs to be discussed.
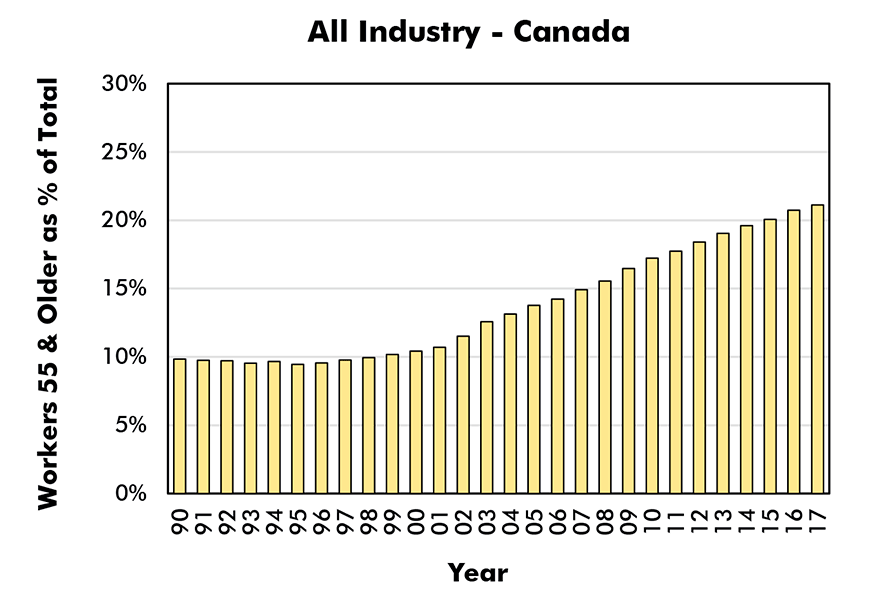
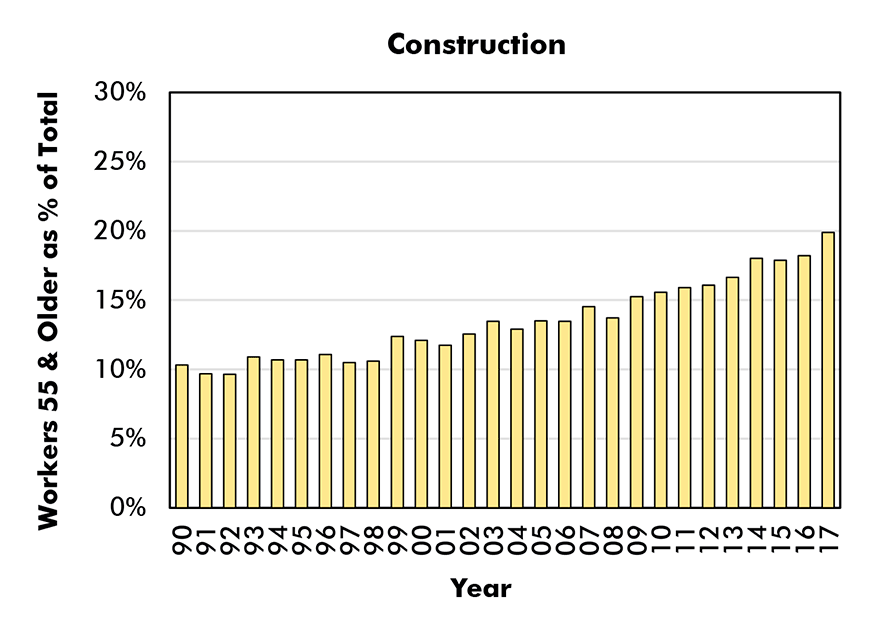
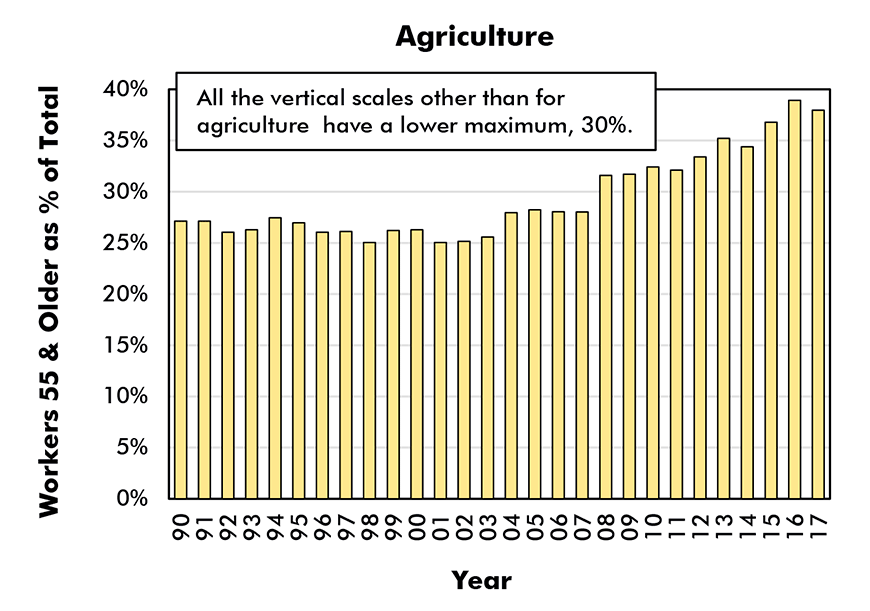
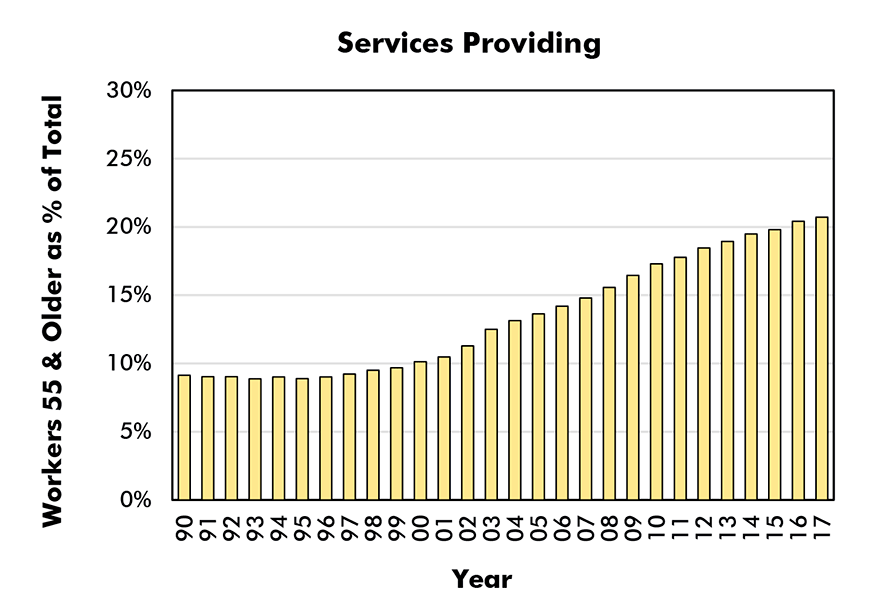
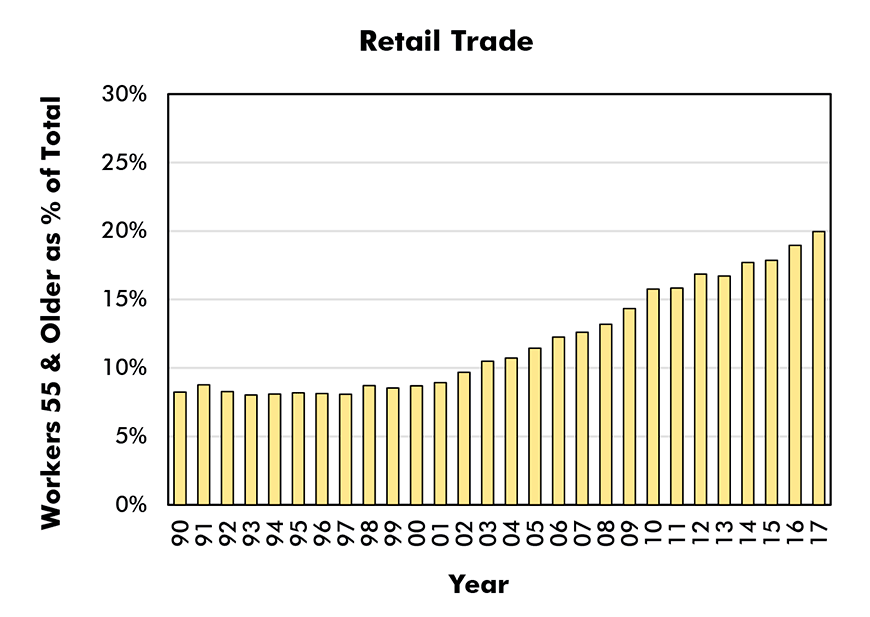
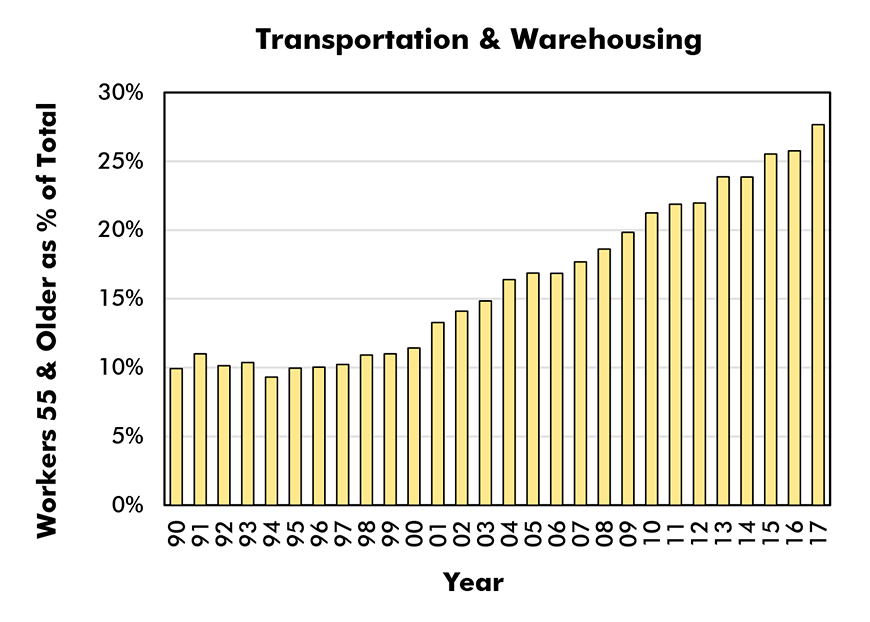
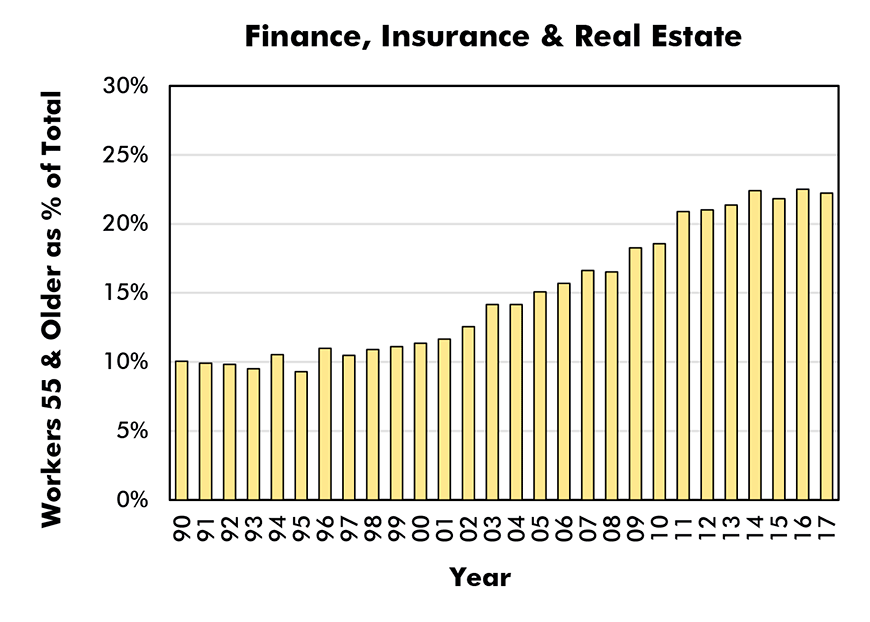
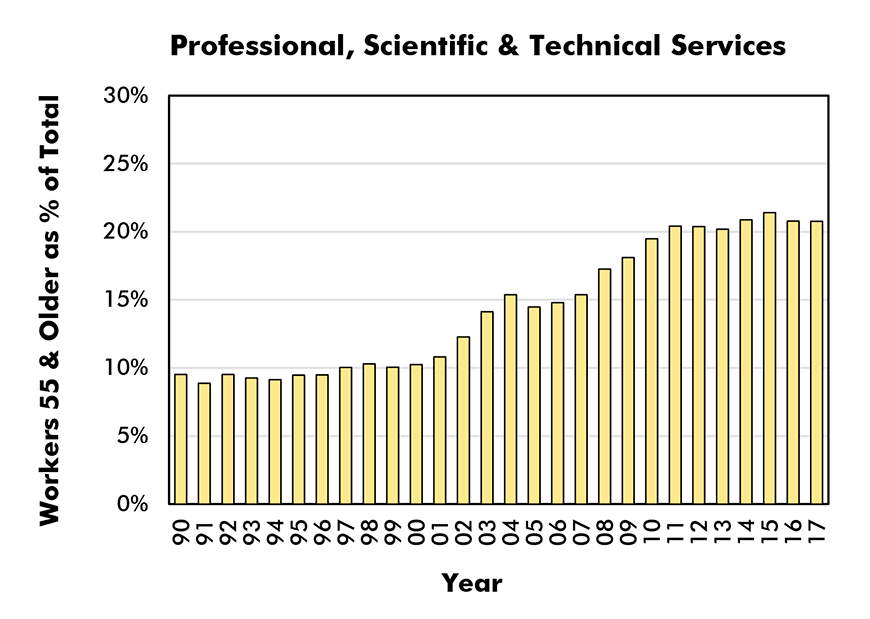
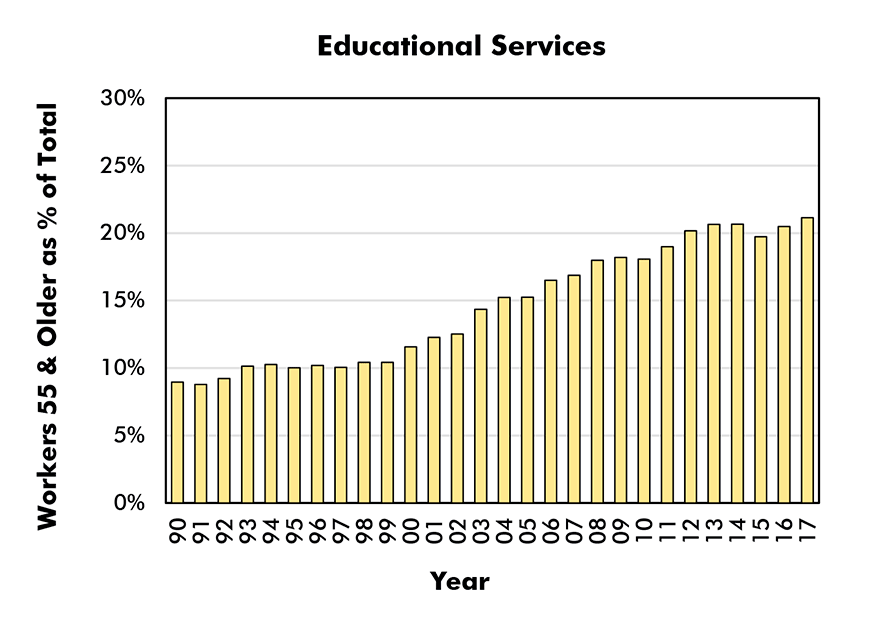
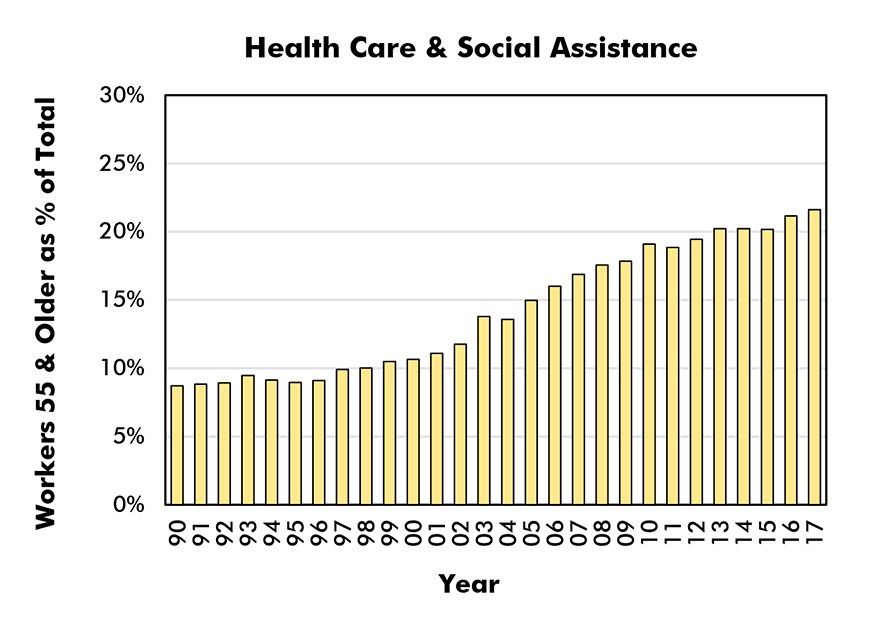
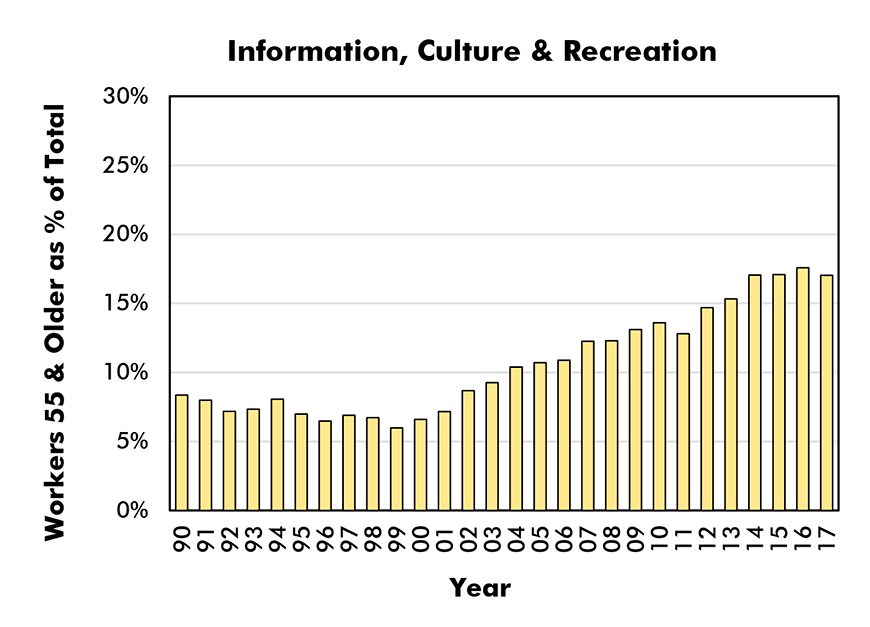
Included with this commentary are 17 vertical bar charts showing the aged-55-plus cohort as a proportion of the total employee pool industry-wide and for sub-sectors, for each year from 1990 to 2017.
In all the charts, and as might be surmised from point (A) above, the lift-off of the aged-55-plus proportion occurred in the early 2000s. After all, 2001 was when the vanguard of the baby boomer generation crossed the 55-years-of-age threshold.
The construction sector, having long faced shortages in some key skilled trades, has been especially attuned to the advantages of retaining experienced workers.
Therefore, executives in the construction sector have grown accustomed to thinking of their industry as having an out-sized number of older workers.
As is readily apparent from Graphs 1 to 17, however, there are hardly any pockets of the economy where the age of workers has not skewed higher over the past 17 years.
Graph 1: Aged 55 & Older as % of Total Employment in Sector
(Male and Female)
Data source: Statistics Canada Cansim Table 282-0008.
Chart: ConstructConnect.
Graph 2: Aged 55 & Older as % of Total Employment in Sector
(Male and Female)
Data source: Statistics Canada Cansim Table 282-0008.
Chart: ConstructConnect.
Graph 3: Aged 55 & Older as % of Total Employment in Sector
(Male and Female)
Data source: Statistics Canada Cansim Table 282-0008.
Chart: ConstructConnect.
Graph 4: Aged 55 & Older as % of Total Employment in Sector
(Male and Female)
Data source: Statistics Canada Cansim Table 282-0008.
Chart: ConstructConnect.
Graph 5: Aged 55 & Older as % of Total Employment in Sector
(Male and Female)
Data source: Statistics Canada Cansim Table 282-0008.
Chart: ConstructConnect.
Graph 6: Aged 55 & Older as % of Total Employment in Sector
(Male and Female)
Data source: Statistics Canada Cansim Table 282-0008.
Chart: ConstructConnect.
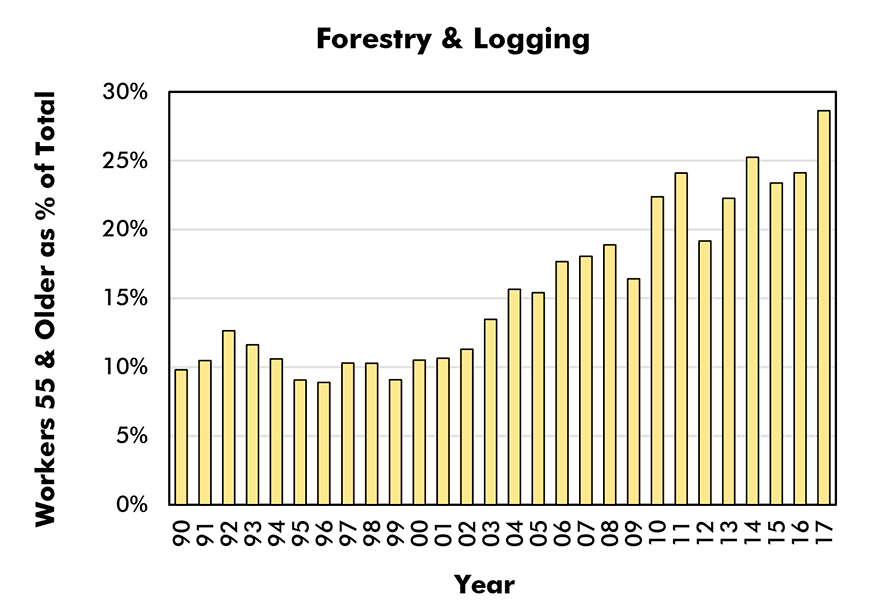
Graph 7: Aged 55 & Older as % of Total Employment in Sector
(Male and Female)
Data source: Statistics Canada Cansim Table 282-0008.
Chart: ConstructConnect.
Graph 8: Aged 55 & Older as % of Total Employment in Sector
(Male and Female)
Data source: Statistics Canada Cansim Table 282-0008.
Chart: ConstructConnect.
Graph 9: Aged 55 & Older as % of Total Employment in Sector
(Male and Female)
Data source: Statistics Canada Cansim Table 282-0008.
Chart: ConstructConnect.
Graph 10: Aged 55 & Older as % of Total Employment in Sector
(Male and Female)
Data source: Statistics Canada Cansim Table 282-0008.
Chart: ConstructConnect.
Graph 11: Aged 55 & Older as % of Total Employment in Sector
(Male and Female)
Data source: Statistics Canada Cansim Table 282-0008.
Chart: ConstructConnect.
Graph 12: Aged 55 & Older as % of Total Employment in Sector
(Male and Female)
Data source: Statistics Canada Cansim Table 282-0008.
Chart: ConstructConnect.
Graph 13: Aged 55 & Older as % of Total Employment in Sector
(Male and Female)
Data source: Statistics Canada Cansim Table 282-0008.
Chart: ConstructConnect.
Graph 14: Aged 55 & Older as % of Total Employment in Sector
(Male and Female)
Data source: Statistics Canada Cansim Table 282-0008.
Chart: ConstructConnect.
Graph 15: Aged 55 & Older as % of Total Employment in Sector
(Male and Female)
Data source: Statistics Canada Cansim Table 282-0008.
Chart: ConstructConnect.
Graph 16: Aged 55 & Older as % of Total Employment in Sector
(Male and Female)
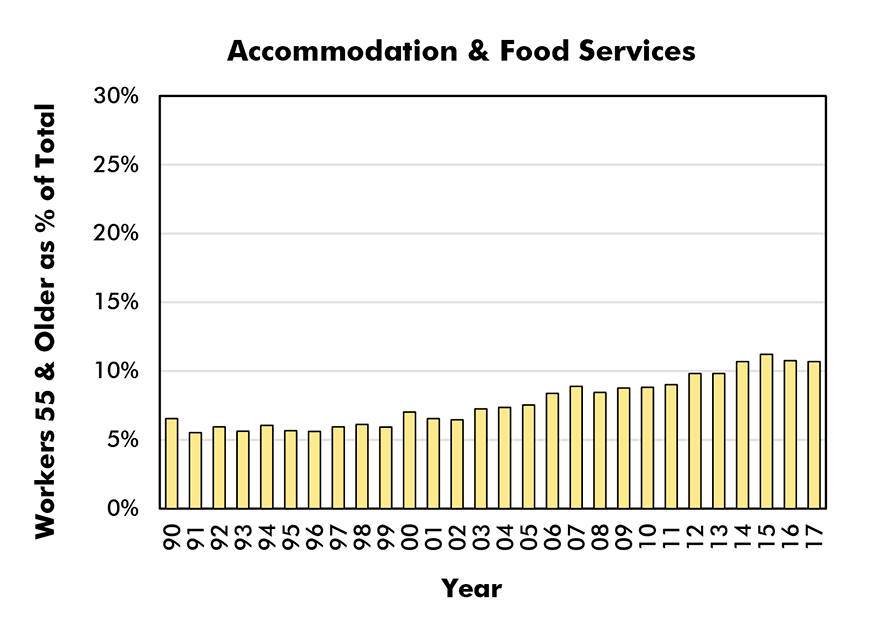
Data source: Statistics Canada Cansim Table 282-0008.
Chart: ConstructConnect.
Graph 17: Aged 55 & Older as % of Total Employment in Sector
(Male and Female)
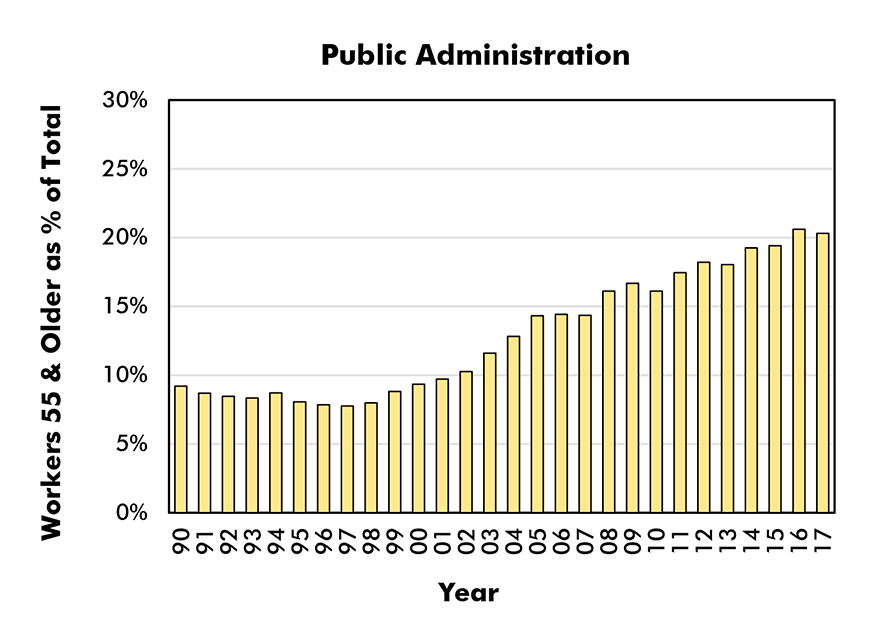
Data source: Statistics Canada Cansim Table 282-0008.
Chart: ConstructConnect.
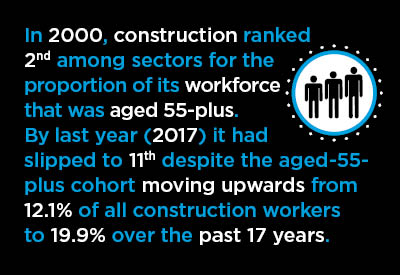
Table 1 adds further confirmation. Whereas in 2000, construction ranked second among sectors for the proportion of its workforce that was aged 55-plus, by last year (2017) it had slipped to eleventh.
Table 1: Workers Aged 55 & Older as % of Total Workers in Sector
| 2000 | ||||
| 1 | Agriculture | 26.3% | ||
| 2 | Construction | 12.1% | ||
| 3 | Educational Services | 11.6% | ||
| 4 | Transportation & Warehousing | 11.4% | ||
| 4 | Finance, Insurance & Real Estate | 11.4% | ||
| 6 | Health Care & Social Assistance | 10.7% | ||
| 7 | Forestry & Logging | 10.5% | ||
| 8 | Professional, Scientific & Technical Services | 10.2% | ||
| 9 | Public Administration | 9.3% | ||
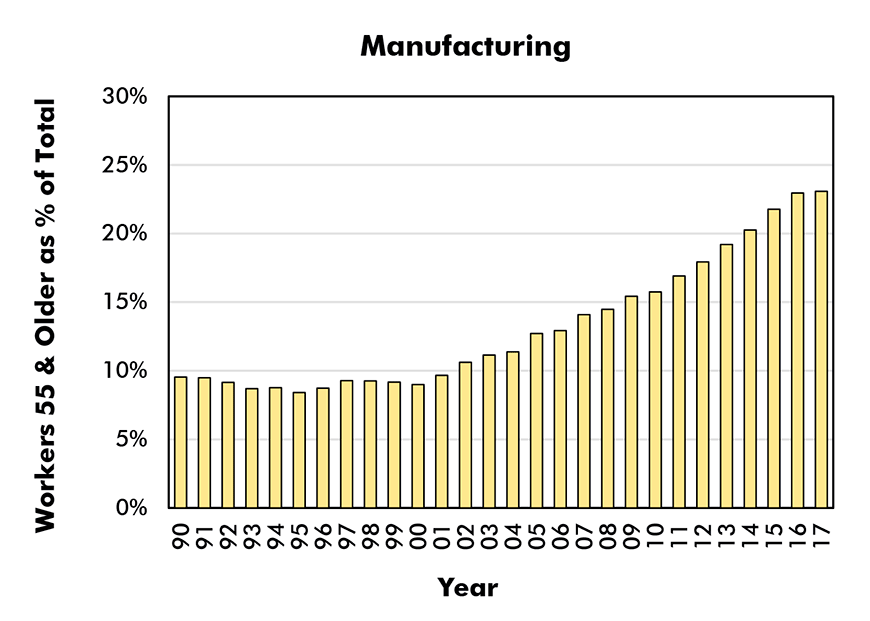
| 10 | Manufacturing | 9.0% | ||
| 11 | Retail Trade | 8.7% | ||
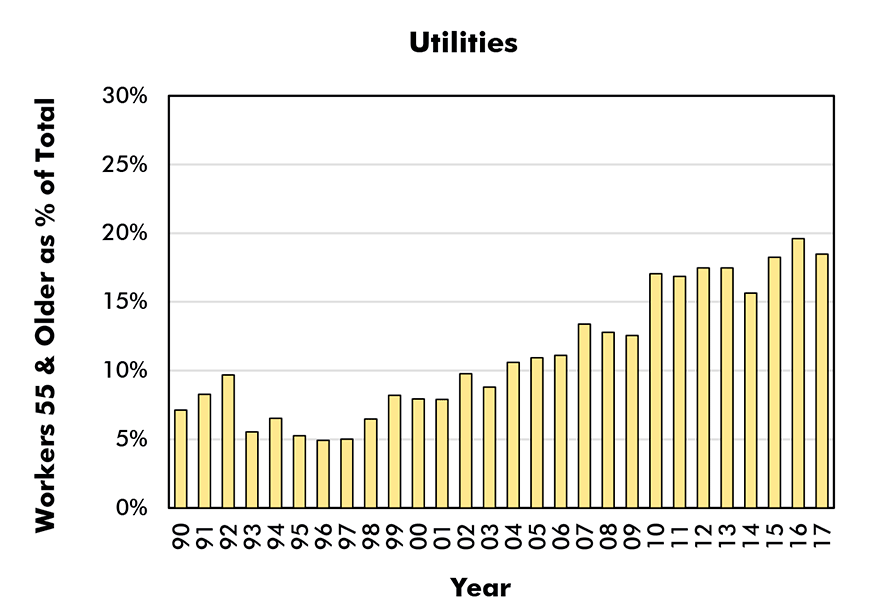
| 12 | Utilities | 7.9% | ||
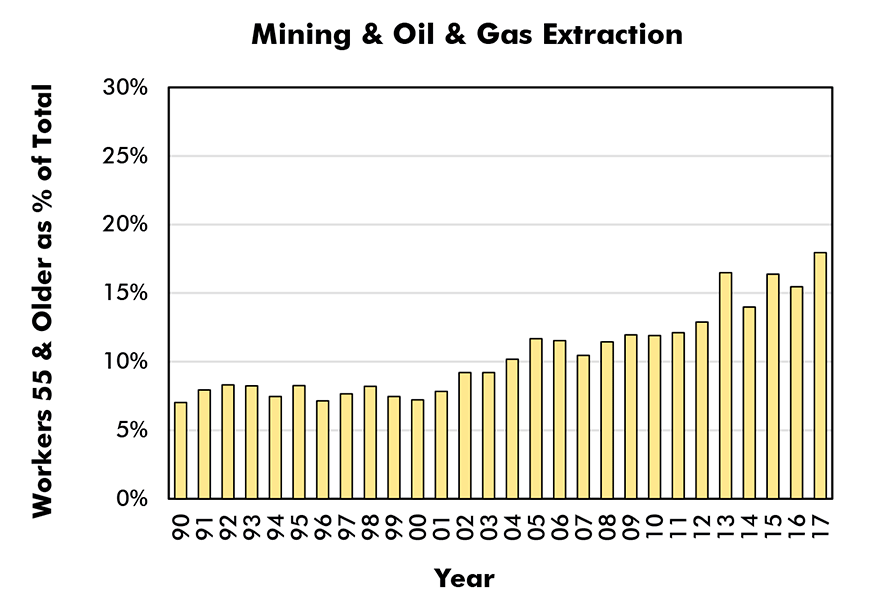
| 13 | Mining & Oil & Gas Extraction | 7.2% | ||
| 14 | Accommodation & Food Services | 7.0% | ||
| 15 | Information, Culture & Recreation | 6.6% | ||
| Services Providing | 10.1% | |||
| All Industry | 10.4% | |||
| 2017 | ||||
| 1 | Agriculture | 38.0% | ||
| 2 | Forestry & Logging | 28.6% | ||
| 3 | Transportation & Warehousing | 27.7% | ||
| 4 | Manufacturing | 23.1% | ||
| 5 | Finance, Insurance & Real Estate | 22.2% | ||
| 6 | Health Care & Social Assistance | 21.6% | ||
| 7 | Educational Services | 21.1% | ||
| 8 | Professional, Scientific & Technical Services | 20.8% | ||
| 9 | Public Administration | 20.3% | ||
| 10 | Retail Trade | 20.0% | ||
| 11 | Construction | 19.9% | ||
| 12 | Utilities | 18.5% | ||
| 13 | Mining & Oil & Gas Extraction | 17.9% | ||
| 14 | Information, Culture & Recreation | 17.0% | ||
| 15 | Accommodation & Food Services | 10.7% | ||
| Services Providing | 20.7% | |||
| All Industry | 21.1% | |||
Data source: Statistics Canada Cansim Table 282-0008.
Table: ConstructConnect.
The decline in position occurred despite the aged-55-plus cohort moving upwards from 12.1% of all construction workers to 19.9% over the past 17 years.
In 2017, there were 10 industry sub-sectors with higher aged-55-plus proportions than construction, including: agriculture (38.0%); ‘forestry and logging’ (28.6%); ‘transportation and warehousing’ (27.7%); manufacturing (23.1%); ‘finance, insurance and real estate’ (22.2%); ‘health care and social assistance’ (21.6%); and ‘educational services’ (21.1%).
Whereas the 12.1% share for aged-55-plus workers in construction in 2000 was higher than the 10.1% for services-providing workers and the 10.4% for all-industry workers, by 2017 the relationships had reversed.
In 2017, construction’s 19.9% share for aged-55-plus workers was less than the 20.7% for services-providing workers and less than the 21.1% for all-industry workers.
‘Agriculture’ has consistently been the sector with the highest proportion of aged-55-plus workers. Furthermore, its already-high 26.3% figure in 2000 shot up to 38.0% in 2017.
‘Forestry and logging’ has been the sector exhibiting the biggest upsurge in its aged-55-plus proportion, moving from a modest 10.5% in 2000 to a lofty 28.6% in 2017.
At the opposite end of the age-structure spectrum has been the ‘accommodation and food services’ sector. It has remained a young person’s game. In 2000, aged-55-plus individuals working in hotels and restaurants/bars comprised only 7.0% of the sector’s total workforce. During the intervening years, that proportion has increased only marginally, to 10.7% in 2017.
What does the future hold?
This is where the second mathematical equation, (B) (i.e., 1964 + 55 = 2019), becomes so important.
The tail end of the baby boomer brigade will reach age 55 in 2019.
From 2020 on, each new year will still see increases to the aged-55-plus cohort, but there will no longer be the extra-special push provided by the baby boomer generation.
Baby boomers will long continue to affect other aspects of the economy, such as the demand for seniors’ housing, but that’s another story.
The proportion of older workers in the total workforce will continue to stay elevated through the early 2020s. Retention of experienced workers remains an important goal for many corporations.
Also, there are many older workers who, for a variety of reasons (e.g., out of financial necessity and/or to stay sharp mentally) will want to ‘keep on trucking’.
But the 55-plus contingent as a proportion of the total must inevitably begin to ease. And from 2025 on, the process of diminishment will speed up, due to the hopefully-gradual onset of declining-health and/or waning-energy issues. (As on offshoot, the media is already picking up on the term ‘retirement bubble’.)
The younger workers who are being funneled into the workforce at the starting gate of the employment zipline see the world quite differently than their predecessors.
As they have been growing up, it has become second nature for them to utilize smart phones, tablets, data streaming, 3-D imaging (e.g., virtual reality) and a lengthy list of other ‘tools’ only ever previously imagined in science fiction.
Workplace processes will need to change to accommodate their preferences.
Furthermore, as the younger generation advances further into management, they will be the ones authorizing what comes next.
It may seem as if the pace of technological innovation has been incredibly swift so far.
To date, however, a slight edge has been taken off the mad dash forward by the presence of older employees in the workforce.
By the mid-2020s, that restraint will have largely dissipated and employers − including those in construction − will need to totally embrace the digital tsunami.


Recent Comments
comments for this post are closed