U.S. foreign trade, and more specifically the huge size of America’s deficit in the exchange of ‘goods’ (-$680 billion annualized in January 2018) internationally, has recently become a ‘hot button’ topic for discussion.
The Trump Administration has already imposed new tariffs on some key import products, with indications that there will be more to come.
Besides ‘goods’ trade, there is also ‘services’ trade comprised of transportation, travel*, professional and management consulting fees, architectural and engineering design fees, charges for the usage of intellectual property, etc.
In such areas, the U.S. is almost always in surplus.
More will be written about services trade surpluses later in this article.
‘Goods’ Trade:
Most media and political attention is being focused on the ‘goods’ trade deficit and that’s because the absolute size of the ‘goods’ deficit is four times greater than the ‘services’ surplus. In other words, the ‘services’ trade excess claws back only about one-quarter of the ‘goods’ trade shortfall.
Among the nations of the world, where is the U.S. having most difficulty achieving a ‘goods’ trade balance? Graphs 1 through 6 have been designed to answer that question. They show the history, since 1990, of U.S. export and import dollar volumes (in USDs) with America’s six most important customers and suppliers – Canada, Mexico, China, OPEC nations, Japan and the European Union (EU).
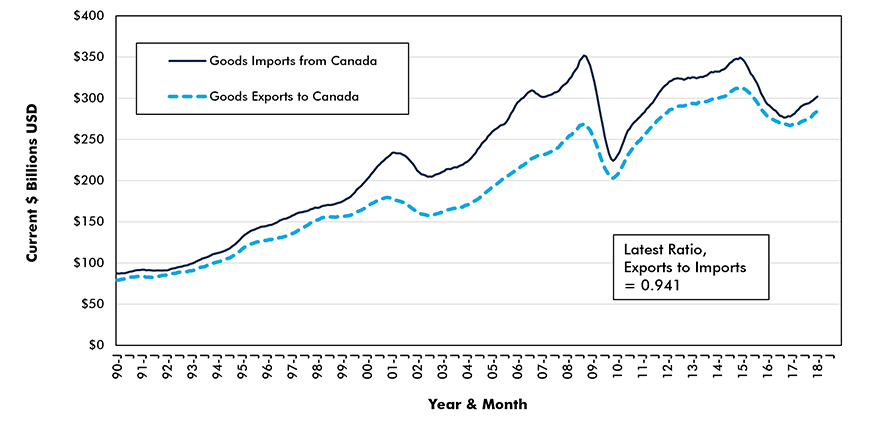
From 2001 through 2008 (Graph 1), Canada ran a substantial ‘goods’ trade surplus with the U.S., sourced mainly in crude oil and natural gas.
An almost whole-hearted adoption of hydraulic fracturing in the U.S. since the Great Recession in 2008-09, has greatly reduced that energy dependency. In the last couple of years, the U.S. goods trade deficit with Canada has nearly disappeared.
The current ‘goods trade ratio’ of 0.941 that the U.S. has with its northern neighbor – calculated as exports to Canada divided by imports from Canada – is quite close to the 1.0 figure that would signify balance.
Graph 1: U.S. Merchandise Trade with Canada
(12-month moving totals − placed in latest month)
Data source: U.S. Bureau of Economic Analysis (BEA)
Chart: ConstructConnect.
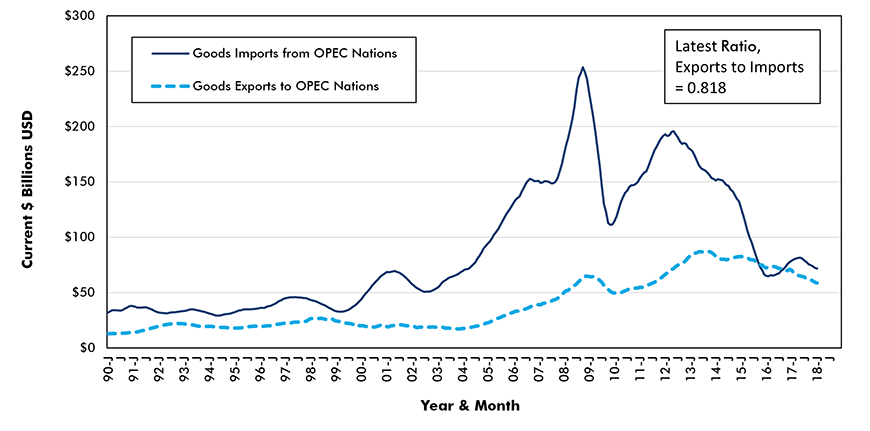
Graph 2 shows the enormous gap that opened in goods trade between the U.S. and OPEC nations lasting for a dozen years from mid-2003 to mid-2015. But again, U.S. extraction of fossil fuels from shale rock has diminished the need for imports from the Middle East and elsewhere among OPEC members.
The U.S. ‘goods trade ratio’ with OPEC countries crossed above 1.0 in early 2016. It has since retreated to 0.818, but that still leaves it not too far out of balance. (U.S. monthly goods trade with Saudi Arabia is now often on an even par.)
Graph 2: U.S. Merchandise Trade with OPEC Nations
(12-month moving totals − placed in latest month)
Data source: U.S. Bureau of Economic Analysis (BEA)
Chart: ConstructConnect.
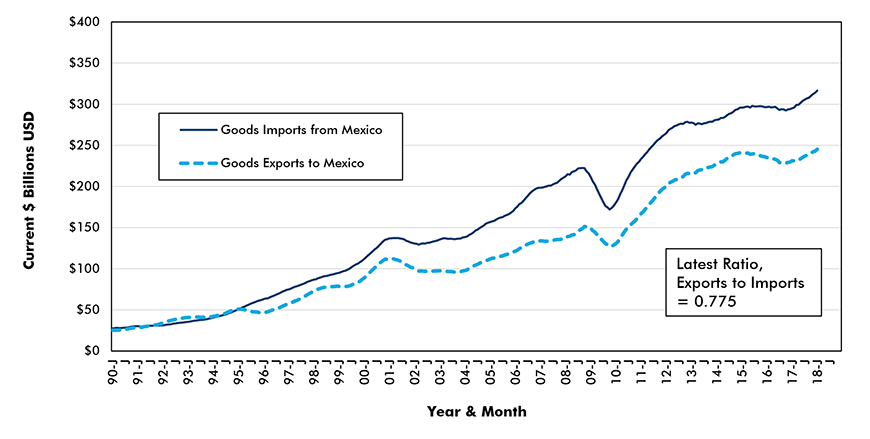
U.S. goods trade with its other NAFTA partner Mexico (Graph 3) has been deteriorating gradually since 1995. The NAFTA agreement between the U.S., Canada and Mexico, came into effect in 1994. The ‘goods trade ratio’ with Mexico presently sits at 0.775.
Graph 3: U.S. Merchandise Trade with Mexico
(12-month moving totals − placed in latest month)
Data source: U.S. Bureau of Economic Analysis (BEA)
Chart: ConstructConnect.
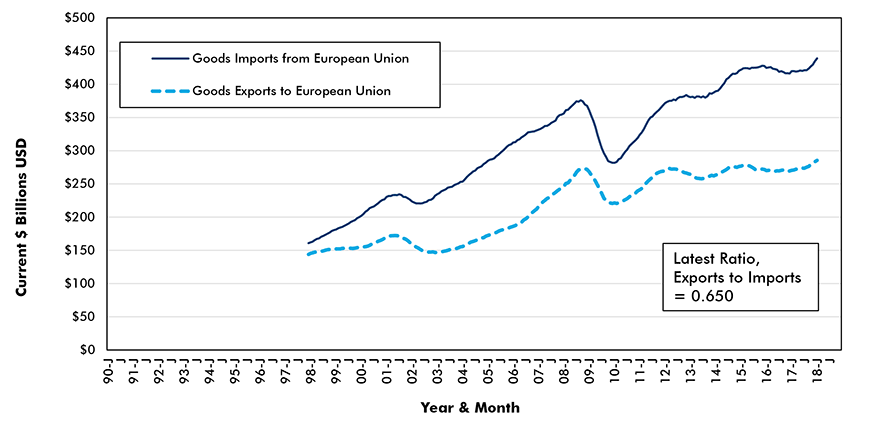
The European Union was launched with the signing of the Maastricht Treaty in 1992. U.S. goods trade with the E.U. (Graph 4) started out approximately in balance. Over the past 20 years, however, a worsening divide has emerged.
Canada has negotiated a Comprehensive and Economic Trade Agreement (CETA) with Europe. After taking first steps in a similar direction a year or so ago, the U.S. has backtracked. (The U.K., post-Brexit, may still be hoping for a special trading relationship with Washington.)
America’s goods trade ratio with the EU is an unfavorable 0.650. Almost half of the U.S.-E.U. trade deficit is with one country, Germany.
Graph 4: U.S. Merchandise Trade with European Union
(12-month moving totals − placed in latest month)
Data source: U.S. Bureau of Economic Analysis (BEA)
Chart: ConstructConnect.
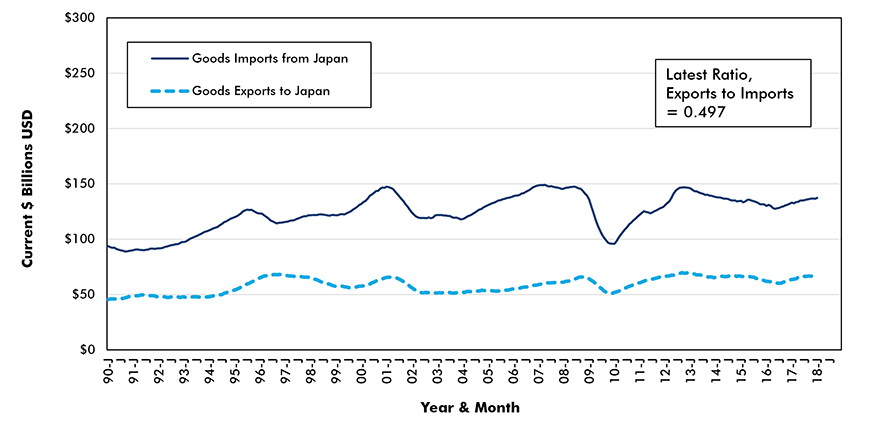
The U.S. goods trade ratio with Japan is a low 0.497. With respect to Japan, the U.S. imports double what it exports. It’s remarkable, though, that the 2-to-1 relationship has held steady for nearly three decades.
Graph 5: U.S. Merchandise Trade with Japan
(12-month moving totals − placed in latest month)
Data source: U.S. Bureau of Economic Analysis (BEA)
Chart: ConstructConnect.
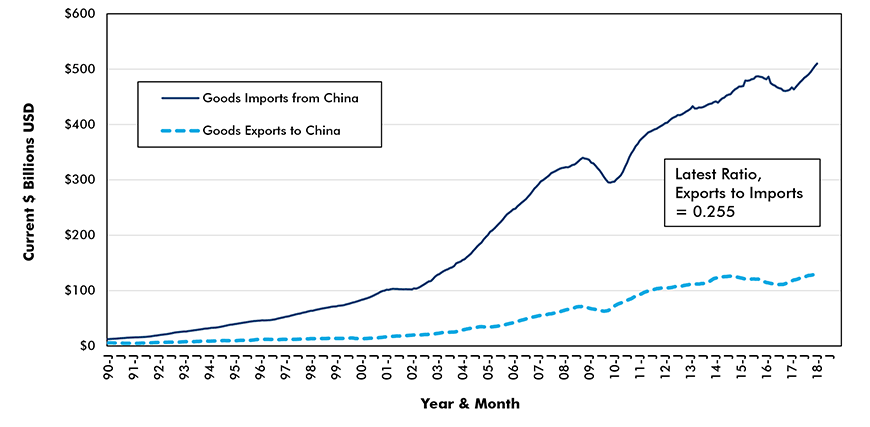
Now we come to the crux of the matter, U.S. goods trade with China. Each month, between 40% and 50% of the entire U.S. goods trade deficit is with China. Graph 6 shows not only the distortion, but also how much more magnified it has become over the years.
Graph 6: U.S. Merchandise Trade with China
(12-month moving totals − placed in latest month)
Data source: U.S. Bureau of Economic Analysis (BEA)
Chart: ConstructConnect.
The latest U.S. goods trade ratio with China is a minimal 0.255. The volume of goods being shipped across the Pacific to the Middle Kingdom by the U.S. is only one-quarter the volume that is moving in the opposite direction.
There is a case to be made, however, that the disparity in goods trade is somewhat exaggerated.
A sizable portion of the imports entering the U.S. from overseas consists of manufactured goods assembled in China on behalf of U.S.-based manufacturers. A primary example is smart phones produced by the likes of Apple Inc.
Furthermore, while Apple’s iPhones may be assembled in China, they are a combination of components made in South Korea, Japan and Taiwan. China’s contribution to the final product is mainly the labor required to connect the interlocking pieces.
There is a body of thought gaining currency in economic circles that in today’s modern world of highly integrated international supply lines, there is a need for an alternative set of trade statistics. Those more revealing numbers should be based on value added.
Issues concerning value-added trade relate more to high-end and/or high-tech items. There’s no escaping the fact that much of America’s goods trade deficit with China results from low-cost consumer purchases. Furthermore, bargain imports from China in such areas as clothing and footwear also serve to suppress the prices charged by competing domestic sources.
Punitive tariffs imposed on Chinese consumer goods imports will place a hardship on many U.S. families and individuals that have come to count on spending only so much on a range of essential and discretionary items to balance their budgets.
‘Services’ Trade:
Let’s now turn to U.S. ‘services’ trade. As previously mentioned, the U.S. usually runs a services trade surplus with its major trading partners.
The 2017 annual balances in ‘goods’ versus ‘services’ trade appear in the Monthly U.S. International Trade in Goods and Services report (Exhibits 20a and 20b) published by the Bureau of Economic Analysis (BEA).
The following figures are on a Balance of Payments (BOP) basis. They differ slightly from the numbers in Graphs 1 to 6, which are on a census-basis. BOP numbers are calculated by the BEA for inclusion in the national accounts. They conform with international definitions used to compile gross domestic product (GDP) results. Census-based numbers originate with documents compiled by the U.S. Customs and Border Protection agency.
With respect to Canada, America’s 2017 goods trade deficit of -$23.2 billion was eliminated by a +$25.9 billion services trade surplus.
With respect to OPEC nations, America’s 2017 goods trade deficit of -$14.3 billion was obliterated by a +$22.5 billion services trade surplus.
With respect to Mexico, America’s 2017 goods trade deficit of -$76.2 billion was barely reduced by a +$7.0 billion services trade surplus.
With respect to the European Union, America’s 2017 goods trade deficit of -$153.0 billion was only partially compensated by a +$51.3 billion services trade surplus.
For Germany within the EU, America’s 2017 goods trade deficit of -$64.6 billion was exacerbated by an additional -$3.0 billion services trade deficit.
In 2017, there were only two other nations besides Germany where the U.S. ran services trade deficits, India (-$5.6 billion) and Italy (-$2.9 billion).
With respect to Japan, America’s 2017 goods trade deficit of -$69.7 billion was alleviated to a minor degree by a +$13.6 billion services trade surplus.
With respect to China, America’s 2017 goods trade deficit of -$376 billion was reduced hardly at all by a +$38.5 billion services trade surplus.
* A travel export arises when a foreign visitor spends money in the U.S. A travel import occurs when an American citizen makes purchases while journeying outside the U.S.


Recent Comments
comments for this post are closed