To the benefit of economic growth and construction activity, Canada has an ace up its sleeve, an extraordinarily rapid rate of population advance. Canada’s population is climbing by +1.4% per annum, which in nominal terms is a gain in resident count of more than half a million. (By comparison, the U.S. annual population growth rate is only half as fast, +0.7%.)
Statistics Canada issues quarterly updates of national and provincial population estimates. Data for cities and census divisions, however, becomes available only once per year.
That moment just recently arrived. Population counts for census metropolitan areas (CMAs), census agglomerations (CA) and census divisions were released on March 28, 2019. CMAs are large cities with sizable downtown ‘cores’ (sheltering at least 50,000 people), and numerous suburban neighborhoods with strong back-and-forth commuting flows. CAs are cities and town that, in population scale, lie between CMAs and rural communities.
While Canada has 36 CMAs, this article will narrow the focus to the nation’s 15 biggest urbanized centers. The latest CMA population estimates are for July 1, 2018. The most interesting findings are revealed in the following four graphs.
Graph 1 − CMA Population Levels:
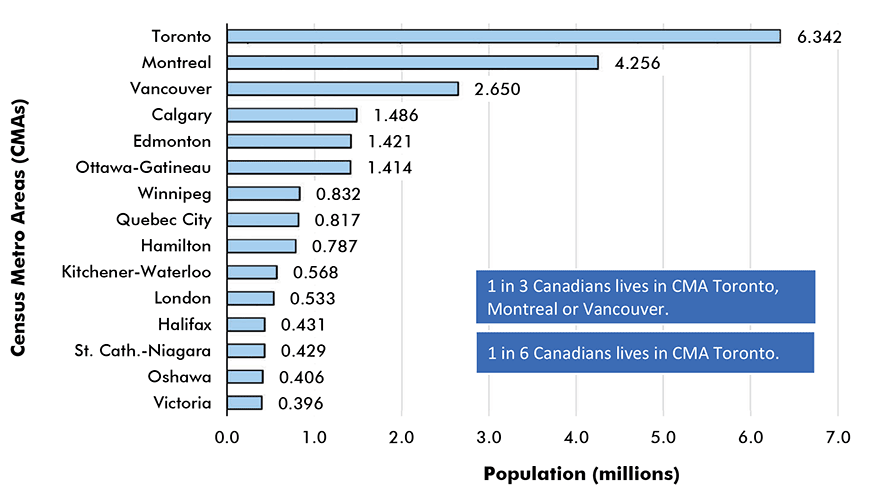
Canada’s total population as of July 1, 2018, was 37.1 million. Of that total, 26.5 million were living in one of the country’s 36 CMAs. Expressing the relationship in simpler terms, seven out of every ten Canadians last summer were residing in a CMA.
Graph 1 shows the population counts for Canada’s 15 most populous CMAs. Toronto, by a margin of more than two million people, is the biggest. Furthermore, while Toronto’s population, at 6.3 million, is less than the next two cities combined, − i.e., Montreal at 4.3 million and Vancouver at 2.7 million, for a 7.0 million sub-total, − it’s not that far off the mark.
Remarkably, one in six Canadians lives in CMA Toronto and one in three Canadians resides in Toronto, Montreal or Vancouver.
Graph 1: Canada’s 15 Most Populous Cities
Population Level, July 1 2018
A Census Metropolitan Area (CMA) is a downtown core plus closely aligned suburbs.
Data source: Statistics Canada.
Chart: ConstructConnect.
Graph 2 − Y/Y Population Growth Rates:
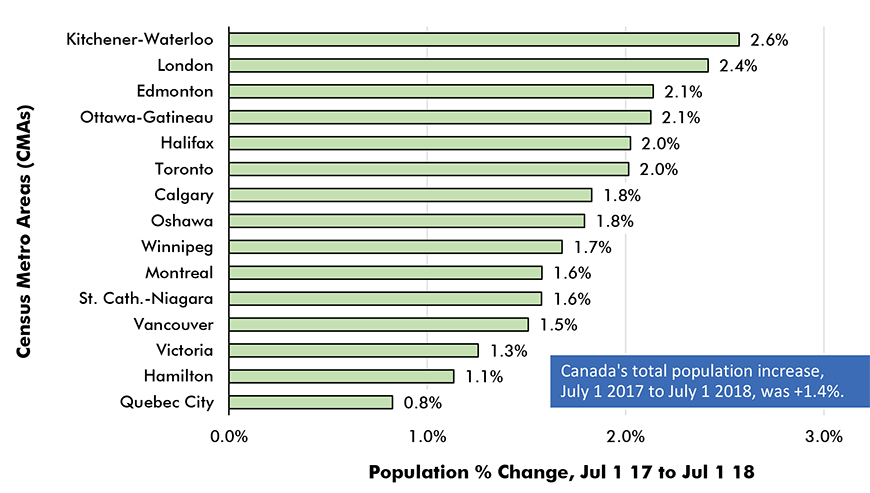
Among Canada’s 15 largest CMAs, the swiftest population growth rates between mid-2017 and mid-2018 were recorded by: the Kitchener-Cambridge-Waterloo CMA (+2.6%); London (+2.4%); Edmonton (+2.1%); Ottawa-Gatineau (also +2.1%); and Halifax (+2.0%).
Only three of the 15 CMAs recorded y/y population growth rates that were lower than the +1.4% figure for total Canada – Victoria (+1.3%); Hamilton (+1.1%); and Quebec City (+0.8%).
Graph 2 shows the y/y population growth rates for the 15 out of 36 CMAs with the highest population levels. Among the other 21 CMAs, there were also some outstanding population growth achievements. At +3.1%, Peterborough was best among all CMAs. Windsor (+2.5%), Regina (+2.3%), Kingston and Saskatoon (each at +2.2%) also had good reason to celebrate.
Graph 2: Canada’s 15 Most Populous Cities
Population % Increase, July 1 2017 to July 1 2018
A Census Metropolitan Area (CMA) is a downtown core plus closely aligned suburbs.
Data source: Statistics Canada.
Chart: ConstructConnect.
Graph 3 – Y/Y Nominal Increase in Population:
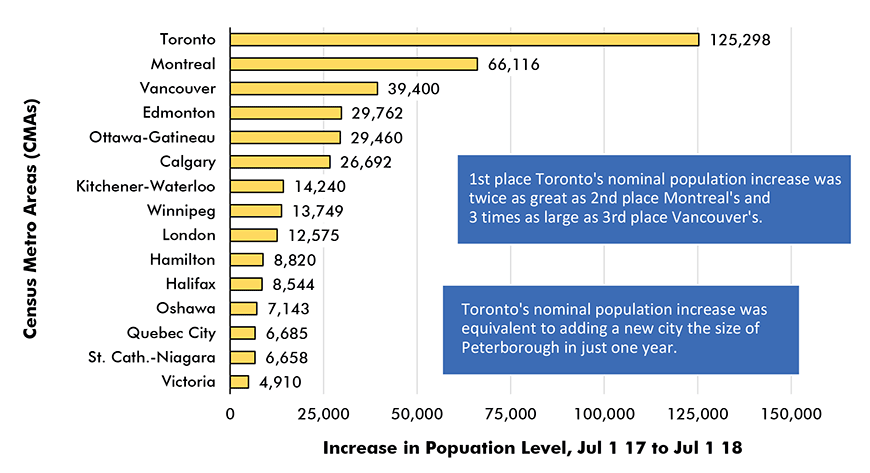
From July 1, 2017 to July 1, 2018, Toronto CMA’s population level rose by 125,000 residents. That’s equivalent to adding a new city the size of Thunder Bay or Peterborough in just 12 months. Set aside economic factors relating to interest rates and output growth, and there must still be heavy demands placed on the construction sector to fulfill demographic imperatives for accommodations and new infrastructure.
Montreal’s population count in the 12 months prior to July 1, 2018 rose by almost 70,000 and Vancouver’s, by nearly 40,000. Edmonton, Ottawa-Gatineau and Calgary each picked up almost 30,000 more residents. (Canada has six CMAs with populations exceeding a million – Toronto, Montreal, Vancouver, Calgary, Edmonton and Ottawa-Gatineau.)
Keep in mind that there are four major components of population increase: (1) ‘natural’ change (i.e., births minus deaths); (2) interprovincial migration (e.g., changing employment location from Toronto to Winnipeg, or vice versa); (3) intraprovincial migration (e.g., moving from Toronto to somewhere else in Ontario, which has accounted for population jumps in outlying centers such as Belleville, Barrie, Guelph and Brantford); and (4) international migration.
Point (4) will receive attention in the next section which looks at Graph 4.
Graph 3: Canada’s 15 Most Populous Cities
Population % Increase, July 1 2017 to July 1 2018
A Census Metropolitan Area (CMA) is a downtown core plus closely aligned suburbs.
Data source: Statistics Canada.
Chart: ConstructConnect.
Graph 4 – Role Played by International Migration:
Canada’s net international migration count between July 1, 2017 and July 1, 2018 soared by 413,000 people. In other words, 80% of the half-million population increase for the country overall originated in foreign arrivals.
Graph 4 captures how important international migration has been in the y/y population advances of Canada’s 15 biggest cities. In four of the 15 CMAs, the net number of international arrivals has been greater than the total nominal increase, yielding a proportion over 100%.
The figure can be greater than 100% due to net outflows from interprovincial and intraprovincial migration, points (2) and (3) mentioned earlier. The latter has been especially influential. In the 12 months preceding July 1, 2018, nearly 50,000 Torontonians fled not just to the suburbs, but to further away locales, often to seek less expensive housing.
International migration is composed of non-permanent residents (students, refugees and temporary workers) and immigrant arrivals. For all of Canada, the breakdown of total international migrants is approximately one-third non-permanent residents and two-thirds immigrant arrivals.
Among all 36 CMAs, Regina (103%) and Greater Sudbury (104%) also had foreign arrival counts that were above their total increases. In smaller urban centers across Canada,
more than 100% was also registered in Charlottetown, P.E.I. (115%) and in three CAs in British Columbia: Kamloops (112%); Abbotsford-Mission (135%); and Prince George (128%).
Further about population growth in smaller urban centers, the five CAs with the fastest rates of population growth from July 1, 2017 to July 1, 2018 were: Wasaga Beach, +3.7%; Carleton Place, +3.2%; Midland, +3.0%; Charlottetown, also +3.0%; and Woodstock, +2.8%. Among those five, only Charlottetown is situated outside Ontario.
Graph 4: Canada’s 15 Most Populous Cities
International Migration* as % of Nominal Population Increase,
July 1 2017 to July 1 2018
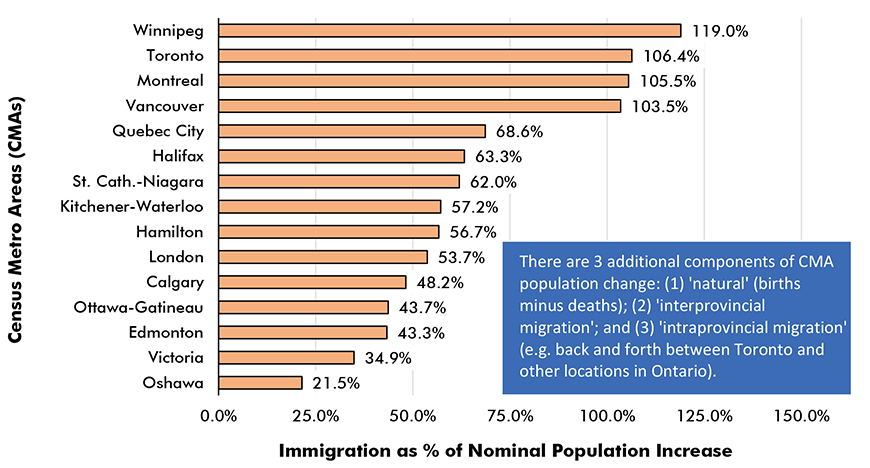
*Composed of non-permanent residents (workers, students, refugees) and immigrant arrivals.
Data source: Statistics Canada.
Chart: ConstructConnect.
Median Ages:
A final interesting topic concerning Canadian cities is the age structure of their populations.
According to Statistics Canada, the median age (i.e., the observation point at which half are older and half are younger) of all Canadians on July 1, 2018, was 40.8 years.
Among the nation’s 15 most populous cities, Edmonton (with a median age of 36.4), Calgary (36.9), Kitchener (37.8), Winnipeg (38.0) and Toronto (38.6) have the youngest populations. Those with populations tending to be a little ‘longer in the tooth’ are: St. Catharines-Niagara (with a median age of 45.6 years); Victoria (44.0); and Quebec City (42.7).





Recent Comments