Inverted Yield Curve
A lot of complicated reasons are often cited to explain an inverted yield curve (i.e., when short-term interest rates rise above long-term interest rates) and its damaging effects. What it usually comes down to, though, is rather simple. A central bank acts to raise immediate borrowing costs to cool an overheating economy. Rates over an extended time horizon stay essentially flat. The result, naturally enough, is a slowdown in the economy.
The Federal Reserve has traditionally responded to two main markers of an overheating economy. The first has been a strong labor market. With a record-low unemployment rate and continuing buoyant jobs creation, that initial criterion is certainly being fulfilled at present.
The second trigger has almost always been rapid price inflation. This is one way in which the current situation is diverging from the norm. (Another is the way in which the Fed has been reacting to stock market sentiment rather than the other way around. Investors, and their negative responses to threatened rate hikes, have become the ‘dog wagging the central bank’s tail’. But that’s another story.)
For a variety of reasons, there’s a desirable rate of price inflation and it’s about +2.0% year over year. The Consumer Price Index (CPI) has been stuck around +2.0% for some time. It has proven largely impervious to further upward movement. Despite the tight labor market, wages have been barely improving. And with the U.S. mainly going it alone among the world’s nations in achieving significant gross domestic product (GDP) growth, commodity price movement has remained uninspiring.
Inflation is not currently providing justification for rate hikes. An anticipation of more rapid inflation is a more compelling argument, but prior warnings of higher price advances have, so far, proven unfounded.
A Looming Danger from Carrying Costs
Perhaps the main argument currently being advanced for the Fed to raise interest rates is so that it will be able to lower them, as stimulus, when the next recession hits. Such reasoning has a major flaw. Where is the logic in causing a recession to be able to fight a recession?
The fed, apparently recognizing this conundrum, has recently placed further yield hikes on pause. The gap between short-term and long-term rates has widened once again, and the inverted yield-curve ‘boogeyman’ has gone back to hiding under the bed, for now.
There’s no denying a looming danger, however. The post-recession era of ultra-low interest rates has inspired many individuals, corporations and government to load up on debt. Carrying costs have imposed a minimal burden. When interest rates do eventually rise, though, and carrying costs cease being easily manageable, there will be truly unpleasant consequences.
U.S. and Canadian Monthly Housing Starts
Graph 1 shows the relative performances of U.S. and Canadian monthly housing starts (seasonally adjusted and annualized) since January 2006. The scaling of the left vertical axis for U.S. starts, in millions of units, is ten times greater than the scaling of the right vertical axis for Canadian starts, in thousands of units.
The drop in U.S. housing starts in the 2008-2009 recession was severe and they have still not fully recovered. Canada’s plunge was not as precipitous, and they quickly returned to the 200,000-unit benchmark (seasonally adjusted and annualized), where they have remained for the past nine years.
In both the U.S. and Canada, affordability, − which is governed by home prices, mortgage rates and incomes, − has become an issue. In the U.S., putting a halt to further interest/mortgage rate rises should be a spur to demand. But rather than continuing to climb, U.S. housing starts, of late, have leveled off and are even showing signs of regressing.
Graph 1: U.S. and Canada Monthly Housing Starts
Seasonally Adjusted at Annual Rates (SAAR)
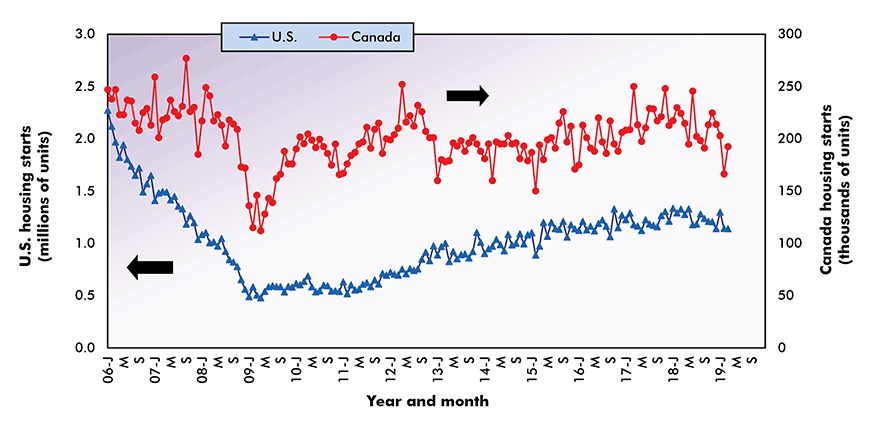
The last data points are for March, 2019. ARROWS: U.S. numbers to be read off left axis; Canadian off right axis.
Data sources: U.S. Census Bureau (Department of Commerce) and Canada Mortgage and Housing Corp. (CMHC).
Chart: ConstructConnect.
After the three frontrunners, the next ten largest MSA homebuilding markets in the U.S. in 2018 were: Atlanta (39,100 units); Phoenix (31,300); Austin (29,700); Los Angeles (29,600); Orlando (28,900); Seattle (28,000); Washington D.C. (25,400); Charlotte (25,000); Denver (21,600); and Miami (20,700).
U.S. Total Housing Starts
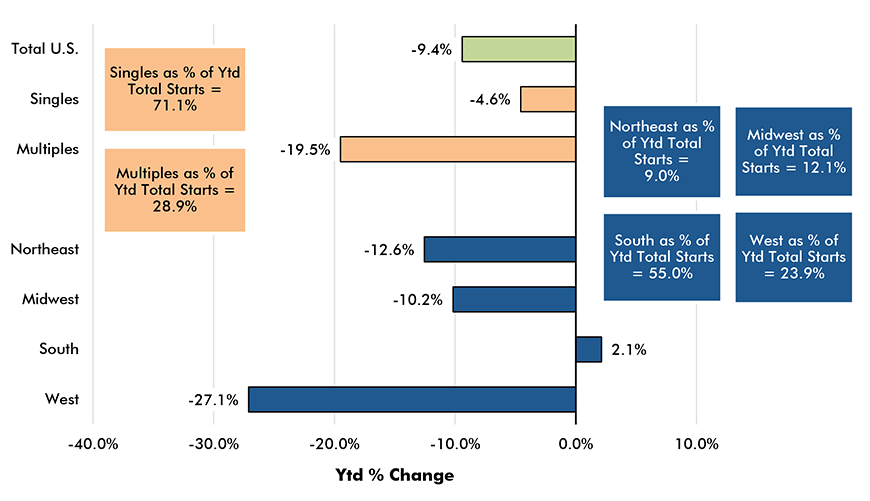
U.S. total housing starts in March 2019 were -0.3% month to month (i.e., versus February 2019) and -14.2% when compared with March 2018. On a year-to-date basis (i.e., the monthly average for Q1 2019 compared with the monthly average for Q1 2018), they were -9.4%.
Residential ‘permits’ are a leading indicator for starts and in March 2019, they were -1.7% month to month (m/m), -7.8% year over year (y/y) and -4.6% year to date (ytd). The level of residential permits in the latest month, at 1.269 million units, was a bit higher than the level of starts, 1.139 million units. To match homebuilding activity levels before the recession, both figures should be at least 1.6 million units.
Graph 2: U.S. Monthly Housing Starts
Seasonally Adjusted at Annual Rates (SAAR)
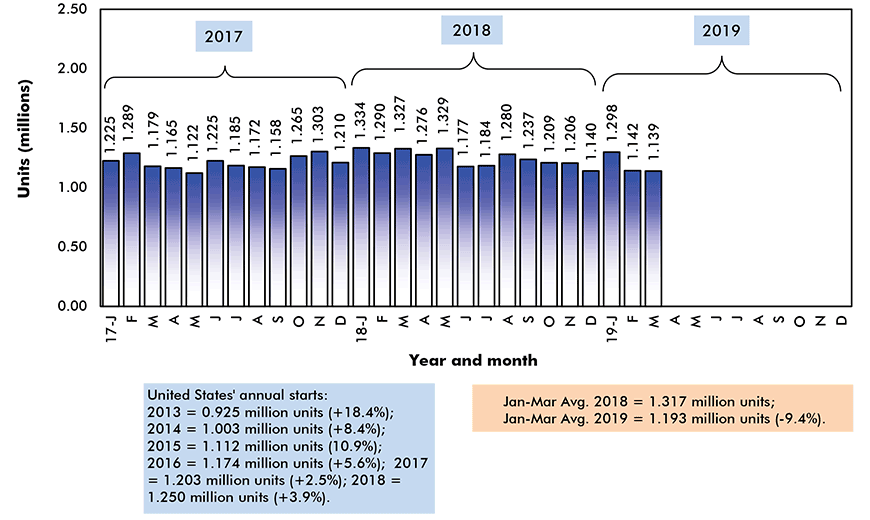
Data source: U.S. Census Bureau (Department of Commerce).
Chart: ConstructConnect.
U.S. Single-Family vs Multi-Family Housing Starts
U.S. single-family starts in March 2019 faltered to a minor degree. They were -0.4% mm, -11.0% y/y and -4.6% ytd. Multi-family starts, though, underperformed significantly: 0.0% m/m, but -20.4% y/y and -19.5% ytd.
As Graph 2 makes clear, though, and if history can be counted on to provide guidance, single-family starts have a lot more catching up to do than multi-family starts. The discrepancy between where single-family starts currently sit and where they theoretically should be is presumed to be pent-up demand. Many analysts are counting on that enormous potential to drive the economy for years to come.
Tapping into that pent-up demand, however, is proving harder than once foreseen.
Graph 3: U.S. Single-Family & Multi-Family Housing Starts
Seasonally Adjusted at Annual Rates (SAAR)
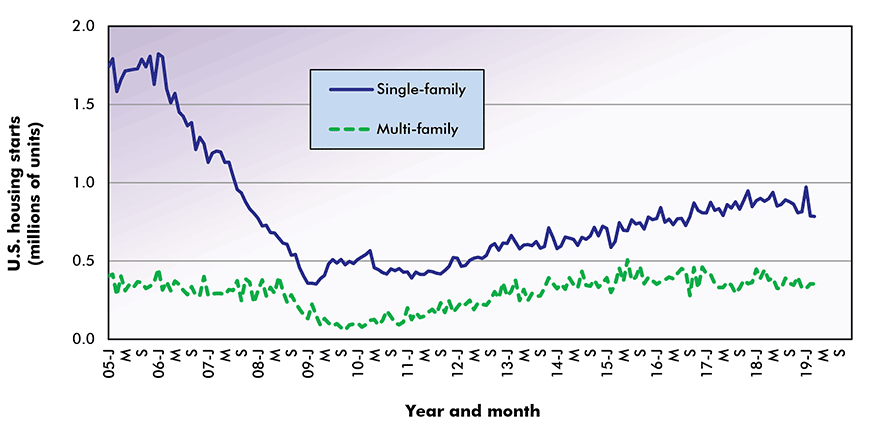
The last data points are for March, 2019.
Data source: U.S. Census Bureau (Department of Commerce).
Chart: ConstructConnect.
U.S. Regional Housing Starts
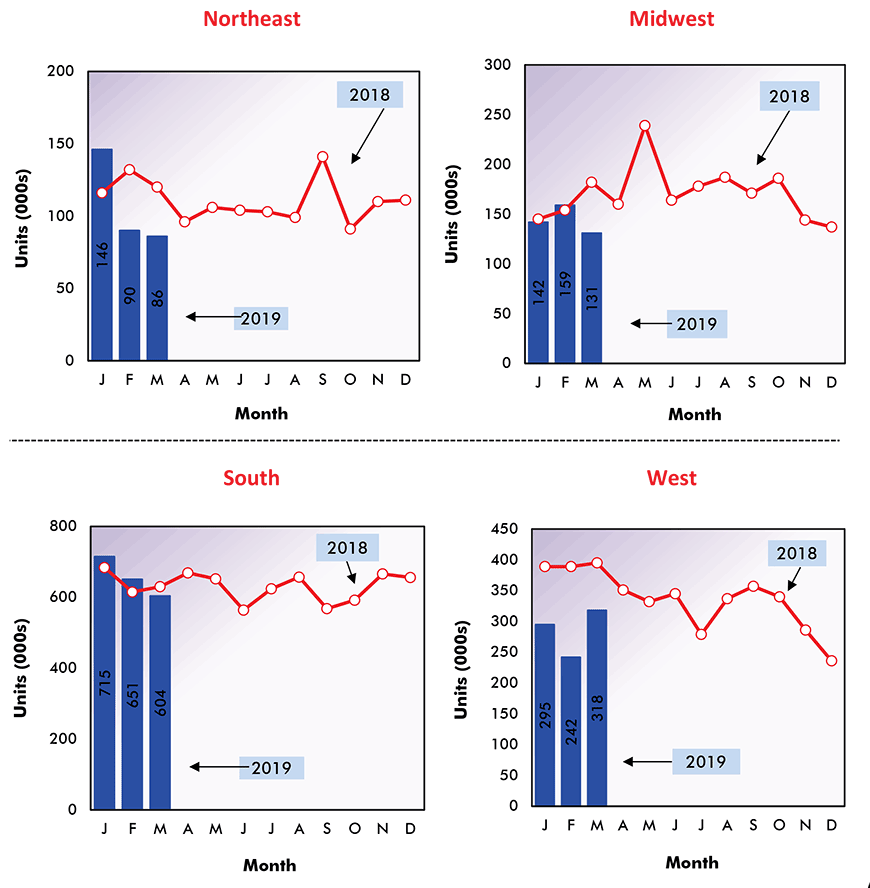
Through Q1 of 2019, the West Region in the U.S. experienced the sharpest drop in housing starts, -27.1% ytd. The Northeast and Midwest Regions also recorded declines, -12.6% and -10.2% respectively. Only the South managed a gain, +2.1%.
On a m/m basis in March, the West Region stood alone in providing good news, +31.4%. The other three regions all stumbled: Northeast, -4.4%; South, -7.2%; and Midwest, -17.6%.
The most dramatic curtailments in starts, however, occurred on a y/y basis. Three regions recorded percentage changes of startlingly negative scope: Northeast, -28.3%; Midwest, -28.0%; and West, -19.5%. The South also dipped, but not to an alarming degree, -4.1%.
Contributing more than half (55%) of total national starts, the South continues to be the dominant force on the American homebuilding scene. The West, with a nearly one-quarter share (23.9%), is next in prominence, followed by the Midwest (12.1%) and the Northeast (9.0%).
Graph 4: U.S. Housing Starts
Jan-Mar 2019 vs Jan-Mar 2018 % Changes
Based on averages of monthly seasonally adjusted and annualized (SAAR) unit starts.
Data source: U.S. Census Bureau.
Chart: ConstructConnect.
Graph 5: U.S. Regional Housing Starts
Data source: U.S. Census Bureau.
Chart: ConstructConnect.
Canada Total Housing Starts
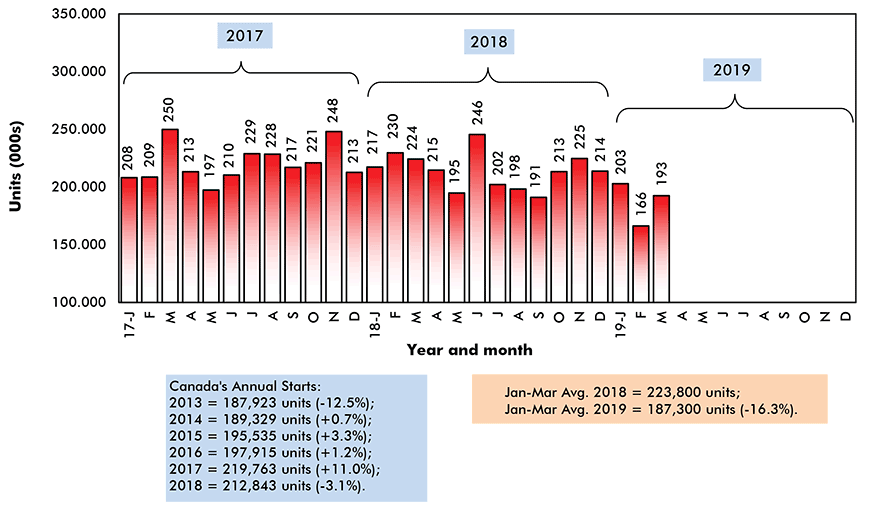
Total housing starts in Canada in March, at 192,500 units SAAR, were +15.8% m/m, but -14.2% y/y and -16.3% ytd. The decent jump m/m was because February, at 166,300 units, had been so weak.
The single-family component of total starts nation-wide was down by one-third (-33%) during the first quarter of this year. Multi-unit activity was also ‘in the red’, but only by a tenth (-10%).
Public policy concerning Canadian housing demand has been schizophrenic. The federal and provincial governments, over the last couple of years, have introduced measures to attempt to deflate a housing price bubble. The federal government has made it harder for potential home buyers to gain mortgage approvals. Their incomes must qualify for mortgages two percentage points above prevailing rates. At the same time, B.C. and Ontario have clamped down on residential real estate purchases made by foreigners.
But in the latest federal budget, two financial breaks were handed out to first-time home buyers. They can now borrow $35,000, or +$10,000 more than previously, from their RRSP savings to put towards acquiring a property. Plus, a new joint-equity proposal has been introduced whereby money from the public purse can be accessed to help with down payments on new or existing homes. The government funds utilized don’t have to be repaid until the home is re-sold. In this second plan, a cap on both incomes ($120,000) and the price of homes eligible for such a measure ($500,000) reduce how effective it will be in Canada’s two highest-priced centers, Toronto and Vancouver.
Graph 6: Canada Monthly Housing Starts
Seasonally Adjusted at Annual Rates (SAAR)
Data source: Canada Mortgage and Housing Corporation (CMHC).
Chart: ConstructConnect.
Canadian City Housing Starts – Level
The final two charts focus on housing starts in Canada’s six most populous census metropolitan areas (CMAs). The six ‘hallowed’ cities are the only Canadian urban areas with more than a million residents each.
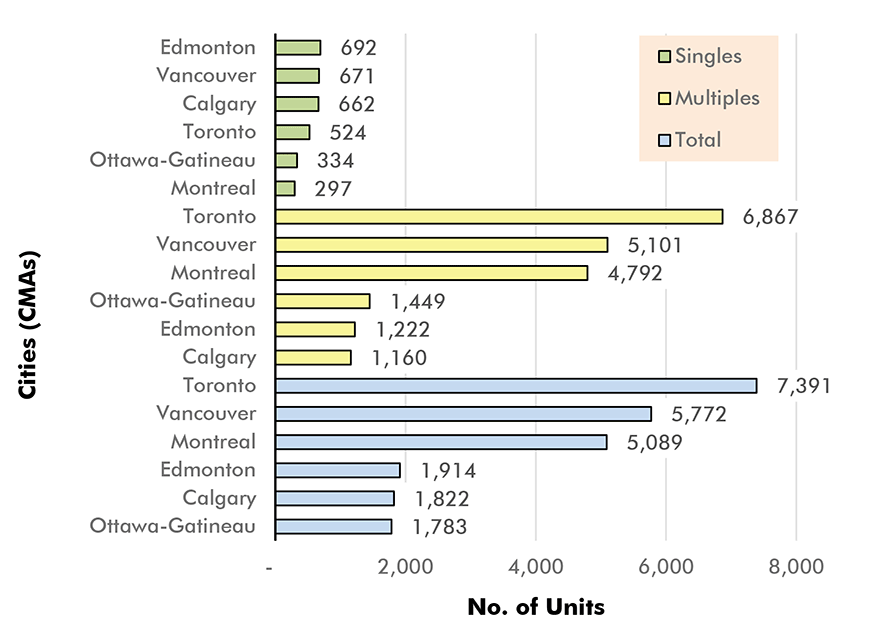
Toronto, by a margin of two million people (i.e., 6.3 million to Montreal’s 4.3 million), may be Canada’s biggest city, but in March of this year it ranked only fourth for level of single-family home starts. It was beaten by Edmonton, Vancouver and Calgary.
Winnipeg, which ranks seventh in the nation for population (and is not shown in the chart), had a level of single-family home starts in Q1 2019 that beat Ottawa-Gatineau and Montreal.
As for multi-family and ‘total’ starts, Toronto staked its usual claim to first place, with respect to level of units, in the first quarter of this year. Vancouver stayed a step ahead of Montreal for second spot.
Graph 7: Housing Starts in Canada’s 6 Most Populous Cities
Jan-Mar 2019 Actuals
Data source: Canada Mortgage and Housing Corporation (CMHC).
Chart: ConstructConnect.
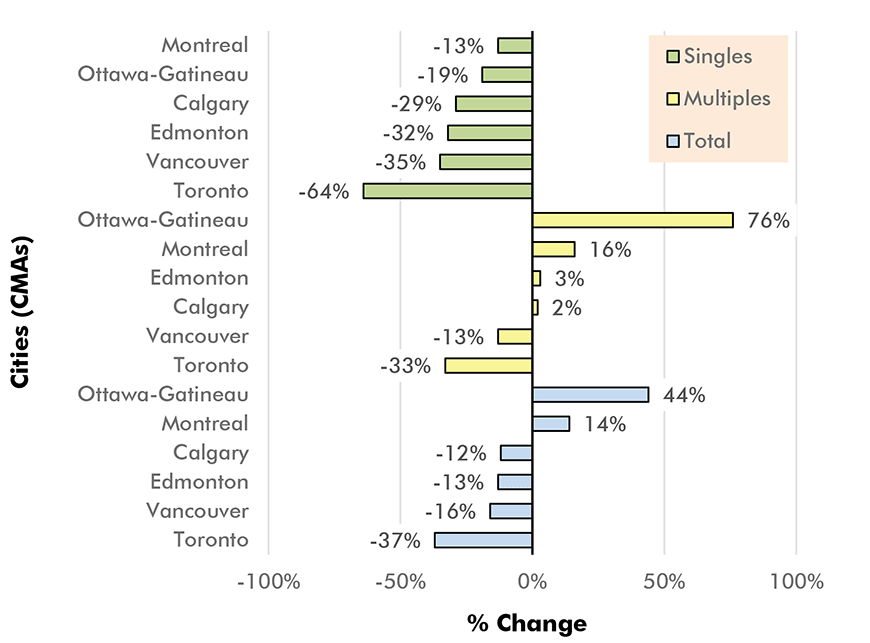
Canadian City Housing Starts – Percent Change
Year-over-year percentage changes in unit starts among Canada’s six most populous cities told a story full of diversity in Q1.
All six cities registered y/y declines in single-family starts, ranging from -13% for Montreal to an abysmal -64% (or nearly two-thirds dive), for Toronto.
As for the y/y percent changes of multi-family and ‘total’ starts in Q1, Ottawa-Gatineau ran well out in front of the six-city pack. It was +76% in multis and +44% in ‘total’. Montreal was second in both multis (+16%) and ‘total’ (+14%). Toronto ranked sixth, which is to say last, in both multis (-33%) and ‘total’ (-37%) starts.
In the nation’s capital, the Ottawa, Ontario side of the twin-city’s bisecting river, at +24% for total starts, trailed the Gatineau, Quebec side, +105%. Gatineau’s unit level, though, was only about 60% of its sibling’s count.
Graph 8: Housing Starts in Canada’s 6 Most Populous Cities
Jan-Mar 2019 vs Jan-Mar 2018
Data source: Canada Mortgage and Housing Corporation (CMHC).
Chart: ConstructConnect.


Recent Comments
comments for this post are closed