Nearly 70 Producer Price Index Series
Table 1 below sets out percentage changes, over various time periods, for 69 Producer Price Index (PPI) data series having relevance for construction. The Bureau of Labor Statistics (BLS) calculates the PPI indices.
The top portion of Table 1 records cost changes for ‘final demand’ construction according to type-of-structure categories. The ‘final demand’ indices reflect the prices paid by owners for the construction of projects. They include material, labor and markups.
The concluding section in this article will comment more fully on the sharp rise in ‘final demand’ construction costs since year-end 2016.
The ‘service’, ‘commodity’ and ‘energy’ indices in the middle section of Table 1 are based on what have been termed ‘factory-gate’ prices. They are prices in effect as the product or service goes out the front door. They do not include warehousing, wholesaling or transportation.
The ‘input’ indices at the bottom of the table capture material and service costs faced by contractors. They exclude capital investment (i.e., machinery and equipment), labor and imports.
Biggest Price Movers Among Construction ‘Commodities’
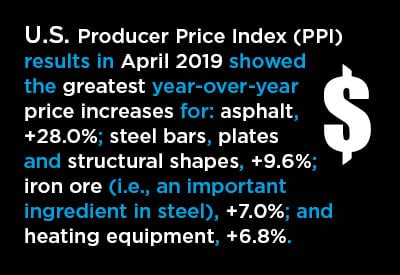
From the middle portion of Table 1, the construction service or building product components displaying the greatest year-over-year price increases in April were: asphalt, +28.0%; steel bars, plates and structural shapes, +9.6%; iron ore (i.e., an important ingredient in steel), +7.0%; and heating equipment, +6.8%.
Steel pipe and tube, plus paints and architectural coatings, also saw prices rise notably y/y in April, +6.2% in both cases. Standing out as well were air conditioning equipment, +5.9%, and construction machinery and equipment, +5.7%.
Moving dramatically to the downside y/y were iron and steel scrap, -15.7%; particle board and oriented strandboard (OSB), -15.2%; softwood lumber, -12.6%; plywood, -11.1%; and gypsum, -6.1%.
% Change in the April 2019 Index from:
| 3 Years | 1 Year | 6 months | 3 months | 1 month | |||||
| Ago | Ago | Ago | Ago | Ago | |||||
| Final Demand/Service/Commodity/Energy/Input: | |||||||||
| Final Demand Construction | 10.9% | 5.4% | 2.5% | 1.7% | 1.6% | ||||
| Construction for private capital investment | 11.2% | 5.5% | 2.5% | 1.6% | 1.5% | ||||
| Construction for Government | 10.6% | 5.3% | 2.6% | 1.9% | 1.7% | ||||
| New warehouse building construction | 11.0% | 5.2% | 3.6% | 2.0% | 2.3% | ||||
| New school building construction | 11.7% | 6.2% | 2.9% | 2.2% | 2.0% | ||||
| New office building construction | 10.8% | 4.9% | 1.9% | 1.3% | 1.5% | ||||
| New industrial building construction | 13.1% | 6.9% | 3.2% | 2.1% | 2.0% | ||||
| New health care building construction | 9.6% | 5.0% | 2.0% | 1.3% | 0.7% | ||||
| Architectural & engineering services | 7.5% | 3.1% | 2.2% | 1.2% | 1.0% | ||||
| Construction machinery & equipment | 5.9% | 5.7% | 1.4% | 0.3% | 0.2% | ||||
| Asphalt | 119.8% | 28.0% | -7.7% | 12.7% | 13.5% | ||||
| Plastic construction products | 9.2% | 1.8% | 0.9% | -0.1% | -0.1% | ||||
| Softwood lumber | 10.5% | -12.6% | 2.0% | 4.6% | -0.8% | ||||
| Hardwood lumber | 2.5% | -3.5% | -1.3% | -0.4% | 1.4% | ||||
| Millwork | 10.1% | 2.7% | 0.8% | 0.8% | 0.0% | ||||
| Plywood | 9.7% | -11.1% | -8.1% | -0.5% | 0.1% | ||||
| Particle board & oriented strandboard (OSB) | 4.0% | -15.2% | -3.1% | 4.0% | 0.9% | ||||
| Gypsum | 8.0% | -6.1% | -4.4% | -0.6% | 1.0% | ||||
| Insulation materials | 8.4% | 5.3% | 2.0% | 0.0% | 1.7% | ||||
| Construction sand, gravel & crushed stone | 11.0% | 4.0% | 2.5% | -0.1% | 0.4% | ||||
| Cement | 10.5% | 3.5% | 2.6% | 1.8% | 1.8% | ||||
| Ready-mix concrete | 10.0% | 1.6% | 2.3% | 1.4% | 2.1% | ||||
| Precast concrete products | 11.4% | 4.8% | 2.9% | -0.1% | 0.2% | ||||
| Prestressed concrete products | 8.6% | 4.3% | 0.6% | 0.1% | 0.6% | ||||
| Brick (clay) | 4.6% | 1.3% | 1.4% | 0.5% | 0.2% | ||||
| Coal | 6.6% | 1.0% | -0.2% | -2.0% | -0.2% | ||||
| Iron ore | 17.3% | 7.0% | 2.6% | 1.4% | 0.3% | ||||
| Iron & steel scrap | 37.1% | -15.7% | -4.6% | -1.6% | -3.1% | ||||
| Steel bars, plates & structural shapes | 35.8% | 9.6% | -0.5% | -1.7% | 0.4% | ||||
| Steel pipe & tube | 34.5% | 6.2% | -3.3% | -3.6% | -1.1% | ||||
| Fabricated structural metal products | 13.3% | 3.8% | 0.6% | 0.2% | -0.7% | ||||
| Prefabricated Metal Buildings | 20.5% | 1.6% | -2.6% | -1.2% | 0.8% | ||||
| Metal valves | 10.0% | 3.6% | 1.3% | 0.8% | 0.0% | ||||
| Aluminum mill shapes | 24.8% | 0.6% | -0.9% | 0.8% | 0.0% | ||||
| Sheet metal ducting | 2.9% | 0.5% | 0.0% | 0.0% | 0.0% | ||||
| Flat glass | 4.3% | 0.4% | 0.7% | -0.3% | 0.4% | ||||
| Paints, architectural coatings | 11.1% | 6.2% | 5.0% | 0.7% | -1.0% | ||||
| Lighting fixtures | 7.6% | 4.9% | 1.1% | 0.4% | 0.2% | ||||
| Plumbing fixtures & fittings | 9.3% | 4.4% | 4.0% | 2.0% | 0.0% | ||||
| Elevators & escalators | 9.9% | 4.7% | 3.6% | 1.4% | -0.1% | ||||
| Heating equipment | 10.8% | 6.8% | 2.2% | 0.6% | 0.8% | ||||
| Air conditioning equipment | 11.1% | 5.9% | 2.9% | 1.5% | 0.8% | ||||
| Copper wire & cable | 19.8% | -5.5% | -0.6% | 0.7% | -2.3% | ||||
| Fiber optic cable | -1.2% | -0.5% | 0.0% | 0.0% | 0.0% | ||||
| Regular gasoline unleaded | 50.1% | 1.8% | -7.4% | 42.5% | 15.2% | ||||
| Diesel Fuel | 95.6% | 4.3% | -11.0% | 20.4% | -1.5% | ||||
| Jet Fuel | 85.4% | 0.9% | -13.4% | 14.9% | 0.2% | ||||
| Natural gas | 32.3% | -3.2% | -14.2% | -31.3% | -8.7% | ||||
| Natural gas to electric utilities | 2.2% | -1.1% | -7.2% | -16.7% | -1.3% | ||||
| Commercial electric power | 3.8% | -0.1% | -3.0% | 0.5% | -0.5% | ||||
| Industrial electric power | 17.6% | 0.1% | -3.5% | -2.0% | -1.2% | ||||
| Residential electric power | 6.0% | 1.4% | 0.6% | 0.4% | -0.2% | ||||
| Commercial natural gas | 18.3% | 1.4% | 4.3% | -5.0% | -2.8% | ||||
| Industrial natural gas | 6.9% | -4.0% | -1.7% | -10.5% | -3.6% | ||||
| Residential natural gas | 16.8% | 1.5% | 3.8% | -2.5% | -1.0% | ||||
| Inputs to new construction | 12.7% | 2.9% | 0.4% | 2.4% | 1.0% | ||||
| Inputs to new construction, goods | 13.7% | 2.5% | -0.6% | 3.5% | 0.9% | ||||
| Inputs to new construction, services | 11.3% | 3.4% | 1.6% | 1.0% | 1.2% | ||||
| Inputs to new residential construction | 12.0% | 2.5% | 0.4% | 1.8% | 1.0% | ||||
| Inputs to single-family res construction | 12.1% | 2.4% | 0.3% | 2.0% | 1.0% | ||||
| Inputs to multi-family res construction | 12.1% | 2.3% | 0.3% | 1.8% | 1.2% | ||||
| Inputs to new non-res construction | 13.0% | 3.2% | 0.4% | 2.8% | 1.0% | ||||
| Inputs to commercial construction | 13.0% | 3.2% | 0.4% | 2.3% | 0.7% | ||||
| Inputs to healthcare structures | 12.4% | 2.9% | 0.5% | 2.2% | 0.7% | ||||
| Inputs to industrial structures | 12.4% | 4.2% | 1.4% | 2.6% | 0.9% | ||||
| Inputs to highways & streets | 14.6% | 3.5% | -0.5% | 3.5% | 1.4% | ||||
| Inputs to power & communication structures | 13.7% | 2.9% | 0.1% | 3.2% | 1.1% | ||||
| Inputs to educational & vocational structures | 11.9% | 2.8% | 0.5% | 1.8% | 0.7% | ||||
| Inputs to maintenance & repair construction | 12.7% | 2.8% | 0.4% | 2.7% | 1.2% | ||||
| Construction materials (PPI ‘Special Index’) | 11.7% | 2.2% | -0.5% | -0.8% | -0.4% |
The ‘service’, ‘commodity’ and ‘energy’ indices (in the middle section of the table) are based on ‘factory-gate’ sales prices.
The ‘input’ indices (at bottom) reflect costs faced by contractors. They exclude capital investment (i.e., machinery & equipment), labor & imports.
The ‘input’ indices are built up from the ‘service’ (design, legal, transport & warehousing, etc.) ‘commodity’ and ‘energy’ indices.
Table: ConstructConnect.
Skyrocketing Construction Costs Defy CPI Inflation’s Moderation
Consumer Price Index (CPI) inflation, presently at +2.0% year over year, remains restrained.
The cost of construction, however, as calculated by the BLS in its ‘final demand’ Producer Price Index (PPI) series, is skyrocketing. Graph 1 shows the trajectory.
At the end of 2016, the y/y increase in ‘final demand construction cost’ was less than half of one percent (+0.5%). An almost steady and remarkably steep climb since then has resulted in a +5.4% y/y figure in the latest reported month, April 2019.
Furthermore, none of the material and service ‘input’ index y/y results appearing at the bottom of Table 1 have been matching the +5.4% gain for final demand. ‘Inputs to industrial structures’ have risen the most, but by a still lesser +4.2%.
Logic therefore dictates that the extra bump-up in ‘final demand construction cost’ originates in labor, overhead and/or profit. Construction labor, which is currently in notoriously short supply, seems the most likely source. Although it should also be noted the wage increases for construction workers appearing in the monthly Employment Situation report from the BLS indicate nothing too alarming. Year-over-year hourly and weekly earnings in the construction sector have consistently been lying between +3.0% and +4.0%.
Perks in addition to nominal wages (e.g., signing bonuses) are likely contributing more than usual to construction labor cost hikes.
In any event, surpassing even +5.4% y/y for overall ‘final demand construction cost’ are new school buildings, +6.2%, and new industrial buildings, +6.9%.
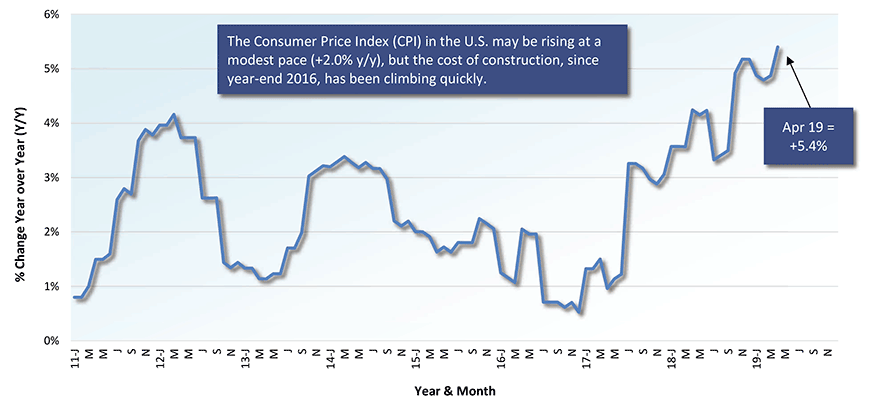
Chart: ConstructConnect.






Recent Comments