
Lowest Core-Aged Male Unemployment Rate in 40 Years
On top of the 82,000 net new jobs that were created in Canada in August, another +53,000 were added in September, according to the latest Labour Force Survey report published by Statistics Canada. The total for the past two months, therefore, has been +135,000, a remarkably strong advance.

The total increase in employment in Canada through the first three quarters of 2019 has been +358,000, way above January-to-September 2018’s figure of +98,000. The average monthly gain to date this year has been +40,000, more than three-and-a-half times larger than 2018’s comparable number of +11,000.
Canada’s seasonally adjusted (SA) unemployment rate in September tightened another couple of notches to 5.5% from 5.7% in August. It was also down from September 2018’s 5.8%.
On a not seasonally adjusted (NSA) basis and adopting the same calculation methodology as in the U.S., Canada’s jobless rate in September was only 4.1%, its lowest reading this century. Also, the 4.1% figure for Canada was not greatly different from the 3.3% NSA level recorded in the U.S.
Most of the +53,000 climb in total jobs in September was among ‘core’ male workers, aged 25 to 54, who managed a hiring jump of +36,000. Most notable, however, is that the unemployment rate for core-aged males fell from 4.9% in August to 4.4% in September, its lowest reading in 40 years dating back to September 1979.
New Jobs Mostly in Health Care and Accommodation
Canadian full-time employment in September was +70,000 jobs, which was partly offset by a contraction in part-time work, -16,000. Full-time work is more welcome, though, because it is usually higher-paying and more secure.
Public sector employment in the latest month was +32,000, which was a little better than the jobs lift offered by the private sector, +21,000. The private sector jump was entirely due to a pick-up in ‘self-employed’ endeavors.
Among industrial sectors, the jobs improvement was most evident in ‘health care and social assistance’ (+30,000) and ‘accommodation and food services’ (+23,000). ‘Information, culture and recreation’ cut staffing in a big way (-37,000).
While manufacturing added only +2,000 jobs in September, construction undertook a bit more hiring, at +10,000. For both manufacturing and construction in Canada, however, the monthly average improvements so far this year have been less than eye-popping, +1,000 and +3,000 respectively.
Nevertheless, as set out in Table 1, the y/y Canadian employment pickups in manufacturing and construction are currently beating U.S. results.
Table 1: U.S. and Canadian Jobs Markets – September 2019
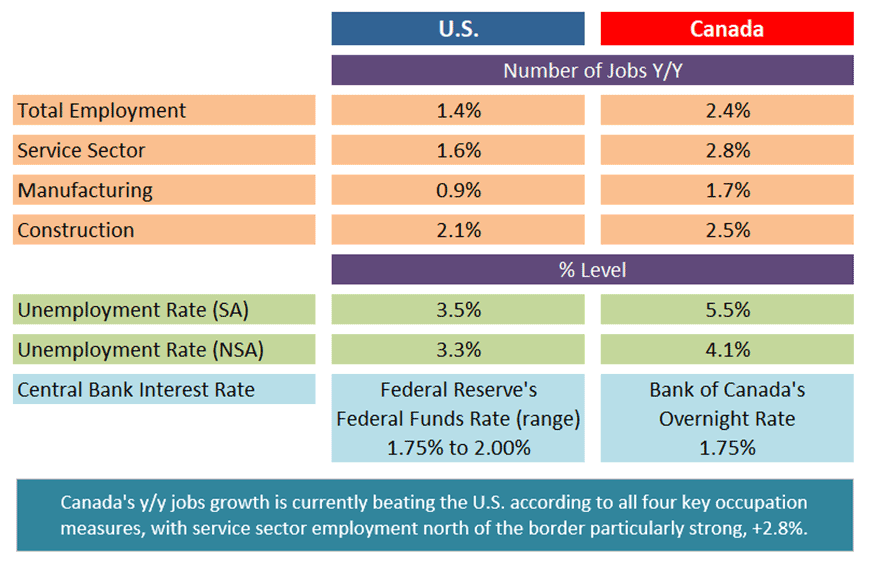
U.S. labor data is from a ‘payroll survey’ / Canadian labour data is from a ‘household survey’.
Canadian NSA unemployment rate ‘R3’ is adjusted to U.S. concepts (i.e., it adopts U.S. equivalent methodology).
Table: ConstructConnect.
Ontario a Jobs-Making Juggernaut
Ontario has been a jobs-making machine. It’s been the juggernaut among the provinces.
Ontario net employment in September rose by +41,000 jobs. With 39% of the nation’s population, Ontario’s share of Canada’s total new jobs over the past year has been 56% (i.e., +253,000 for Ontario as a slice of +456,000 for total Canada).
Ontario’s year-over-year jobs increase has been +3.5%, which is nearly one-and-a-half times the rate for the entire country (+2.4%).
Quebec, with a change of +3.1%, has also been a significant jobs generator over the past year.
Furthermore, Quebec is now tied with British Columbia for lowest unemployment rate among all the provinces, both at 4.8%. Manitoba is only a minor step back with a jobless figure of 5.0%.
Finally, mention should be made of the healthy earnings gains being realized by Canadian workers. With inflation still restrained, more compensation allows more consumer spending, which helps drive gross domestic product (GDP) growth.
Table 2 shows wage increases weekly and hourly Canada-wide to be +3.8% and +4.3% respectively. The highest number in the table is +4.6% for non-union workers hourly.
Employees in the U.S. have been seeing pay cheque increases that have generally been about one percentage point below Canadian results.
Table 2: Canadian Workforce Earnings,
Year over Year – September 2019
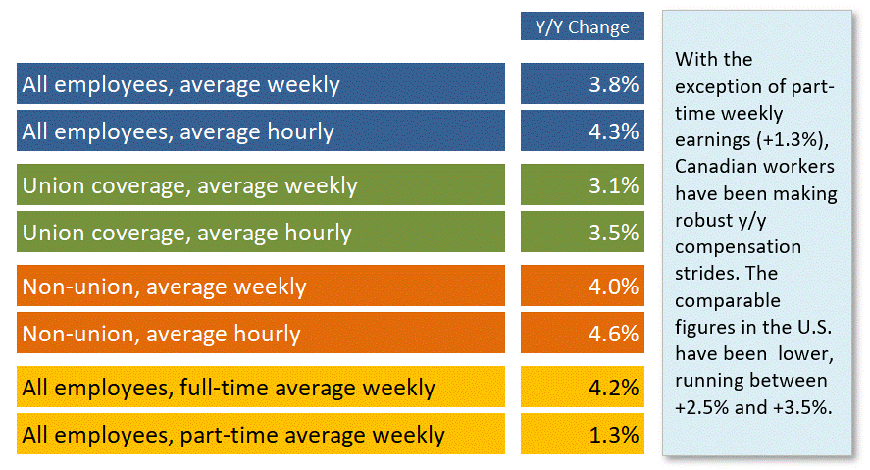
(‘Current’ means there has been no scaling back to remove effects of inflation.)
Table: ConstructConnect.
Alex Carrick is Chief Economist for ConstructConnect. He has delivered presentations throughout North America on the U.S., Canadian and world construction outlooks. Mr. Carrick has been with the company since 1985. Links to his numerous articles are featured on Twitter @ConstructConnx, which has 50,000 followers.


Recent Comments
comments for this post are closed