What’s the Fascination with Stock Markets?
There are publicly-traded companies engaged directly in the construction industry, and others with close ties to the construction sector, that have obvious reasons to be interested in how stock markets are performing. As just one example, executives of such firms may have compensation packages that rise commensurate with increases in their companies’ share prices.
There are numerous other, but not quite so obvious, reasons that stock market trajectories are watched closely by analysts studying the economy and construction industries.
Appreciating stock market prices boost the confidence of business decision-makers to undertake more investment spending. They also establish a better climate for initial public offerings (IPOs) and secondary share issuances which provide the funding for expanded physical footprints in manufacturing and in commercial and residential real estate.
In the mining and energy sectors, appreciations in the share prices of resource companies facilitate the development of more extraction sites. Increasingly, such projects are ‘mega-sized’, employing arrays of skilled workers over lengthy periods of time.
Appreciating stock market prices lift the value of mutual and pension fund holdings, contributing to consumer confidence and the willingness of individuals and families to undertake ‘big-ticket’ purchases, such as homes and cars. At 70% of gross domestic product (GDP) in America, consumer spending has become the major factor in national output’s growth success.
Furthermore, even in a market niche, such as building projects undertaken at universities, the appreciation of equities held in large endowment funds permits the construction of new faculty buildings, residences and athletic facilities.
Sobering Thoughts Concerning the Coronavirus Pandemic
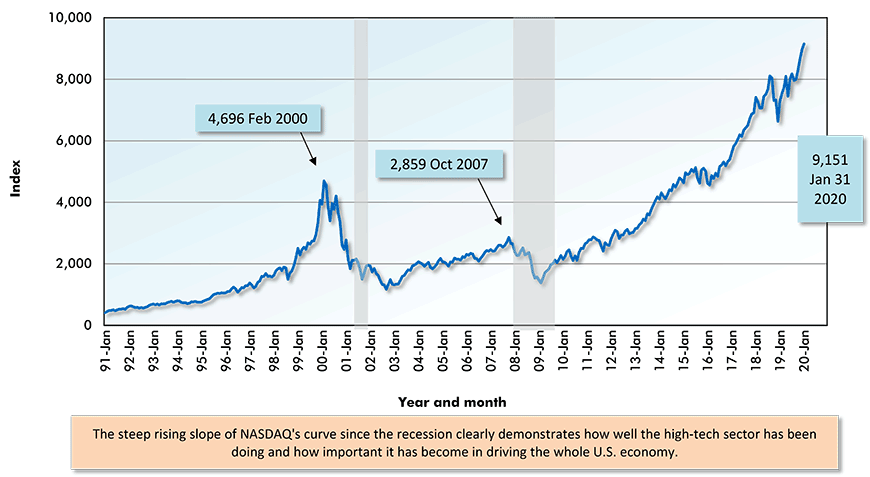
The improvement in the NASDAQ index over the past decade, ‒ never mind that it’s +25.7% in just the past year, ‒ captures a distinguishing feature that has positively separated the U.S. economy from the rest of the world, the extraordinary growth of the nation’s high-tech sector.
While NASDAQ is a flashy reflection of high-tech’s success, in truth it’s a sidebar to the great degree to which high-tech activities have been driving the U.S. economy.
NASDAQ, home to the share offerings of many high-tech firms, is up so much because the reach of those firms has expanded so rapidly. Furthermore, some of the giants of high-tech (Apple, Amazon, Alphabet) have proven that wealth from earnings accumulation is no longer some far-off goal but has become attainable today.
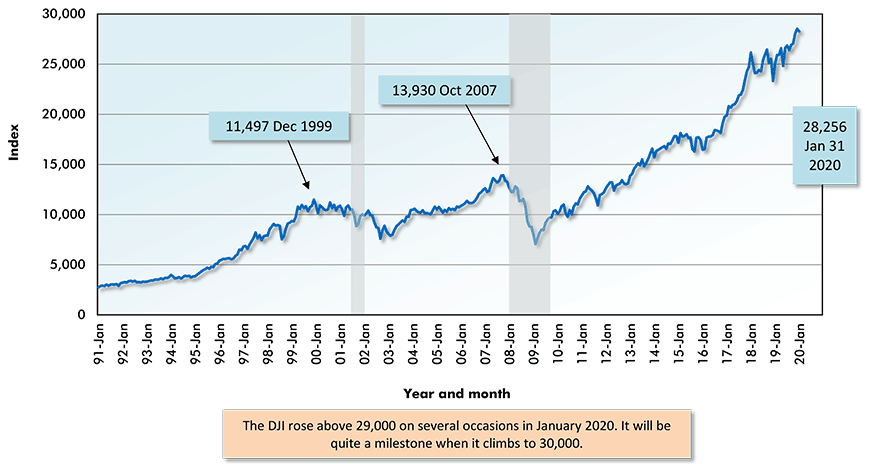
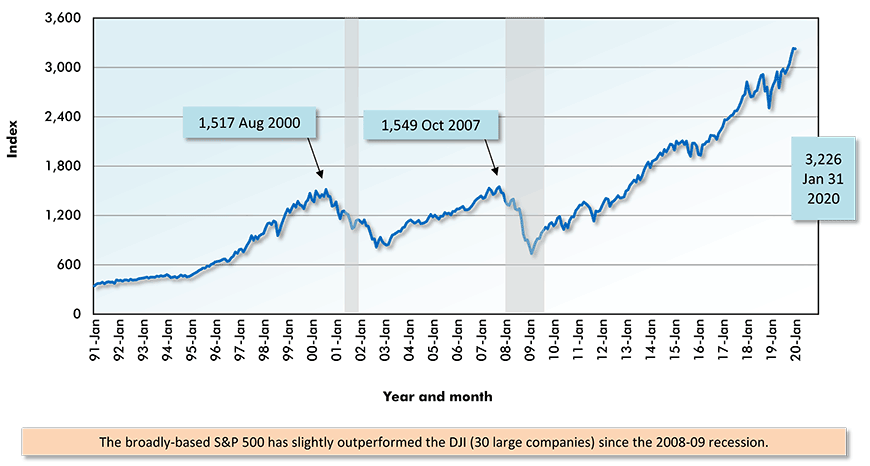
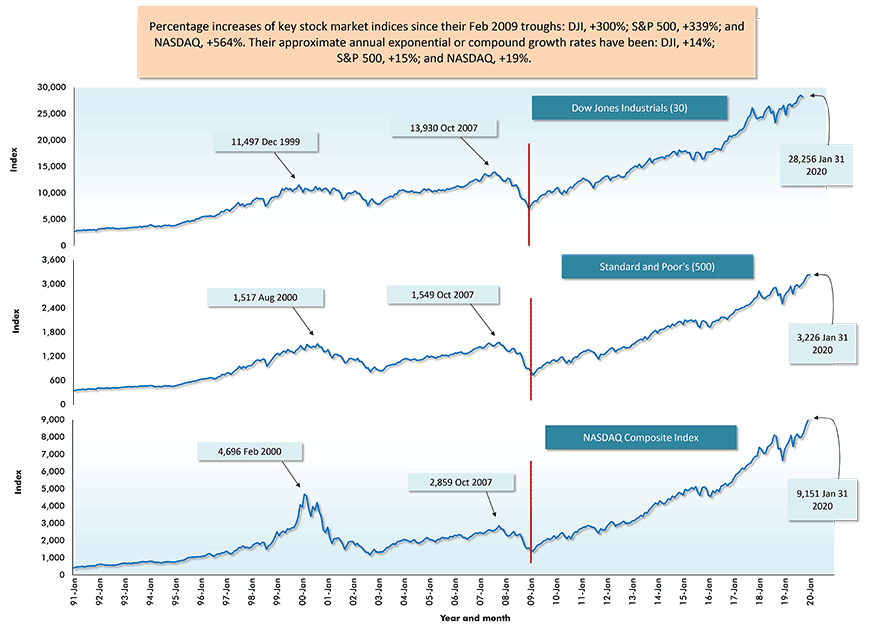
The S&P 500 (+339% since February 2009) has slightly outdistanced the DJI (+300% over the same time frame), but the DJI as a measurement is a much higher number and, therefore, is amenable to the celebration of more milestones. In January 2020, the DJI soared past 29,000 for the first time ever on several different days before closing the month at 28,256.
Late in January, sobering thoughts concerning the impacts of the coronavirus pandemic on trade, travel and, indeed, gatherings in public places in general (i.e., such as restaurants and theaters) in China, and spreading outwards if it is not effectively contained, began to strike home.
| INDEX | 52-WEEK LOW | 52-WEEK HIGH | YEAR AGO (JAN 31, 2019) |
MONTH AGO (DEC 31, 2019) |
Latest Month-end Closing Prices (JAN 31, 2020) |
PER CENT CHANGE, LATEST VERSUS |
|||
| 52-WEEK LOW | 52-WEEK HIGH | YEAR AGO | MONTH AGO | ||||||
| Dow Jones Industrials NYSE (^dji) |
Jun 3 19 24,681 |
Jan 17 20 29,374 |
25,000 | 28,538 | 28,256 | 14.5% | -3.8% | 13.0% | -1.0% |
| S & P 500 NYSE (^gspc) |
Feb 8 19 2,682 |
Jan 22 20 3,338 |
2,704 | 3,231 | 3,226 | 20.3% | -3.4% | 19.3% | -0.2% |
| NASDAQ (^ixic) |
Feb 8 19 7,225 |
Jan 24 20 9,451 |
7,282 | 8,973 | 9,151 | 26.7% | -3.2% | 25.7% | 2.0% |
| S & P/TSX Composite TSX (^gsptse) |
Feb 1 19 15,483 |
Jan 22 20 17,667 |
15,541 | 17,063 | 17,319 | 11.9% | -2.0% | 11.4% | 1.5% |
Securities Dealers Automated Quotations (NASDAQ), Toronto Stock Exchange (TSE) and Reuters.
Table: ConstructConnect.
Securities Dealers Automated Quotations (NASDAQ), Toronto Stock Exchange (TSE) and Reuters.
Chart: ConstructConnect.
Securities Dealers Automated Quotations (NASDAQ), Toronto Stock Exchange (TSE) and Reuters.
Chart: ConstructConnect.
Securities Dealers Automated Quotations (NASDAQ), Toronto Stock Exchange (TSE) and Reuters.
Chart: ConstructConnect.

Securities Dealers Automated Quotations (NASDAQ), Toronto Stock Exchange (TSE) and Reuters.
Chart: ConstructConnect.
The ‘Number 72’ Rule of Thumb Applied to Share Prices
During the past decade when the broad-spectrum level of interest rates has been unusually low, the returns realized by U.S. stock market indices have been a wonder to behold.
Graph 5 shows monthly-closing values for the DJI, S&P 500 and NASDAQ since January 1991. The period since the 2008-09 recession, however, has been the most interesting. All three indices, as well as the TSX, registered their last troughs in February 2009.
From early 2009 to end-of-January 2020, the DJI has climbed +300%; the S&P 500, +339%; and NASDAQ, a ‘whopping’ +564%.
Their exponential or compound annual growth rates over the past ten years have been: DJI, +13.8%; S&P 500, +14.6%; and NASDAQ, +18.9%.
There’s a ‘rule of thumb’, or perhaps it should be described more accurately as a mathematical anomaly, that when the number 72 is divided by a rate of interest, the answer is the number of years it will take for money earning that rate of interest to double.
The history of the TSX does not appear in Graph 5. But here are the basics. The annual exponential growth rate of the TSX since February 2009 has been +7.1%. Furthermore, it has appreciated +113% over ten years, almost bang on what one would expect from the ‘number 72’ rule of thumb.
Securities Dealers Automated Quotations (NASDAQ), Reuters & Yahoo.
Chart: ConstructConnect.
Disconnect Between Stock Markets Globally and GDP Growth
Graph 6 highlights some strong year-over-year performances among stock market indices around the world. On a month-over-month basis, though, only three of the 14 indices in Graph 6 managed positive change in January 2020: NASDAQ, +2.0%; TSX, +1.5%; and ‘iShares Frontier 100 Pre-emerging’, +0.9%.
Concerns over the havoc being caused by the coronavirus, and its potential to turn into a ‘Black Swan’ event for the world’s economy, have placed a damper on equities-buying enthusiasm.
But the y/y uplift in some of the indices may be unwarranted in any event, given weak local economies and geopolitical issues. For example, the German DAX is +16.2% and Tokyo’s Nikkei, +11.7%. But neither the German nor Japanese economies likely managed ‘real’ (i.e., adjusted for inflation) GDP growth rates above +1.0% in 2019.
In the U.K., where the FTSE is +4.5% y/y, ‘Brexit’ is now a reality, although a transition period will extend until the end of this year. The remaining months of 2019 will see ongoing discussions about ‘terms of leaving’. The eventual outcome, which may involve a ‘hard exit’ (i.e., no favorable trading concessions from Europe) is a source of uncertainty for investors.
The Shanghai index has been in pause during the celebration of the Chinese New Year. With vast regions of the country in lock-down to diminish the impacts of the coronavirus health crisis, the outlook for the economy, at least in the short-term, is worrisome.
Emerging markets in Asia and elsewhere globally depend on demand from Chinese customers, who are presently preoccupied with other concerns.
Finally, Hong Kong, where the Hang Seng is -5.8% y/y, does possess a share price index which captures the economic turmoil being created locally by massive protests over freedom and job opportunities.
Year over Year as of Month-end Closings, January 2020
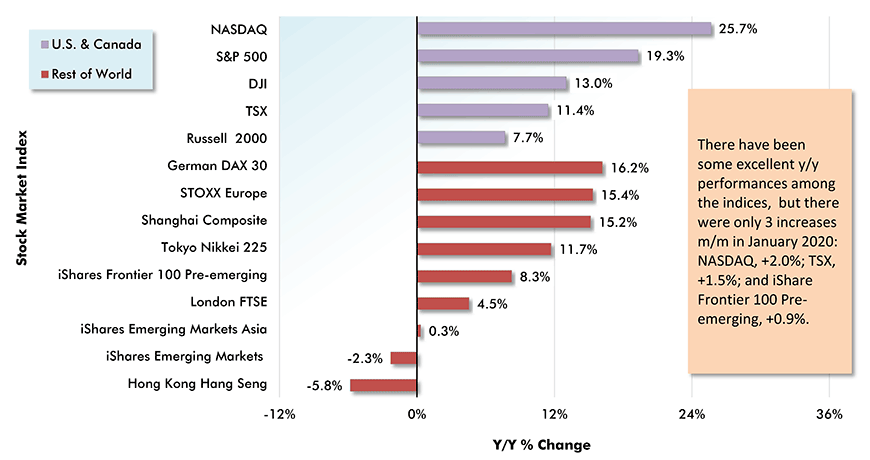
Table: ConstructConnect.
Alex Carrick is Chief Economist for ConstructConnect. He has delivered presentations throughout North America on the U.S., Canadian and world construction outlooks. Mr. Carrick has been with the company since 1985. Links to his numerous articles are featured on Twitter @ConstructConnx, which has 50,000 followers.


Recent Comments
comments for this post are closed