Two Kinds of GDP Change, Y/Y and Q/Q Annualized
There are two kinds of ‘real’ (i.e., after inflation) gross domestic product (GDP) percentage-change statistics that are being discussed these days. (Note that since most of the current movement in GDP is downwards, the word ‘change’ is more accurate than ‘growth’.)

The first kind is full-year 2020 versus full-year 2019. These numbers will be bad for most countries, but they won’t be as horrifically bad as the second kind ‒ the quarter to quarter change, annualized, for Q2 2020.
For the U.S., the first kind will be something on the order of -5% to -7%; but the second will range from -20% to -30%.
As a technical note, quarterly current-dollar GDP estimates are seasonally adjusted and deflated to make them ‘real’. The average of the four quarters is the annual or full-year figure. The full- year over full-year percentage-change calculation is straightforward.
Taking the quarter-to-quarter change and then ‘annualizing’ it is a bit more complicated. It compounds the percent change from quarter to quarter to render it the equivalent of a full year.
For lower percentage changes, such an approach is not much different from multiplying by four. For higher Q/Q percentage changes, ‘annualizing’ can produce outsized results.
The truly severe economic consequences of the coronavirus pandemic, combined with sheltering-at-home restrictions, didn’t really take hold until the second half of March. Therefore, the scariest Q/Q annualized results won’t appear until the Bureau of Economic Analysis (BEA) releases second-quarter 2020 GDP figures. Their scheduled publication date is July 30th.
Q1 GDP Takes a Beating from Nondurable Goods and Travel
For now, just-released results will have to suffice. At -4.8% for total U.S. GDP, the figure was a tiny bit worse than the -4.0% figure that was the consensus expectation of economists and other analysts.
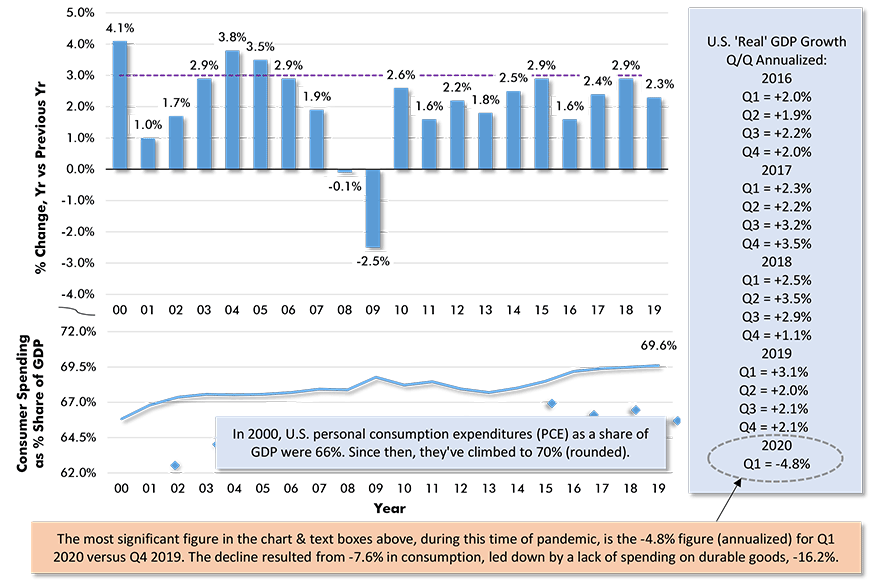
As points of comparison, the annualized percent changes in 2019 were: +3.1% in Q1, +2.0% in Q2 and +2.1% in each of Q3 and Q4.
In Q1 2020, personal consumption expenditures (PCE) (which now generally account for 70% of GDP) were -7.6% annualized. In Q4 2019, they had been +1.8%.
Q1 2020’s sharpest contractions in consumption occurred in durable goods (cars and appliances), -16.1%, and services, -10.2%. Nondurables spending (e.g., groceries) held up well, +6.9%.
Investment in nonresidential structures in Q1 2020 was -9.7% annualized. Residential construction investment, though, was +21.0%. Housing starts began this year with a bang, returning to the 1.6 million-unit level not seen since before the 2008-2009 recession.
U.S. exports from January-March 2020 versus October-December 2019 were -8.7% annualized. The cutback in imports, though, was worse, at -15.3%. Exports of services were -21.5%, while imports of services were -29.8%.
Foreign trade in services includes travel and tourism. The logic of what constitutes imports and exports with respect to cross-border traffic in individuals is tricky to understand at first. An American spending money in another country is engaging in import activity. Citizens from other nations visiting the U.S. are taking part in American export activity.
The bottom line is that, with figures of -21.5% for services exports and -29.8% for services imports (annualized), travel in any direction in Q1 was limp to say the least.

Chart: ConstructConnect.
IMF Forecasts World Trade to be -11% in 2020
The International Monetary Fund (IMF), in its latest World Economic Outlook report, acknowledges that U.S. Q2 GDP change (annualized) will likely be in the range of -20% to -30%.
But the full-year 2020 over full-year 2019 U.S. performance will probably be in a -4% to -7% range. (The IMF has picked -5.9% as its specific ‘go-to’ figure.)
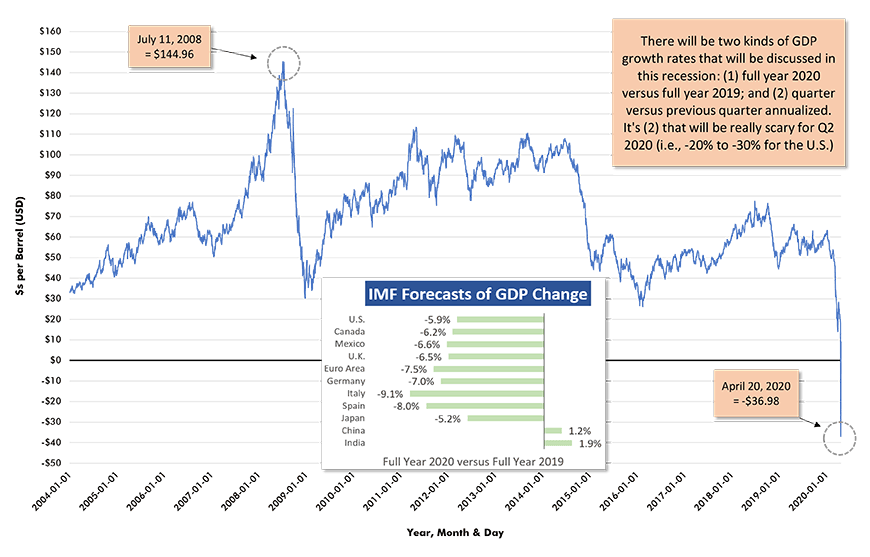
The smaller graph inside the big oil price graph appearing below sets out full-year 2020 versus full-year 2019 GDP forecasts for ten countries or regions in addition to the U.S.
At the top end are India, +1.9%, and China, +1.2%. Projected to do worst are two nations that have struggled through particularly harsh coronavirus outbreaks, Italy, -9.1%, and Spain, -8.0%.
Mexico, -6.6%, and Canada, -6.2%, will have slightly stiffer declines than the U.S., according to the IMF. Both nations are also more reliant on oil exports than America.
The main point of Graph 2 is to highlight how disastrously the international price of oil has been impacted, first by the disagreement (since resolved) between Russia and Saudi Arabia over output cuts, then by pandemic-related GDP and travel reductions around the world.
On April 20th, the global price of crude slipped below zero, sinking to -$37 USD per barrel. It has since climbed back out of the hole and sits at $15 today.
One final discouraging point to note is that the IMF is forecasting world trade in full-year 2020 compared with full-year 2019 will be -11%.

Chart: ConstructConnect.
Alex Carrick is Chief Economist for ConstructConnect. He has delivered presentations throughout North America on the U.S., Canadian and world construction outlooks. Mr. Carrick has been with the company since 1985. Links to his numerous articles are featured on Twitter @ConstructConnx, which has 50,000 followers.


Recent Comments
comments for this post are closed