Forecaster Charts & Tables
Employment
Good jobs creation and low unemployment rates are pivotal to GDP growth and construction activity.
Canada ‘R-3’ Unemployment Rate vs U.S. Unemployment Rate Not Seasonally Adjusted (NSA) Data (Statistics Canada calculates ‘R-3’ on same basis as U.S. rate)
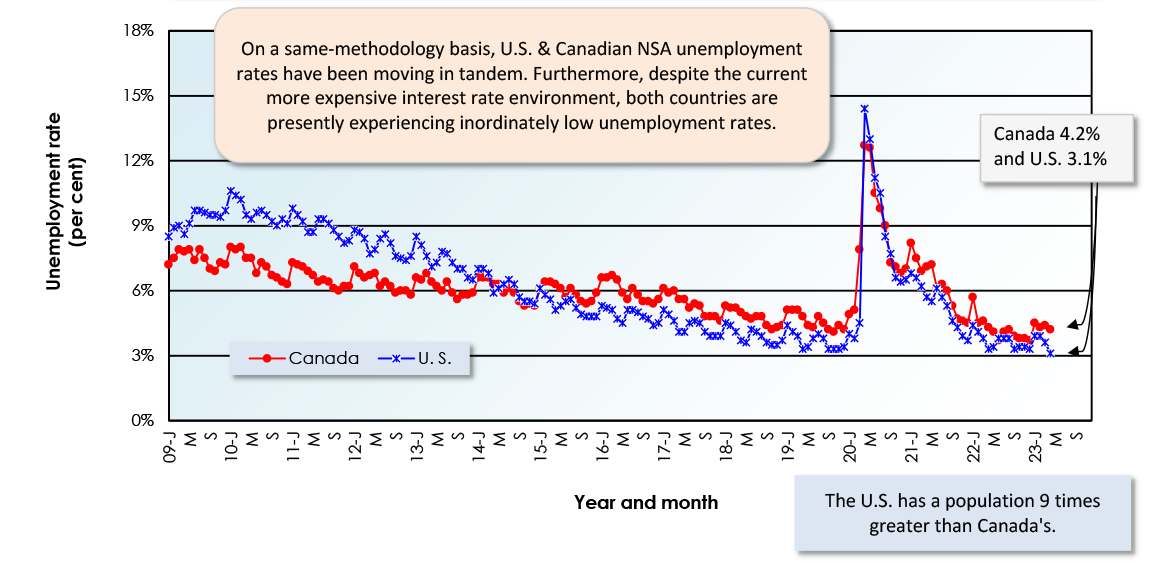
The latest data points are for April, 2023.
Data sources (seasonally adjusted): Statistics Canada and U.S. Bureau of Labor Statistics (Department of Labor).
Chart: ConstructConnect — CanaData.
Canada vs U.S. Monthly Unemployment Rate (Per Cent) Seasonally Adjusted Data
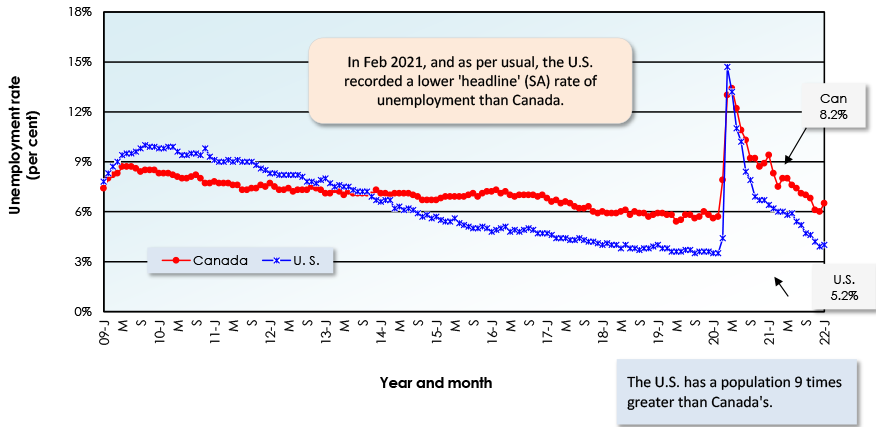
The latest data points are for October, 2022.
Data sources (seasonally adjusted): Statistics Canada and U.S. Bureau of Labor Statistics (Department of Labor).
Chart: ConstructConnect — CanaData.
Recent Comments