Forecaster Charts & Tables
Employment
Good jobs creation and low unemployment rates are pivotal to GDP growth and construction activity.
Best U.S. City Labor Markets
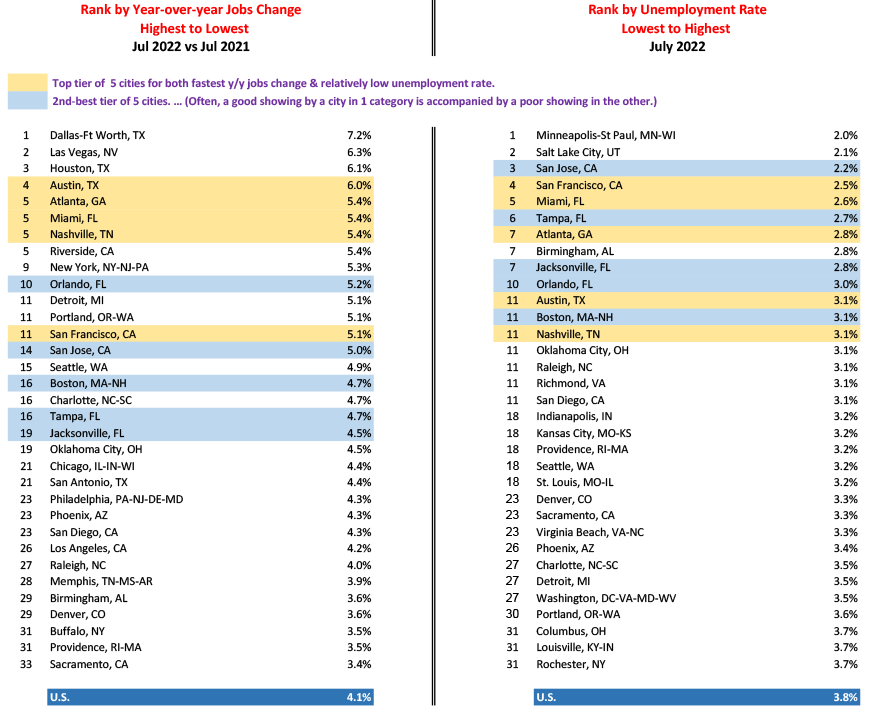
Based on not seasonally adjusted (NSA) data. / Cities are metropolitan statistical areas (MSAs).
When the ranking numbers are the same, the cities are in a tie.
Data source: U.S. Bureau of Labor Statistics (BLS).
Table: ConstructConnect – CanaData.
Labour Markets in 33 Canadian Cities
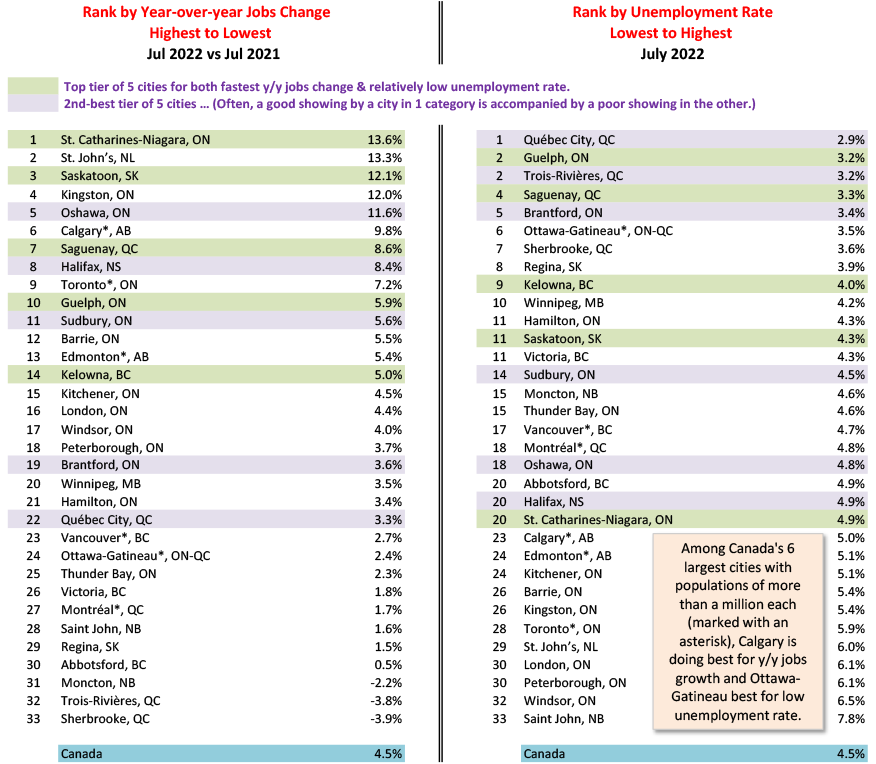
Based on averages of latest three months, seasonally adjusted (SA) data. Cities are census metro areas (CMAs). When the ranking numbers are the same, the cities are in a tie.
Data source: Statistics Canada/Tables: ConstructConnect — CanaData.
Unemployment Rates in Canada's 6 Most Populous Cities
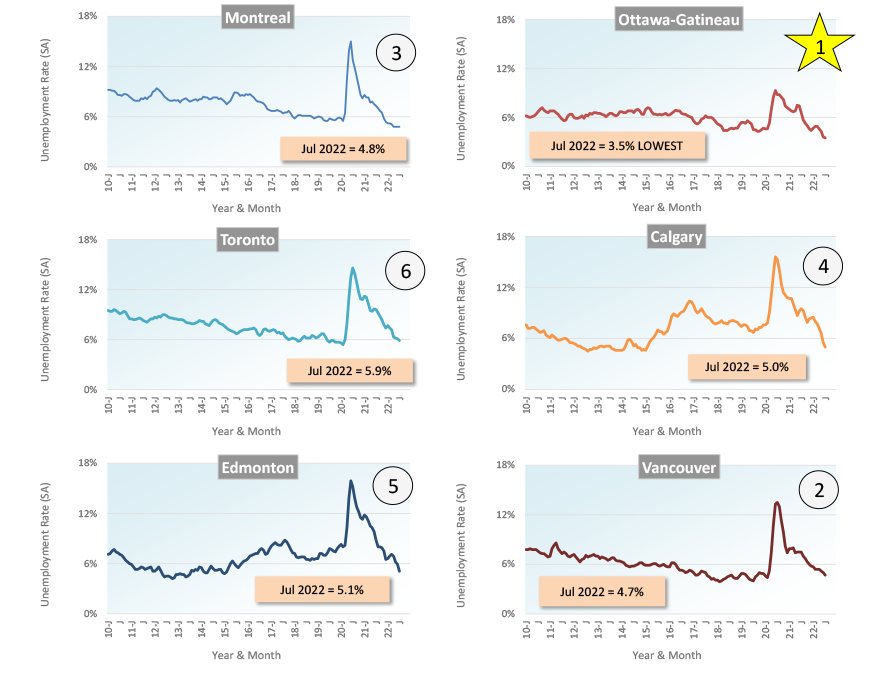
Data source: Statistics Canada (SA = Seasonally Adjusted) / Charts: ConstructConnect-CanaData.
Recent Comments