Forecaster Charts & Tables
Employment
Good jobs creation and low unemployment rates are pivotal to GDP growth and construction activity.
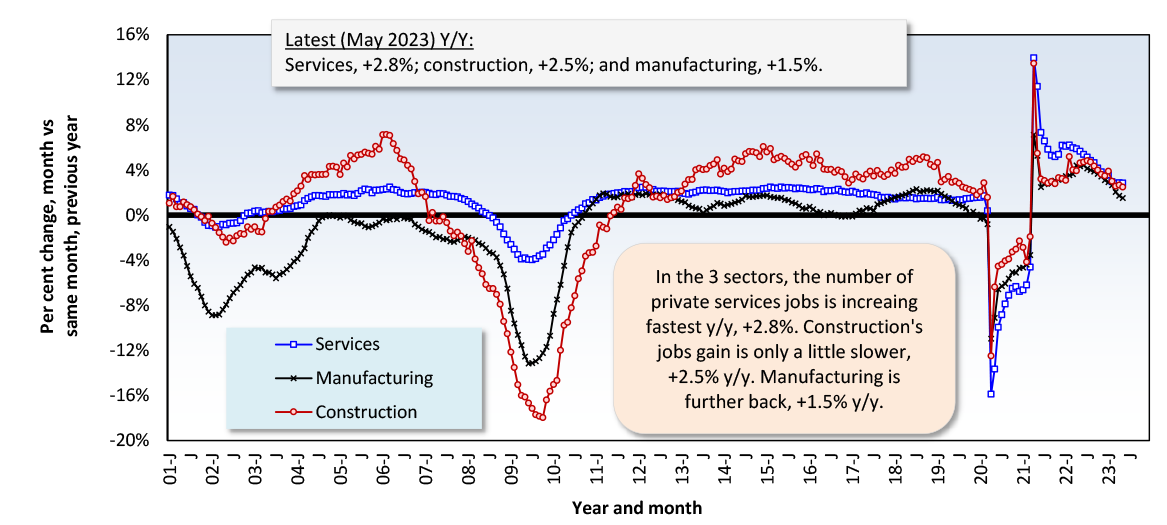
U.S. Employment - % Change Y/Y

The latest data points are for May, 2023.
Based on seasonally adjusted (SA) data.
Data source: Payroll Survey, Bureau of Labor Statistics (U.S. Department of Labor).
Chart: ConstructConnect – CanaData.
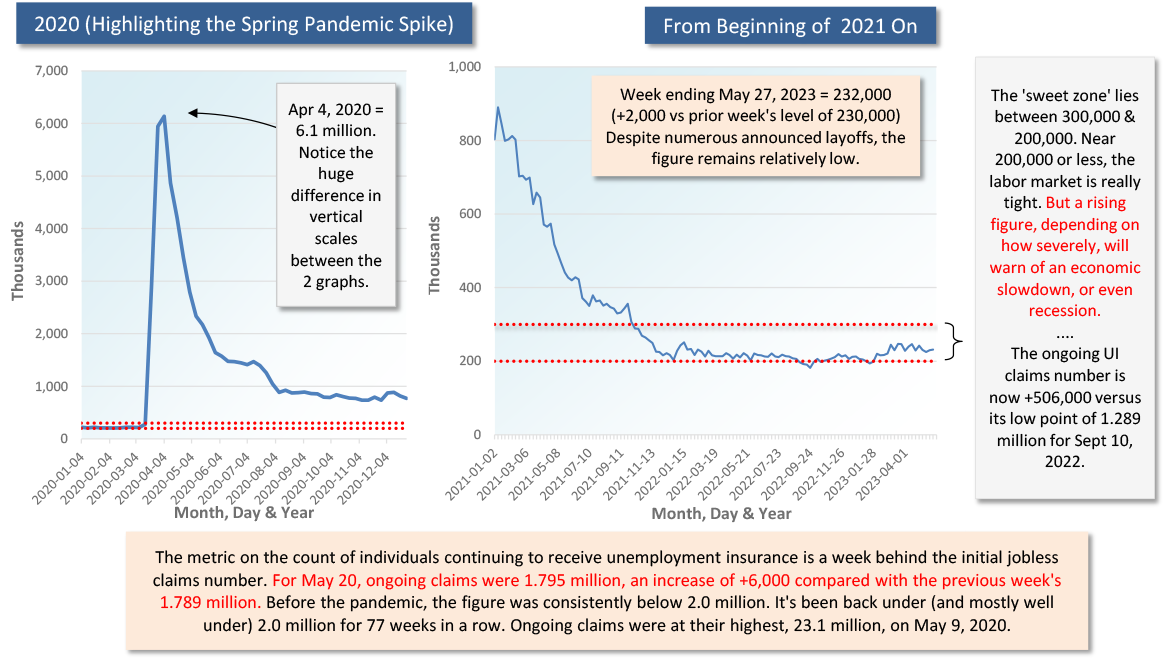
U.S. Initial Jobless Claims Weekly

Data source: Department of Labor & Census Bureau / Chart: ConstructConnect-CanaData.
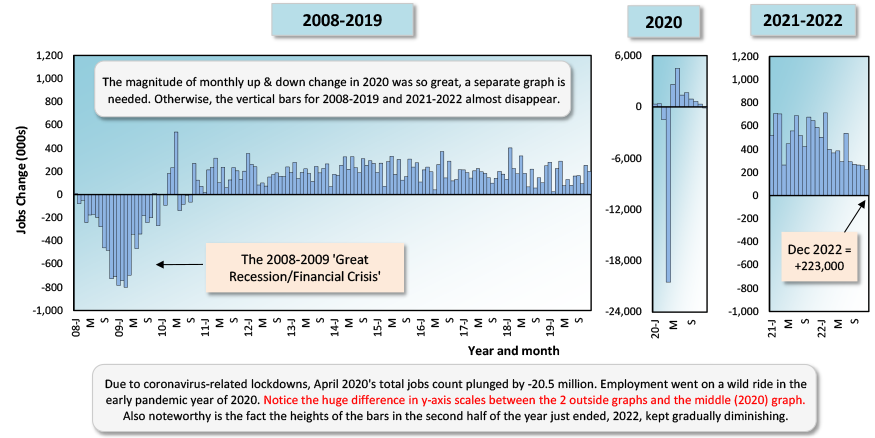
U.S. Month-to-month Total Jobs Count Change

Latest data point is for December 2022.
Source: Payroll Survey, U.S. Bureau of Labor Statistics (BLS) / Chart: ConstructConnect – CanaData.

Recent Comments