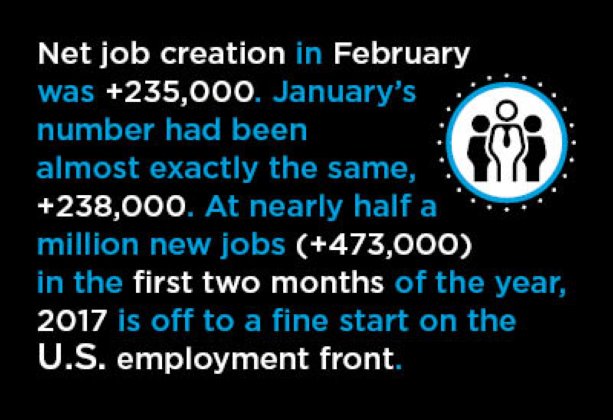
February’s Employment Situation Report from the Bureau of Labor Statistics (BLS) provides another healthy dose of good news concerning the U.S. economy. Net job creation in the latest month was +235,000.
A monthly figure of between +150,000 and +199,000 is reason to smile. When the gain is +200,000 or more, big goofy grins can easily emerge.
January’s number had been almost exactly the same, +238,000. At nearly half a million new jobs (+473,000) in the first two months of the year, 2017 is off to a fine start on the employment front.
The only caveat concerns whether or not the glowing labor market results will make the Federal Reserve more assertive and quicker off the mark in raising interest rates. Sales of ‘tea leaves’ for analysts to read will be ‘going through the roof’.
The unemployment rate contracted to 4.7%. The lowest the unemployment rate has been since the Great Recession was 4.6% in November of last year.
The lowest the U.S. monthly jobless figure has been in the past dozen years was 4.4% on several occasions between mid-2006 and mid-2007.
The positive metric concerning employment creation was presaged by weekly initial jobless claims numbers throughout the latest month that were bullish in the extreme. In fact, the figure for the week ending February 25 was only 223,000. That was the best number for initial jobless claims since 222,000 was reported for the week ending March 31, 1973.
In other words, nearly 44 years have flown by without a better number. A key benchmark for weekly initial jobless claims is 300,000. When that level is consistently beaten on the downside, the monthly jobs report is likely to be upbeat.
The +235,000 figure for net new jobs in February was even more remarkable considering that there was a significant contraction in retail sector jobs in the latest month. There have been numerous media reports lately of major shopkeeper chains closing outlets. Still, it’s rather shocking to see that 26,000 positions were eliminated in the latest 28-day period.
The staffing cutbacks in retail were primarily at ‘general merchandise stores’ (-19,000), ‘sporting goods, hobby, book and music stores’ (-9,000) and ‘electronics and appliance stores’ (-8,000).
‘Building material and garden supply stores’ – which have the closest direct tie-ins with construction activity − kept their payrolls essentially constant (+1,000).
Speaking of the construction sector, it emerged as a star in the latest labor report. At +58,000, construction had its strongest month for jobs creation since +63,000 in February 2006. More than 10 years have passed since construction firms have gone on such an aggressive hiring spree.
While heavy and civil engineering contractors bumped up their employee counts by +15,000, the bulk of the new staffing was with specialty trade contractors, +36,000. The residential versus non-residential split in the specialty trades was +15,000 as opposed to +22,000 respectively.
Whereas total employment in the U.S. in February was +1.6% year over year, in construction it was a considerably faster, − indeed more than twice as fast, − +3.3%.
The not-seasonally-adjusted unemployment rate (NSA) for U.S. construction in February of this year was 8.8%, which was just about on a par with February 2016’s 8.7%.
As for how construction workers fared relative to all employed individuals throughout America’s economy in February, the results were unexciting. For all workers, average hourly earnings were +2.8% year over year and average weekly earnings were +2.5% (from Table B-3 in the Labor Situation Report). The comparable percentage changes in the construction sector were +2.7% and +2.4%.
But when supervisory personnel are omitted from the mix (Table B-8), the reward for construction work appears much brighter. For all workers economy-wide, leaving out bosses, average hourly and weekly earnings were the same, +2.5% year over year. Non-supervisory construction workers, however, basked in increases of +3.4% hourly and +3.6% weekly.
Against the backdrop of some difficult months last year, the manufacturing sector managed decent forward momentum in net employment this February, +28,000. The jobs level among manufacturers (+0.1%) is now pretty much the same (+0.1%) as it was a year ago, in February 2016.
The only other industrial sector to generate more net new positions in February than construction was ‘education and health services’, +62,000. While lately it has been health care that has generated most of the additional pay checks in this combined category, schools stepped forward to almost the same degree in the latest period.
Net new hires at educational facilities in February was +29,000, while the gain in ‘health care and social assistance’ was +33,000. Health care alone was +27,000. Hospital net hiring was +6,000.
‘Professional and business services’ (+37,000) ranked third after ‘education and health services’ and ‘construction’, among industrial sectors, with respect to net new jobs creation in the latest month. The ‘legal services’ profession (-1,000) continued to struggle. ‘Accounting and bookkeeping services’ felt no need to expand staffing either.
Employment at ‘architectural and engineering services’ firms was up by +5,000 and at ‘computer systems and design services’ firms, by +6,000. Year-over-year employment at the former is +2.3%, which is better than for all jobs (+1.6%), but is not as strong as for construction (+3.3%).
But take note that employment in the latter sub-sector (i.e., in high-tech systems development) is +4.7%. That’s an enviable record of improvement.
The ‘leisure and hospitality’ sector came up with +26,000 jobs in February. The subset category ‘food services and drinking places’ had a hunger and thirst for an extra +17,000 workers that was sated and quenched.
‘Government’ took on +8,000 more workers. Washington (+2,000) and the states (-3,000) cancelled each other out, and it was local public service (+9,000) that accounted for all of the rise.
The local-level new hires were about evenly divided between those who will be engaged in the administration of education (+5,000) and those who will be ‘grinding away’ on other matters.


Recent Comments
comments for this post are closed