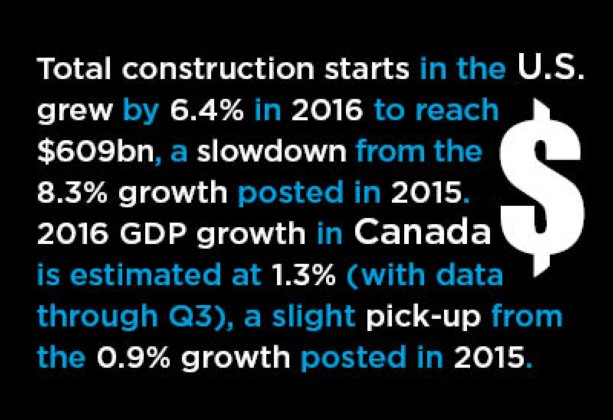
Total construction starts in the US grew by 6.4% in 2016 to reach $609bn, a slowdown from the 8.3% growth posted in 2015.
The non-residential sector provided the main impetus, with growth above 20% in several large categories, including laboratories, retail, parking garages and sports stadiums. New residential construction increased by 5.6%, as a 7.9% increase in single-family construction more than offset a small decline in the construction of apartment buildings. Ground breaking on engineering projects posted a small contraction of 0.4%, the result of steep declines in starts of dams, canals and marine infrastructure, power infrastructure and miscellaneous civil projects. This came against a backdrop of slower economic growth; GDP grew by 1.6% in 2016 as a whole.
North of the border, Canadian construction starts plummeted by 25.2% in 2016, following an annual decline of nearly 10% in the previous year. Shrinking investment in the mining sector dragged down civil engineering starts by 34.6%, and construction of bridges and power infrastructure also saw steep declines as mega-projects in 2015 dropped out of the annual growth equation. Residential starts posted a shallower contraction of 0.7%, but non-residential building starts fell steeply by 37.5%.
US year in review
US economic activity began 2016 on a relatively downbeat note – GDP grew by a disappointing 0.8% annualized in Q1, following a similar rise in Q4 2015. GDP growth picked up to 1.4% in Q2, but a strong rebound in output was not seen until Q3, with GDP rising by 3.5% on the quarter. For 2016 as a whole, GDP grew by 1.6%, a slowdown from the 2.6% growth posted in 2015. A number of factors were behind the weak start to the year. First, the persistent strength of the dollar weighed on external competitiveness, dampening exports, while export growth was further constrained by subdued global demand. Finally, supply chain ripple effects from low investment in the oil and gas sector dampened wider business investment, as did general uncertainty in the lead-up to the presidential election. Exports grew by just 0.4% in 2016 while business investment contracted. By contrast, developments in the household sector were broadly favorable. The economy added an average of 180,000 jobs per month and wage growth was firming through the course of the year. These developments underpinned a solid 2.7% increase in consumer spending in 2016. Weak economic activity at the beginning of the year delayed a rise in the federal funds rate until December, when the Federal Reserve raised its benchmark interest rate by 25 basis points.
New construction activity also decelerated in 2016 – total construction starts grew by 6.4% in 2016, down from 8.3% growth in 2015. Residential construction growth slowed to 5.6%, down from 12.9% in 2015. Within the residential segment, single-family construction starts were stronger than multi-family starts. Single-family starts grew by 7.9% in 2016, boosted by demographic factors as the millennial generation has started to reach household formation age. In addition, the potential for catch-up in the single-family segment is still large – single-family starts in 2016 were still nearly 45% below their 2005 peak. The multi-family segment has generally performed better since the global financial crisis, driven by a preference for urban living. However, high rents and household formation among millennials mean that multi-family starts have been less robust in recent years – they contracted by 1.5% in 2016.
By contrast, new construction in the non-residential sector improved in 2016 – non-residential building grew by 10.9%, up from 4.5% growth in 2015. Several sub-segments, including retail, parking garages and sports stadiums, grew by more than 20%. Construction of laboratories was particularly strong, driven by a large project in North Carolina earlier in the year. Medical-related sectors, such as hospitals, nursing homes and miscellaneous medical, also grew strongly. As the baby-boomer generation ages, demand for medical facilities is likely to grow, and in 2016 at least, growth was likely boosted by stronger demand resulting from the Affordable Care Act, although in the current political environment, there is likely to be significant uncertainty surrounding the healthcare sector. Factory construction, by contrast, performed less well, shrinking by 13.2% in 2016. This is consistent with the weakness seen in US manufacturing output in 2016, the result of a strong dollar and anemic global demand. Moreover, manufacturing construction tends to be dominated by large-scale projects, so its growth from year to year can be quite volatile.
Civil engineering construction starts posted a small decline (of 0.4%) in 2016, the result of steep declines in starts of dams, canals and marine infrastructure, power infrastructure and miscellaneous civil projects. The decline in construction of power infrastructure was likely a normalization following a few mega-projects in 2015, while the miscellaneous civil engineering sub-segment includes oil and gas infrastructure, so it is unsurprising that this declined given shrinking capex in the sector. Airport construction starts, however, posted strong growth of 54.6%, with a number of large projects breaking ground in 2016 in Georgia, North Carolina and Hawaii in particular.
Among the four major regions, 2016 construction starts were strongest in the South and Midwest, with growth of 13% and 9.5% respectively. Construction in the South likely reflects the region’s strong demographics plus significant scope for catch-up growth following the global financial crisis. Starts were particularly strong in Washington, DC, growing by more than 100%, but were also robust in larger states such as Florida, Georgia and North Carolina. The strength in the Midwest was perhaps more surprising given its less robust demographics and lower economic activity. Strength in the region was concentrated in the rustbelt states, particularly in Indiana, Ohio, Wisconsin, Michigan and Minnesota. There were steep declines in construction starts in the Dakotas, likely related to the slowdown in oil investment, but these states are much smaller. The decline in the Northeast was led by steep declines in New York, but that follows high levels of construction activity in 2014-15. Moreover, construction in the Northeast was less heavily impacted by the global financial crisis, so the scope for catch-up growth is limited. Construction broadly stagnated in the West, which is particularly surprising given the regions’ strong demographics and robust growth in economic activity.
Canada year in review
2016 GDP growth in Canada is estimated at 1.3% (with data through Q3), a slight pick-up from the 0.9% growth posted in 2015. The Canadian economy started 2016 on a strong note, but wildfires in northern Alberta in Q2 led to a retreat in oil production that materially affected GDP growth. Business activity was muted through the year, constrained by weak capex in the oil and gas sector. Exports growth was also slow, as the impact of low external demand offset the boost from a competitive Canadian dollar. Although the economy continued to add jobs through 2016, gains were concentrated in part-time work, and there was only modest growth in real wages. Despite this, consumer spending rose by a steady 2.2%
New construction activity in Canada was extremely weak. Total construction starts fell by 25.2% in 2016 following a decline of nearly 10% in the previous year. Falling construction was seen across the three major sub-segments of residential, non-residential and civil engineering. Starts of non-residential buildings declined by a staggering 37.5% in 2016, with contractions seen across all non-residential sub-sectors (only government office construction expanded in 2016). Some segments, such as hospitals, transportation terminals, parking garages, hotels and education had grown strongly in 2015. Since starts numbers can be so volatile from year-to-year, 2016 is likely a normalization following 2015’s strength. Nonetheless, construction in other segments has been weak for some time. Factory construction, for example, fell by more than 30% in both 2015 and 2016, suggesting there has been little boost from the weak Canadian dollar with respect to exports of manufactured goods.
Civil engineering construction continued to collapse, falling by 34.6% in 2016, after a 25.5% decline in 2015, with all major engineering sectors contracting. Shrinking oilfield investment has hit the miscellaneous civil category in both 2015 and 2016; after shrinking by 73.8% in 2015, it retreated a further 29.8% in 2016. The decline in other segments, such as power infrastructure and bridge construction, are less concerning, because a number of mega-projects broke ground in these sectors in 2015.
Residential construction was the strongest of the three headline sectors of construction, shrinking by a more modest 0.7%, as growth in the single-family segment was more than offset by a decline in multi-family construction starts.
This report was written by Abby Samp of Oxford Economics.
2016 Year-end review
| US | Northeast | Midwest | South | West | US Total | ||||||
| 2016 level | 2016 growth | 2016 level | 2016 growth | 2016 level | 2016 growth | 2016 level | 2016 growth | 2016 level | 2016 growth | ||
| Macro variables | |||||||||||
| GDP (billions 2009 US$) | 3,353 | 1.4% | 3,134 | 1.0% | 5,810 | 1.4% | 4,126 | 2.6% | 16,665 | 1.6% | |
| Population (millions) | 56.5 | 0.3% | 64.2 | 0.4% | 121.4 | 1.1% | 76.8 | 1.1% | 324.0 | 0.8% | |
| Unemployment rate (%) | 4.8% | – | 4.7% | – | 4.8% | – | 5.2% | – | 4.8% | – | |
| Construction starts (millions US$) | |||||||||||
| Total starts | 83,341 | -7.3% | 108,767 | 9.5% | 282,278 | 13.0% | 134,822 | 0.7% | 609,208 | 6.4% | |
| Residential | 26,386 | -13.1% | 34,727 | 20.1% | 124,352 | 7.2% | 58,065 | 4.9% | 243,531 | 5.6% | |
| Non-residential building | 38,894 | 0.1% | 47,441 | 19.8% | 105,976 | 21.3% | 50,700 | -4.8% | 243,011 | 10.9% | |
| Civil engineering | 18,061 | -12.5% | 26,599 | -13.7% | 51,949 | 12.0% | 26,057 | 3.0% | 122,666 | -0.4% | |
| Canada | Atlantic Region | Central Canada | Prairies | British Columbia | Canada Total | ||||||
| 2016 level | 2016 growth | 2016 level | 2016 growth | 2016 level | 2016 growth | 2016 level | 2016 growth | 2016 level | 2016 growth | ||
| Macro variables | |||||||||||
| GDP (billions 2007 C$) | 97 | 0.5% | 1,022 | 2.2% | 433 | -1.5% | 232 | 3.0% | 1,793 | 1.3% | |
| Population (millions) | 2.4 | 0.4% | 22.3 | 1.0% | 6.7 | 1.6% | 4.7 | 1.1% | 36.2 | 1.1% | |
| Unemployment rate (%) | 10.1% | – | 6.8% | – | 7.5% | – | 6.1% | – | 7.0% | – | |
| Construction starts (millions C$) | |||||||||||
| Total starts | 3,030 | 9.9% | 35,767 | -16.6% | 18,705 | -13.9% | 9,971 | -56.4% | 67,474 | -25.2% | |
| Residential | 707 | -5.5% | 15,858 | 6.6% | 4,528 | -5.3% | 5,560 | -13.5% | 26,653 | -0.7% | |
| Non-residential building | 995 | 13.9% | 7,101 | -24.4% | 3,163 | -51.8% | 1,964 | -54.4% | 13,223 | -37.5% | |
| Civil engineering | 1,328 | 17.0% | 12,808 | -31.1% | 11,014 | 6.2% | 2,448 | -79.8% | 27,597 | -34.6% | |


Recent Comments
comments for this post are closed