Construction material costs in both the U.S. and Canada have generally been soft over the past several years. There is evidence that a noticeable updraft is in the winds.
One primary source for building material costing data in the U.S. is to be found in the monthly Producer Price Index (PPI) results published by the Bureau of Labor Statistics (BLS).
For Canada, the sources are the Industrial Product Price Index (IPPI) and the Raw Materials Price Index (RMPI) series generated by Statistics Canada.
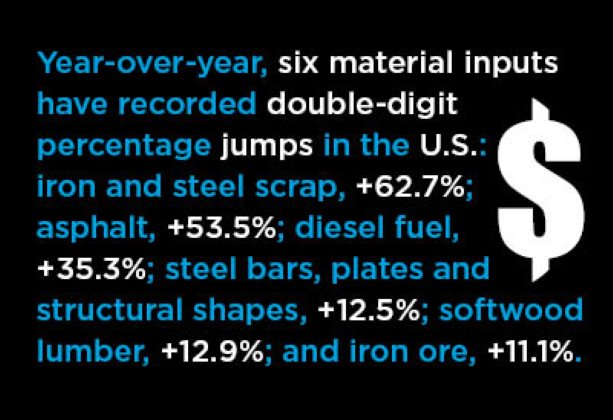
U.S. data will be examined first. Table 1 sets out numerous material cost changes over varying time frames. With respect to year-over-year movements, six material inputs have recorded double-digit percentage jumps: iron and steel scrap, +62.7%; asphalt, +53.5%; diesel fuel, +35.3%; steel bars, plates and structural shapes, +12.5%; softwood lumber, +12.9%; and iron ore, +11.1%.
% Change in the March 2017 Index from:
| 3 Years | 1 Year | 6 months | 3 months | 1 month | |||||
| Ago | Ago | Ago | Ago | Ago | |||||
| Product/Good/Service/Commodity | |||||||||
| Final Demand Construction | 4.5% | 1.5% | 1.1% | 0.3% | 0.2% | ||||
| Construction for private capital investment | 4.6% | 1.6% | 1.1% | 0.3% | 0.2% | ||||
| Construction for Government | 4.4% | 1.2% | 1.1% | 0.5% | 0.1% | ||||
| New warehouse building construction | 5.5% | 2.4% | 1.6% | 0.6% | 0.1% | ||||
| New school building construction | 4.0% | 0.9% | 1.2% | 0.6% | 0.0% | ||||
| New office building construction | 6.1% | 2.3% | 1.3% | 0.5% | 0.3% | ||||
| New industrial building construction | 3.7% | 0.5% | 1.1% | 0.0% | 0.0% | ||||
| New health care building construction | 1.7% | 0.2% | 0.3% | -0.4% | 0.0% | ||||
| Architectural & engineering services | 7.8% | 3.1% | 1.8% | 1.8% | -0.4% | ||||
| Construction machinery & equipment | 3.3% | 0.9% | 0.7% | 0.6% | 0.2% | ||||
| Asphalt | -32.8% | 53.5% | 29.5% | 24.6% | 11.3% | ||||
| Plastic construction products | 1.0% | 1.8% | 0.8% | 0.6% | -0.1% | ||||
| Softwood lumber | 2.9% | 12.9% | 6.9% | 7.1% | 2.3% | ||||
| Hardwood lumber | -8.7% | 3.0% | 0.2% | -0.9% | 0.5% | ||||
| Millwork | 6.0% | 2.2% | 1.4% | 1.3% | 0.6% | ||||
| Plywood | -1.3% | 2.3% | 0.2% | 4.4% | 3.2% | ||||
| Gypsum | 4.7% | 7.6% | 4.9% | 5.3% | -0.8% | ||||
| Insulation materials | 1.1% | -1.2% | 0.7% | 0.2% | -0.1% | ||||
| Construction sand, gravel & crushed stone | 11.9% | 3.0% | 2.5% | 1.4% | -0.3% | ||||
| Cement | 20.3% | 4.8% | 2.0% | 3.0% | -0.5% | ||||
| Ready-mix concrete | 12.0% | 3.3% | 1.6% | 1.0% | 0.2% | ||||
| Precast concrete products | 10.0% | 2.0% | 2.0% | 1.8% | 0.7% | ||||
| Prestressed concrete products | 12.6% | -2.5% | -0.1% | 0.0% | 0.1% | ||||
| Brick (clay) | 3.6% | 1.0% | 1.1% | 0.2% | 0.9% | ||||
| Coal | -2.9% | 4.6% | 6.1% | 2.8% | 0.1% | ||||
| Iron ore | -7.6% | 11.1% | -6.6% | 2.2% | 0.0% | ||||
| Iron and steel scrap | -15.9% | 62.7% | 43.2% | 23.0% | 6.9% | ||||
| Steel bars, plates and structural shapes | -12.6% | 12.5% | 7.0% | 6.0% | 1.4% | ||||
| Fabricated structural metal products | 1.1% | 2.6% | 0.4% | 0.4% | 0.7% | ||||
| Flat glass | 10.8% | 1.8% | 0.4% | 0.3% | 0.1% | ||||
| Lighting fixtures | 3.8% | 1.1% | 1.2% | 1.1% | 0.5% | ||||
| Plumbing fixtures & brass fittings | 3.7% | 1.0% | 0.8% | 0.8% | 0.1% | ||||
| Heating equipment | 5.5% | 1.8% | -0.2% | 0.5% | 0.0% | ||||
| Copper wire & cable | -14.1% | 6.0% | 13.9% | -0.8% | -0.6% | ||||
| Fiber optic cable | -0.7% | -0.5% | -0.5% | 0.0% | 0.0% | ||||
| Regular gasoline unleaded | -44.6% | 35.7% | 8.6% | 5.8% | -1.5% | ||||
| Diesel Fuel | -49.2% | 35.3% | -0.9% | 2.7% | -1.0% | ||||
| Jet Fuel | -43.4% | 46.3% | 15.0% | 7.5% | 0.2% | ||||
| Natural gas | -53.5% | 51.7% | -13.5% | -29.0% | -30.0% | ||||
| Natural gas to electric utilities | -22.8% | 2.1% | -3.2% | -8.6% | -9.6% | ||||
| Commercial electric power | 2.2% | 2.5% | -4.1% | 1.6% | 0.5% | ||||
| Industrial electric power | 9.3% | 14.8% | 2.9% | 9.2% | 0.6% | ||||
| Residential electric power | 5.6% | 3.0% | -1.0% | 3.0% | 0.4% | ||||
| Commercial natural gas | -12.9% | 14.7% | 6.7% | 1.9% | -1.6% | ||||
| Industrial natural gas | -27.7% | 7.0% | 2.3% | -2.8% | -7.0% | ||||
| Residential natural gas | -12.9% | 12.3% | 3.0% | 1.5% | -0.3% | ||||
| Construction materials | 2.8% | 3.7% | 1.9% | 1.8% | 0.6% |
Table: ConstructConnect.
Three of the six have seen particularly active price adjustments lately. Asphalt in March was +24.6% quarter to quarter and +11.3% month to month; iron and steel scrap was +23.0% quarter to quarter and +6.9% month to month; and softwood lumber was +7.1% quarter to quarter and +2.3% month to month.
Percentage changes – because they can be outsized if the denominator is low – aren’t always the best indicators of trends. Graphs 1 to 12 tell a more complete story.
The cost of softwood lumber (Graph 1) in the U.S. has been on a barely perceptible upward walkway from 2000 at the turn of the millennium to the present, but it has been on a more apparent climb since the midway point of 2009 at the end of the Great Recession.

Chart: ConstructConnect.
The price of plywood (Graph 2) has been inching higher over the past 17 years, although it has settled down over the last little while.

Chart: ConstructConnect.
Relieved by some occasional periods of moderation, the price of gypsum (Graph 3) has kept marching skyward.

Chart: ConstructConnect.
The price of insulation material (Graph 4) has moved tightly along a rising incline.

Chart: ConstructConnect.
Cement (Graph 5) and ready-mix concrete (Graph 6) prices are slowly but surely striding upward sloping paths.

Chart: ConstructConnect.

Chart: ConstructConnect.
As components of steel production, coal (Graph 7) has been no cause for concern for half a decade, but the iron and steel scrap price index (Graph 8) has been showing burgeoning life over the past 12-15 months. The net effect is that the ‘steel bars, plates and structural shapes’ index (Graph 9) is tentatively sending up shoots.

Chart: ConstructConnect.

Chart: ConstructConnect.

Chart: ConstructConnect.
The same is true for ‘copper wire and cable’ (Graph 10), where a long decline has come to a halt and a mild uptick is underway.

Chart: ConstructConnect.
The asphalt price index (Graph 11), despite an enormous year-over-year percentage gain, remains deeply depressed, for now. The same can be said for the diesel fuel price index, which is not shown here.

Chart: ConstructConnect.
Flat glass (Graph 12) marks a return to a construction building material that is on a clear ascending trajectory.

Chart: ConstructConnect.
For the U.S., all of the individual material results are summarized in eight special indices (Table 1) that focus on the cost of construction. As of March 2017, the building material cost index for ‘final demand construction’ was +1.5%. ‘Construction for private capital investment’ was +1.6% and ‘for government’, +1.2%.
According to ‘types of structure’, the lowest year-over-year increases in material costs were for new ‘health care buildings’, +0.2%; ‘industrial buildings’, +0.5%; and ‘school buildings’, +0.9%.
The highest year-over-year gains in building material costs were for ‘warehouse buildings’, +2.4%; and ‘office buildings’, +2.3%.
In Canada (Table 2), year-over-year double-digit percentage changes in March were recorded in the following IPPI and RMPI price indices: iron ore, +59.1%; asphalt, +47.5%; diesel fuel, +20.0%; and wafer-board and particle board, +15.4%. Softwood lumber, at +9.8%, fell just short of the +10.0% benchmark.
Raw Materials Price Index (RMPI) Results
% Change in the March 2017 Index from:
| 3 Years | 1 Year | 6 Months | 3 Months | 1 Month | |||
| Ago | Ago | Ago | Ago | Ago | |||
| Type of Construction Indices: | |||||||
| Residential | 9.1% | 0.6% | 0.9% | 0.4% | 0.6% | ||
| Non-residential Building | 7.4% | 0.4% | 1.1% | 0.4% | 0.6% | ||
| Engineering/Civil | 0.0% | 4.8% | 3.5% | 2.2% | 1.1% | ||
| Total Construction | 5.1% | 2.1% | 1.9% | 1.1% | 0.8% | ||
| Key Aggregates: | |||||||
| Lumber and other wood products | 8.9% | 3.8% | 1.3% | 1.2% | 0.7% | ||
| Primary ferrous metal products | -2.3% | 10.1% | 3.0% | 3.4% | 1.2% | ||
| Primary non-ferrous metal products | 10.5% | 11.6% | 5.1% | 5.0% | 2.0% | ||
| Fabricated metal products and construction materials | 9.5% | 4.0% | 0.4% | 0.6% | 0.8% | ||
| Machinery and equipment (includes HVAC) | 5.6% | 0.7% | 0.8% | 0.3% | 0.5% | ||
| Electrical, electronic and telecommunications | 8.0% | 0.7% | 1.2% | 0.4% | 0.9% | ||
| Cement, glass, other non-metallic minerals | 4.5% | 0.5% | 1.3% | 1.0% | 0.5% | ||
| Petroleum and coal products | -25.2% | 20.0% | 10.2% | 1.6% | -0.3% | ||
| Chemicals and chemical products | -2.8% | 7.5% | 5.8% | 3.1% | 1.2% | ||
| Construction Inputs: | |||||||
| Softwood lumber (spruce-pine-fir) | 9.1% | 9.8% | 4.3% | 7.0% | 1.4% | ||
| Veneer and plywood | 13.0% | 5.0% | -0.8% | 2.7% | 1.5% | ||
| Waferboard and particle board | 18.8% | 15.4% | 5.7% | 2.8% | 0.9% | ||
| Shakes and shingles and wood siding | 10.9% | 5.7% | 6.5% | 4.3% | 4.8% | ||
| Wood windows and doors | 6.3% | 1.4% | 0.1% | 0.1% | 0.1% | ||
| Glass and glass products (except automotive) | 11.8% | 0.1% | -0.2% | -0.1% | 0.2% | ||
| Ready-mix concrete | 5.0% | 0.4% | 3.8% | 1.3% | 1.0% | ||
| Clay products (brick) | 5.6% | -4.5% | -1.6% | -2.0% | 0.4% | ||
| Fabricated structural metal | 11.3% | 0.3% | -0.7% | -0.3% | 0.7% | ||
| Prefabricated metal buildings | 31.4% | 9.0% | 5.2% | 3.5% | 1.9% | ||
| Metal windows and doors | 6.4% | -0.3% | -1.1% | -1.1% | -1.1% | ||
| Metal roofing | 12.3% | 7.6% | 5.8% | 5.8% | 5.8% | ||
| Bolts, nuts, screws, washers, fasteners | 15.5% | 0.9% | 0.1% | 0.1% | 0.2% | ||
| Hardware | 10.3% | 0.3% | -0.2% | -0.1% | 0.2% | ||
| Plastic pipe fittings | 14.4% | -0.1% | -0.1% | -0.1% | 0.0% | ||
| Plastic plumbing fixtures | 7.8% | 1.6% | 1.7% | 1.4% | 0.3% | ||
| Electric lamps, lighting fixtures | -2.2% | -0.1% | -0.5% | 0.0% | 0.0% | ||
| Concrete pipes and fittings | -7.5% | -1.4% | -0.5% | 0.6% | 0.2% | ||
| Asphalt | -14.7% | 47.5% | 14.3% | 28.5% | 10.1% | ||
| Gasoline (regular) | -25.7% | 16.2% | 5.2% | 0.0% | 0.3% | ||
| Diesel fuel | -30.6% | 20.0% | 13.9% | -0.6% | -1.7% | ||
| Natural gas | -25.7% | 12.4% | 6.1% | 0.3% | 0.0% | ||
| Gypsum | 26.2% | 8.9% | 7.1% | 5.7% | 1.3% | ||
| Iron ore | -5.4% | 59.1% | 54.8% | 10.4% | 0.9% | ||
| Stone | 5.4% | 2.3% | 2.3% | 2.3% | 0.0% |
Table: ConstructConnect.
Canadian individual building product results are shown in Graphs 13 through 20.
A second straight-line slope representing 2000 to 2017 overriding patterns has been fitted to each curve. Similar to what has occurred in the U.S., the resulting trend lines are upward sloping for softwood lumber (Graph 13); veneer and plywood (Graph 14); gypsum (Graph 15); ready-mix concrete (Graph 16); fabricated structural metal (Graph 18); and glass and glass products (Graph 20).
For the other two products/commodities, iron ore (Graph 17) and asphalt (Graph 19), the trend lines have been sloping downwards since 2000. In both instances, however, the most recent performances of the actual index values have featured revivals.

Chart: ConstructConnect.

Chart: ConstructConnect.

Chart: ConstructConnect.

Chart: ConstructConnect.

Chart: ConstructConnect.

Chart: ConstructConnect.

Chart: ConstructConnect.

Chart: ConstructConnect.
By the way, these index series reflect prices as the leave a manufacturer’s front gate. Therefore, such influences as Washington imposing a 20% duty on Canadian softwood lumber being shipped across the border play no role.
Summary residential, non-residential building and heavy engineering construction material cost indices have been calculated for Canada, taking into consideration different weightings for the material inputs going into the three types of structures. For example, lumber is a relatively more important component of homebuilding and fossil-fuel-based products play larger roles in heavy engineering work.
The year-over-year results for Canada in March were: residential, +0.6%; non-residential building, +0.4%; and engineering/civil, +4.8%.
The composite construction material cost index for Canada, year over year in the latest month, was +2.1%.






Recent Comments
comments for this post are closed