ConstructConnect is known for its ‘starts’ statistics and forecasts. Twice per year, however, − in early summer and late fall − ConstructConnect also calculates and publishes ‘put-in-place’ construction spending projections.
It helps that the ‘starts’ numbers are leading indicators for the PIP figures.
The history of PIP capital spending is compiled and published by the Census Bureau. A thorough explanation of the differences between ‘starts’ and ‘put-in-place’ is provided at the end of this article.
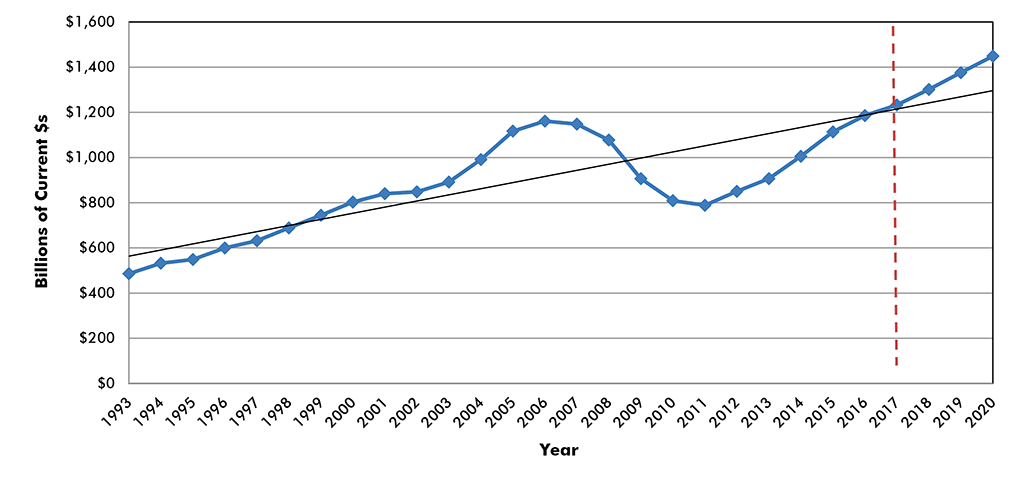
ConstructConnect is now estimating that ‘grand total’ U.S. put-in-place construction spending in 2017, expressed in ‘current’-dollar terms (i.e., not adjusted for inflation), will be $1.233 trillion.
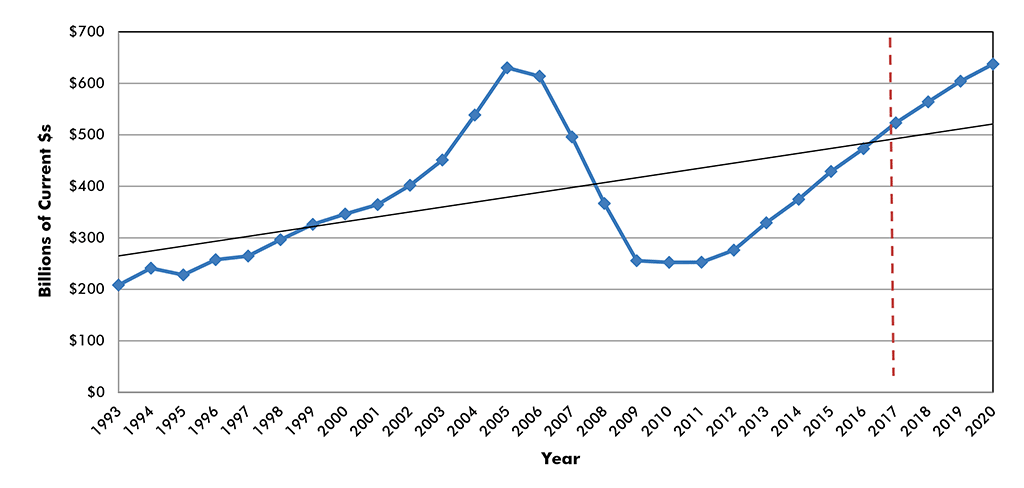
The three major type-of-structure sub-categories will reach the following levels by year-end 2017: residential, $523 billion; nonresidential building, $418 billion; and heavy engineering/civil, $292 billion.
The full-year 2017 over full-year 2016 changes will be as follows: grand total, +4.0% (revised down from +7.2% in ConstructConnect’s previous forecast); residential, +10.6% (revised down from +15.2%); nonresidential building, +2.3% (eased back from +3.0%); and heavy engineering/civil, -4.2% (compared with early-summer’s staying-pat position of +0.3%).
By 2020, ConstructConnect is forecasting that U.S. ‘grand total’ put-in-place construction spending will almost reach $1.5 trillion. The percentage changes from year-to-year in the ‘grand total’, despite significant swings in some of the underlying type-of-structure categories, will be quite consistent, at +5.6% for 2018/2017; +5.7% for 2019/2018; and +5.3% for 2020/2019.
All the dollar volumes and year-over-year percentage changes, 2016 to 2020, are shown in accompanying Table 1.
Table 1: U.S. Construction Spending (put-in-place investment)
(billions of “current” $s)
| Type of Construction: | 2013 | 2014 | 2015 | 2016 | 2017 | 2018 | 2019 | 2020 |
| Grand Total | 906.4 | 1,005.6 | 1,113.6 | 1,185.7 | 1,232.6 | 1,301.3 | 1,375.9 | 1,448.9 |
| (year versus previous year) | 11.0% | 10.7% | 6.5% | 4.0% | 5.6% | 5.7% | 5.3% | |
| Total Residential | 329.2 | 374.9 | 428.8 | 473.2 | 523.3 | 564.1 | 604.2 | 637.4 |
| 13.9% | 14.4% | 10.4% | 10.6% | 7.8% | 7.1% | 5.5% | ||
| Total Nonresidential | 577.1 | 630.8 | 684.9 | 712.5 | 709.2 | 737.2 | 771.7 | 811.5 |
| 9.3% | 8.6% | 4.0% | -0.5% | 3.9% | 4.7% | 5.2% | ||
| Total Commercial/for Lease | 104.6 | 126.2 | 143.3 | 170.8 | 188.1 | 199.3 | 208.7 | 216.9 |
| 20.6% | 13.6% | 19.1% | 10.2% | 5.9% | 4.7% | 3.9% | ||
| Lodging | 13.5 | 16.7 | 21.9 | 26.9 | 29.2 | 30.6 | 30.9 | 30.9 |
| 24.1% | 30.9% | 22.9% | 8.6% | 4.6% | 1.2% | -0.2% | ||
| Office | 38.0 | 46.6 | 55.5 | 67.3 | 71.3 | 75.9 | 80.6 | 84.5 |
| 22.7% | 19.2% | 21.1% | 6.0% | 6.5% | 6.1% | 4.9% | ||
| Commercial/Retail | 53.2 | 62.8 | 65.9 | 76.6 | 87.6 | 92.8 | 97.2 | 101.5 |
| 18.2% | 4.9% | 16.2% | 14.4% | 5.9% | 4.8% | 4.4% | ||
| Total Institutional | 148.1 | 147.9 | 156.2 | 162.0 | 164.9 | 169.9 | 175.9 | 183.1 |
| -0.1% | 5.6% | 3.7% | 1.8% | 3.0% | 3.5% | 4.1% | ||
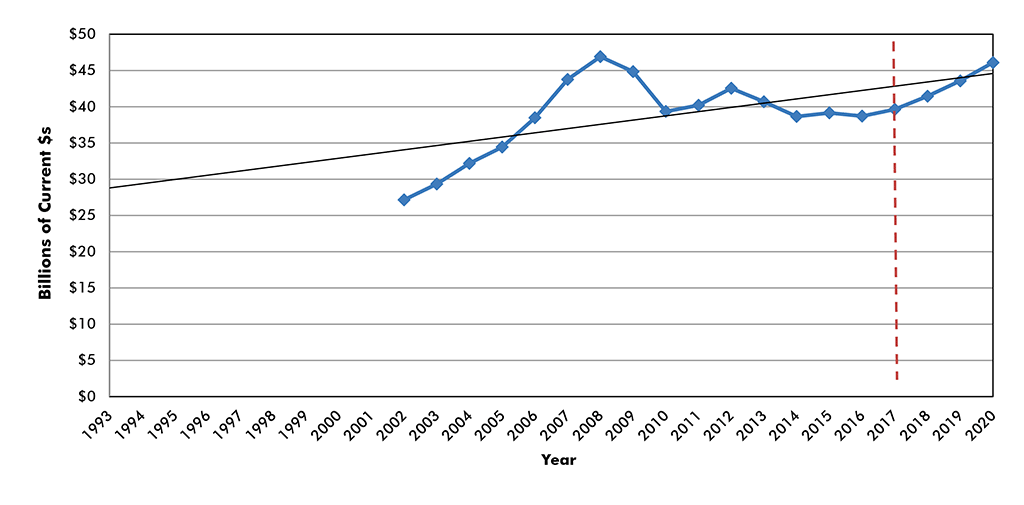
| Health Care | 40.7 | 38.6 | 39.1 | 38.7 | 39.6 | 41.5 | 43.6 | 46.1 |
| -5.0% | 1.3% | -1.1% | 2.4% | 4.6% | 5.1% | 5.8% | ||
| Educational | 79.1 | 79.7 | 84.8 | 89.4 | 90.2 | 91.8 | 94.0 | 96.9 |
| 0.8% | 6.4% | 5.4% | 0.9% | 1.8% | 2.4% | 3.1% | ||
| Religious | 3.6 | 3.4 | 3.6 | 3.5 | 3.2 | 3.1 | 3.0 | 3.1 |
| -5.7% | 5.6% | -2.1% | -9.0% | -4.0% | -1.2% | 2.4% | ||
| Public Safety | 9.5 | 9.4 | 8.5 | 8.0 | 8.1 | 8.6 | 9.2 | 9.8 |
| -0.7% | -10.1% | -5.9% | 1.2% | 6.3% | 7.0% | 7.2% | ||
| Amusement and Recreation | 15.2 | 16.8 | 20.3 | 22.5 | 23.8 | 25.0 | 26.1 | 27.1 |
| 10.3% | 20.8% | 10.8% | 6.1% | 4.8% | 4.4% | 3.9% | ||
| Total Engineering/Civil | 273.9 | 298.0 | 305.4 | 304.4 | 291.7 | 301.7 | 317.2 | 336.4 |
| 8.8% | 2.5% | -0.3% | -4.2% | 3.4% | 5.2% | 6.0% | ||
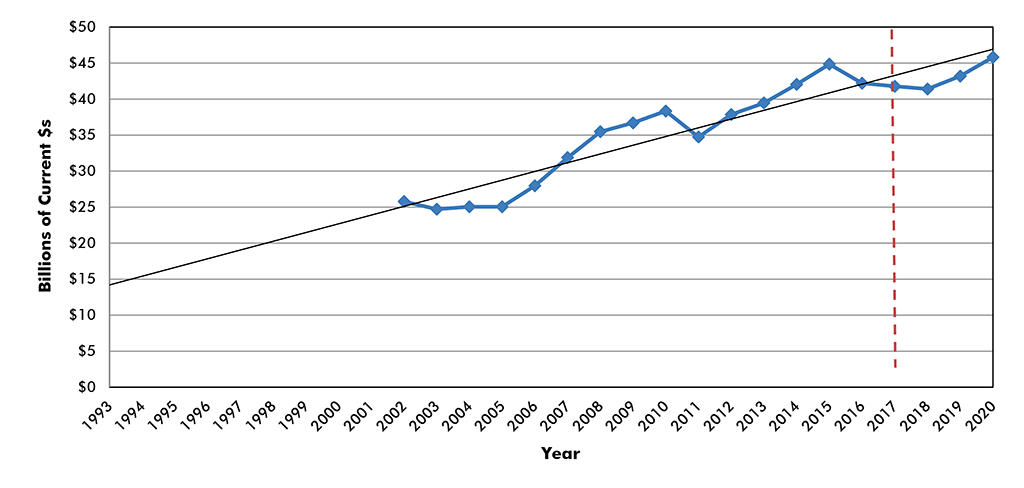
| Transportation | 39.5 | 42.0 | 44.8 | 42.2 | 41.8 | 41.4 | 43.2 | 45.8 |
| 6.5% | 6.7% | -5.9% | -1.0% | -0.9% | 4.3% | 6.1% | ||
| Communication | 17.8 | 17.3 | 21.7 | 22.0 | 23.4 | 24.4 | 25.5 | 26.5 |
| -2.7% | 25.4% | 1.6% | 6.1% | 4.5% | 4.4% | 3.8% | ||
| Power | 93.3 | 110.1 | 103.0 | 105.8 | 102.1 | 108.4 | 115.5 | 123.9 |
| 18.0% | -6.5% | 2.7% | -3.5% | 6.2% | 6.6% | 7.2% | ||
| Highway and Street | 81.4 | 84.7 | 90.6 | 91.4 | 87.0 | 89.9 | 94.3 | 99.8 |
| 4.2% | 6.9% | 0.8% | -4.8% | 3.3% | 4.9% | 5.9% | ||
| Sewage and Waste Disposal | 22.4 | 23.2 | 24.4 | 22.8 | 19.2 | 19.1 | 19.7 | 20.6 |
| 3.3% | 5.2% | -6.6% | -15.8% | -0.2% | 3.2% | 4.4% | ||
| Water Supply | 13.6 | 13.4 | 13.2 | 12.5 | 11.3 | 11.6 | 11.9 | 12.4 |
| -1.6% | -1.7% | -4.8% | -9.5% | 2.4% | 2.9% | 3.8% | ||
| Conservation and Development | 6.0 | 7.3 | 7.7 | 7.7 | 7.0 | 6.9 | 7.0 | 7.4 |
| 22.5% | 5.7% | -0.1% | -9.6% | -1.8% | 2.8% | 4.8% | ||
| Total Industrial/Manufacturing | 50.5 | 58.6 | 79.9 | 75.3 | 64.5 | 66.3 | 69.9 | 75.2 |
| 16.0% | 36.3% | -5.8% | -14.4% | 2.8% | 5.4% | 7.6% |
"Current" means not adjusted for inflation.
Data source: U.S. Census Bureau.
Chart: ConstructConnect.
One of the best ways to gain insight into the forecasts, and to undertake an assessment of whether they seem reasonable or not, is to look at the numbers as they appear when graphed.
Charts 1 through 15 set out the ‘actuals’ and forecasts for almost all the series. In most instances, the ‘actuals’ begin in 1993, but there are also cases where the earliest data is for 2002.
Excel-generated ‘best fit’ linear trend lines have been added to each chart. For some building types (e.g., ‘lodging’ and ‘offices’), there are often wide divergences between ‘actuals’ and trend value in any given year caused by cyclical influences. For others (e.g., ‘power’ and ‘highways and streets’), there have been remarkably close ties between ‘actuals’ and trend over time.
(put-in-place investment)
2017 is an annual estimate based on ‘actuals’ through Q3.
Chart: ConstructConnect
Residential Construction:
The ‘total residential’ construction spending forecasts out to 2020 are continuations of the gradual progress that has been made since 2011. Multi-family groundbreakings have healed nicely since the Great Recession. It’s the single-family market that must now step up.
(put-in-place investment)
2017 is an annual estimate based on ‘actuals’ through Q3.
Chart: ConstructConnect
The answers to two big questions will reveal the prospects for new homebuilding. First, what will be the buying pattern of millennials as they gravitate towards family formation and raising children? Many analysts believe they will move out of city cores in favor of the suburbs.
Such a tidal wave would promote bungalows as opposed to condos. But modern downtown living, with more green space, less pollution, better transit and an elevated number of entertainment venues and cultural events is a vast improvement on the old days. The choice of where to live, as it has so many times in the past, will likely come down to affordability.
The second question that remains to be answered is how much the efforts to restrain immigration, both legal and illegal, will impact housing starts? Almost assuredly there will be some drag.
As for renovation work, which can be as much as 50% of total residential spending, the widespread improvements in jobs and incomes across the U.S. economy will offer further support for existing-home improvements.
Nonresidential Building Construction:
(put-in-place investment)
2017 is an annual estimate based on ‘actuals’ through Q3.
Chart: ConstructConnect
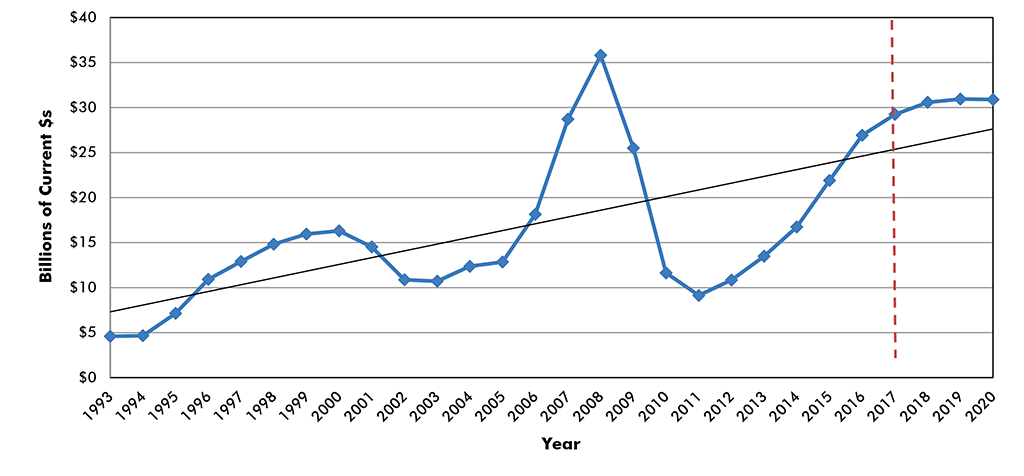
Graph 4 highlights the cyclical nature of capital spending in the accommodation sector. There was a big surge in investment above trend line in 2007 through 2009. More recently, some outsized percentage increases have occurred again. Specifically, 2016 over 2015 was +22.9%.
(put-in-place investment)
2017 is an annual estimate based on ‘actuals’ through Q3.
Chart: ConstructConnect
Attracting business travelers and tourists is a highly competitive proposition. Once one hotel chain begins ‘sprucing up’, or adding to its inventory of rooms, others must climb on board the bandwagon or rapidly lose patrons.
But attention must also be paid to a ‘disruptor’ in the sector. The sharing economy, and enterprises such as Airbnb, are muting demand for hotel and motel rooms, especially with respect to long-term stays.
Lodging construction in 2017 has been winding down to an estimated +8.6% year over year and will decelerate to +4.6% in 2018 and +1.2% in 2019, before flat-lining at -0.2% in 2020.
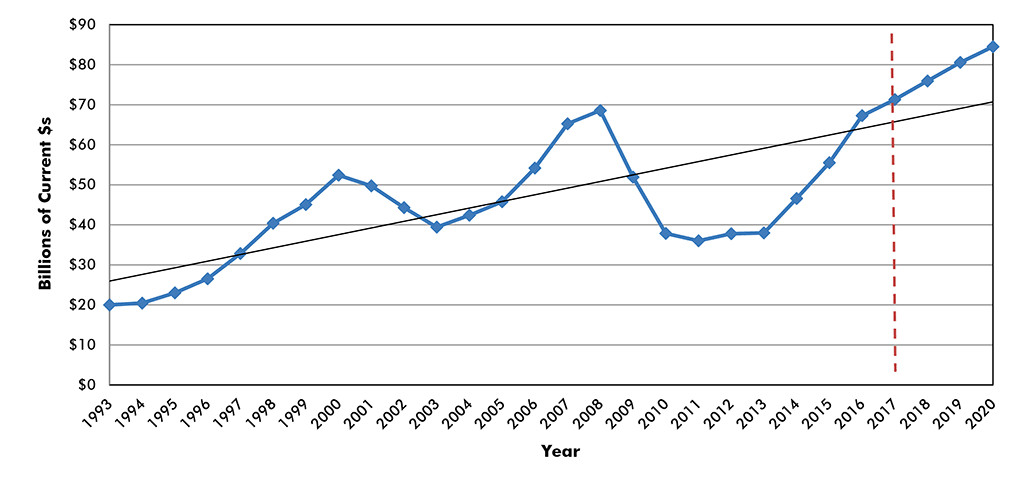
Office tower work, often as part of a mixed-use construction project, has been on the upswing since 2013. ConstructConnect expects more dollar-volume increases to follow out to 2020, but at a slower pace.
(put-in-place investment)
2017 is an annual estimate based on ‘actuals’ through Q3.
Chart: ConstructConnect
There will be continuing demands for new space from within ‘business and professional services’ (e.g., legal, accounting, architectural, engineering and advertising firms). But there is a new standard bearer that is taking on a leadership role in space requirements, the high-tech sector (e.g., companies engaged in writing software for tablets, smart phones and gaming applications.)
The mainstays of financial and insurance services will also contribute mightily to office space demand, although it should also be noted that square footage per worker (i.e., in cubicles) has been shrinking.
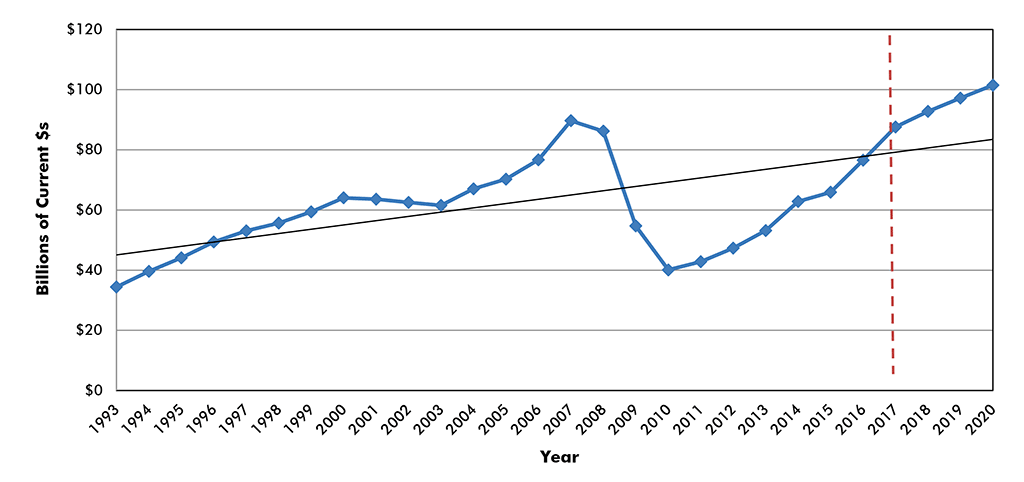
In retail, it’s impossible to avoid the barrage of news about old-line name-brand shopkeepers that failed to properly embrace the opportunities in Internet platforms and have been forced to shutter outlets, accept takeovers by ‘white knights’ or have suffered the ignominy of bankruptcy.
(put-in-place investment)
2017 is an annual estimate based on ‘actuals’ through Q3.
Chart: ConstructConnect
The problem for ‘bricks and mortar’ retail construction won’t just be the dearth of new square footage. More serious will be the overhang of space that will stand empty for long stretches of time before it will be taken up again. (Physical fitness gyms and even car dealerships are moving into some of the abandoned locations, even in malls.)
If ‘bricks and mortar’ retail is suffering, but individuals and families are still spending decently on consumer goods, there must be other delivery systems that are rising in prominence. And, of course, the chief new means to satisfy what customers want is warehouse distribution.
By the way, if you want to see where ‘bricks and mortar’ retail is still thriving, spend time in one of today’s upgraded airports. You won’t find everything you need, but the degree to which you will be able to browse will come as a surprise.
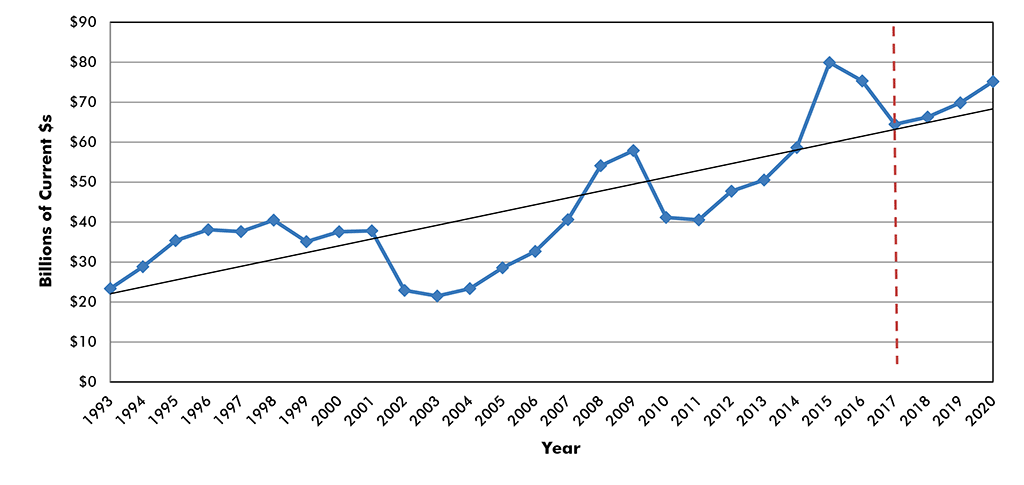
Much of the hope for manufacturing construction resides in the big cut to the corporate tax rate that is currently wending its way through the House and the Senate. Over the past two years, new plant investment has been in decline, -5.8% in 2016 and -14.4% in 2017.
(put-in-place investment)
2017 is an annual estimate based on ‘actuals’ through Q3.
Chart: ConstructConnect
Unfortunately, the capacity utilization rate in the sector has been stuck below the benchmark 80% level that is the first-stage launch pad for investment take-offs. Above 80%, and even more so above 85%, firms begin to think seriously about expanding facilities.
On the plus side, there is a segment of industrial construction – chemical and petrochemical plants – where new project initiations have really been heating up lately. There have been recent mega project groundbreakings for ExxonMobil and Shell in Texas and Pennsylvania.
With respect to manpower requirements in new production-line facilities, however, there is a downside. The proliferation of robotics won’t be diminishing.
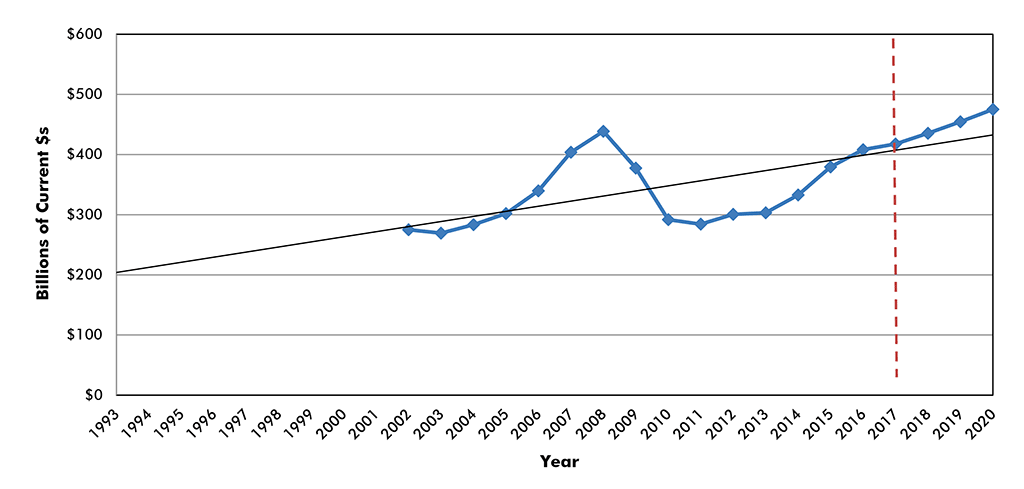
President Obama’s Patient Protection and Affordable Care Act (PPACA) was enacted in 2010. Graph 8 shows that capital spending on health care facilities has been essentially flat since 2010. The uncertainty about the very survival of Obamacare and about the funding available for medical services providers has restrained investment in the sector.
(put-in-place investment)
2017 is an annual estimate based on ‘actuals’ through Q3.
Numbers for this series prior to 2002 are no longer consistent with more current data.
Chart: ConstructConnect
Nor has that uncertainty been removed to this day. Elimination of the ‘mandate’ provision in the tax bill being proposed by the Senate removes a key pillar supporting Obamacare.
But the population is aging and smaller private clinics and out-patient facilities are filling in where larger hospitals remain hesitant to tread. Also, there are some academic institutions that are giving go-aheads to medical facilities that will do double-duty as teaching establishments.
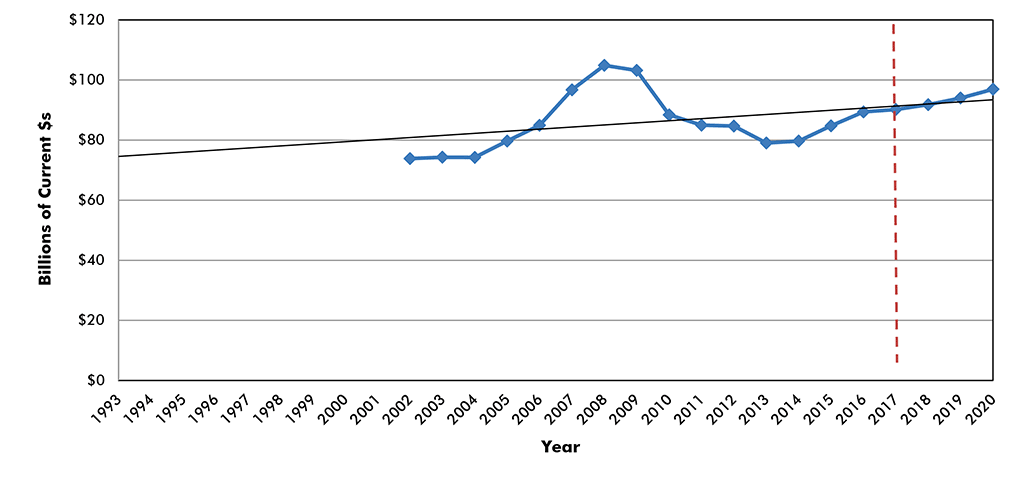
Speaking of universities and colleges, enrollments have been falling. With jobs growth so strong and the unemployment rate so low, many young adults are saying good-bye to the halls of academia and going directly into the work force.
(put-in-place investment)
2017 is an annual estimate based on ‘actuals’ through Q3.
Numbers for this series prior to 2002 are no longer consistent with more current data.
Chart: ConstructConnect.
There are some counter-forces at play helping to keep investment at the level of higher education brisk if not exuberant. Ivy league schools and other top-flight institutions have endowment funds that are piling up massive financial assets (on paper at least) thanks to stock markets that have been soaring.
Also, the number of joint-venture private sector and academic-community research facilities continues to climb. Infusions of cash support new laboratories and lecture halls.
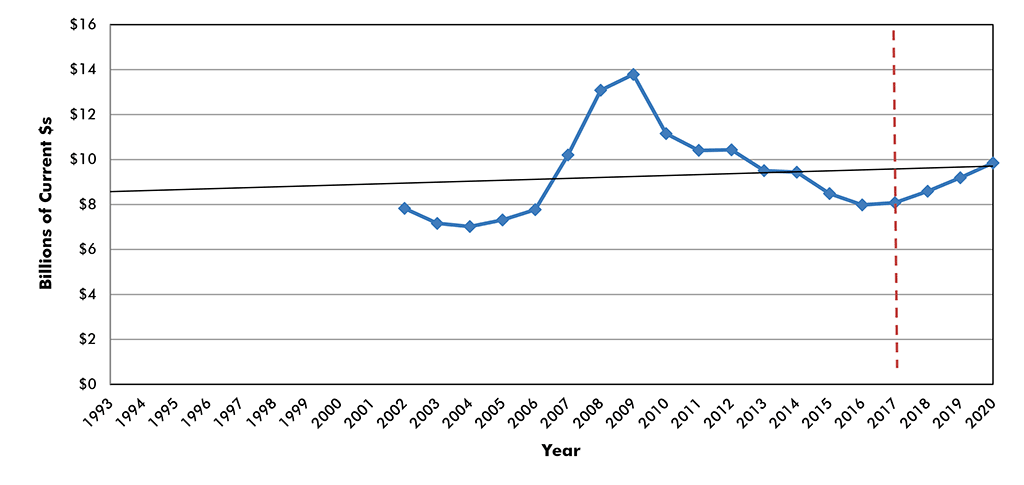
While Graph 10 shows drop offs in ‘public safety’ construction since 2009, that is about to change. ConstructConnect’s starts statistics have 2017 year-to-date volumes for both courthouses and prisons up sharply, +112% and +54% respectively versus the same January-to-October periods of 2016.
(put-in-place investment)
2017 is an annual estimate based on ‘actuals’ through Q3.
Numbers for this series prior to 2002 are no longer consistent with more current data.
Chart: ConstructConnect
The Trump Administration has ramped up crackdowns on people in the country without proper documentation. An increased need for holding cells to house such individuals prior to expulsion is also leading to a comeback in private as opposed to public detention facilities. (When the Democrats were in the White House, private jailing fell out of favor.)
Engineering Construction:
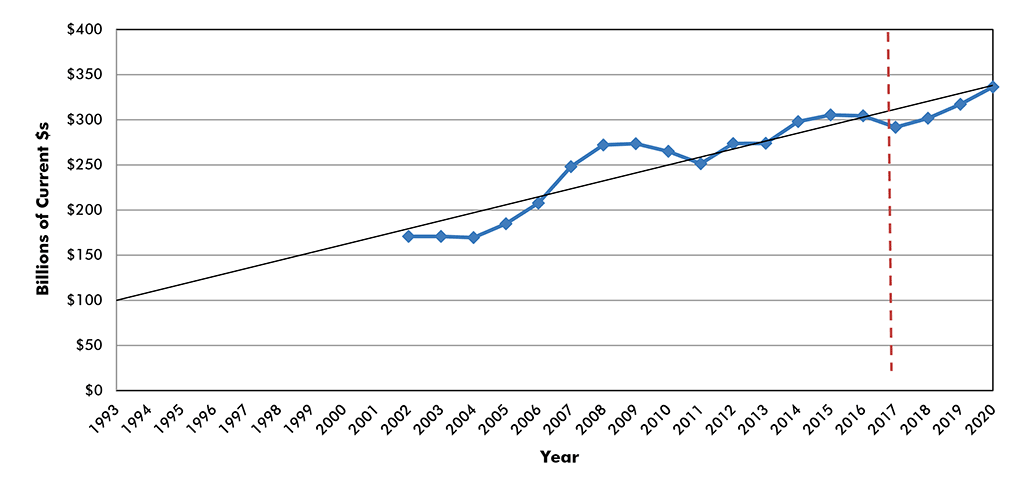
Municipalities are finding it difficult to raise the money needed for rapid transit projects. Taxpayers, thanks to solid gross domestic product (GDP) growth, are becoming increasingly prosperous. But that doesn’t mean they’re not continuing to keep a tight hold on their purses and wallets. They’re still saying ‘no’ to fund-raising propositions and referendums.
(put-in-place investment)
2017 is an annual estimate based on ‘actuals’ through Q3.
Numbers for this series prior to 2002 are no longer consistent with more current data.
Chart: ConstructConnect
But there’s a significant corner of ‘transportation’ (Graph 12) where investment boundaries are being breached regularly. Almost every major airport has a multi-billion-dollar expansion plan in place. The money – most of which is not dependent on government sources, but rather flows from airline and passenger fees and retail leases − is being earmarked for new gates, runways, maintenance and repair hangars, de-icing facilities, parking structures and access roads and highways.
(put-in-place investment)
2017 is an annual estimate based on ‘actuals’ through Q3.
Numbers for this series prior to 2002 are no longer consistent with more current data.
Chart: ConstructConnect
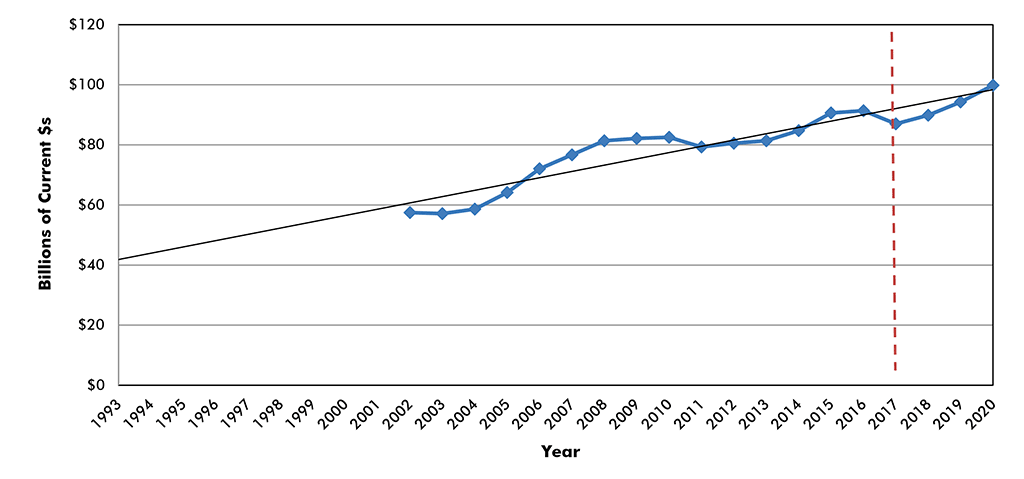
Graph 13, setting out capital spending on highways and streets, will likely surprise some readers. From 2003 to the present, the annual figure has stayed quite consistent with its gradually inclining trend line. Departures from the trend line, either up or down, have been minor.
(put-in-place investment)
2017 is an annual estimate based on ‘actuals’ through Q3.
Numbers for this series prior to 2002 are no longer consistent with more current data.
Chart: ConstructConnect
The consistency has been despite numerous times when funding at the federal level for highways, roads and bridges has been on shaky ground. Until passage of the FAST Act (Fixing America’s Surface Transportation Act) in 2015, the roadbuilding sector was dependent on nearly continual rollovers of temporary financing fixes.
Helping to fund roadbuilding going forward, several states have managed to legislate increases in their gasoline fuel-usage taxes. A hiking of the federal gas tax, which has been a constant 18.4 cents per gallon since 1997, is also warranted but there are no signs it’s on Washington’s agenda.
Everyone knows the importance of building and repairing transportation infrastructure. Both productivity (i.e., moving people and cargo faster) and safety issues are at play. But it’s a matter of meshing the ‘will’ with the ‘means’.
In portions of the country, however, there are no options other than to take direct and speedy action. Hurricanes Harvey and Irma damaged big chunks of Texas and Florida and California has faced trial by forest fire.
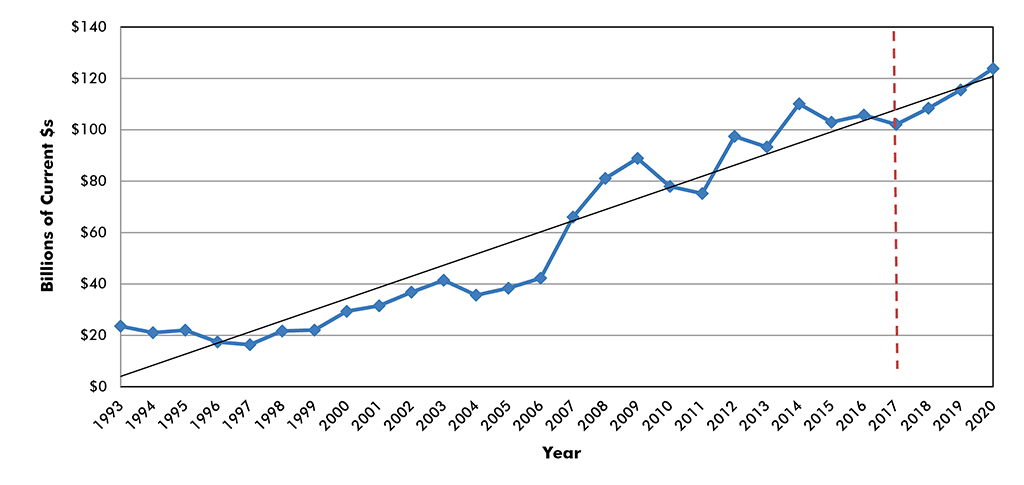
Spending on the ‘power’ category, which mainly consists of oil and gas projects, plus electric power generating stations and transmission lines, has a nicely rising pattern over the long-term in Graph 14.
(put-in-place investment)
2017 is an annual estimate based on ‘actuals’ through Q3.
Chart: ConstructConnect
Energy development by means of hydraulic fracturing, if it is given even the tiniest of breaks on the crude and natural gas pricing fronts, can quickly turn into a boom. Washington is far more amenable to fossil fuel extraction than was the previous regime. This has been most clearly shown by President Trump endorsing both the Dakota Access and Keystone XL pipeline projects.
In 2002, there was a higher dollar volume of spending on ‘highways and streets’ in America than on ‘power’, $60 billion relative to $40 billion. During the intervening years up to the present, the relationship between the two type-of-structure categories has flipped over. In 2017, ‘power’ at $100 billion, will account for more investment spending than ‘highways and streets’, at a little less than $90 billion.
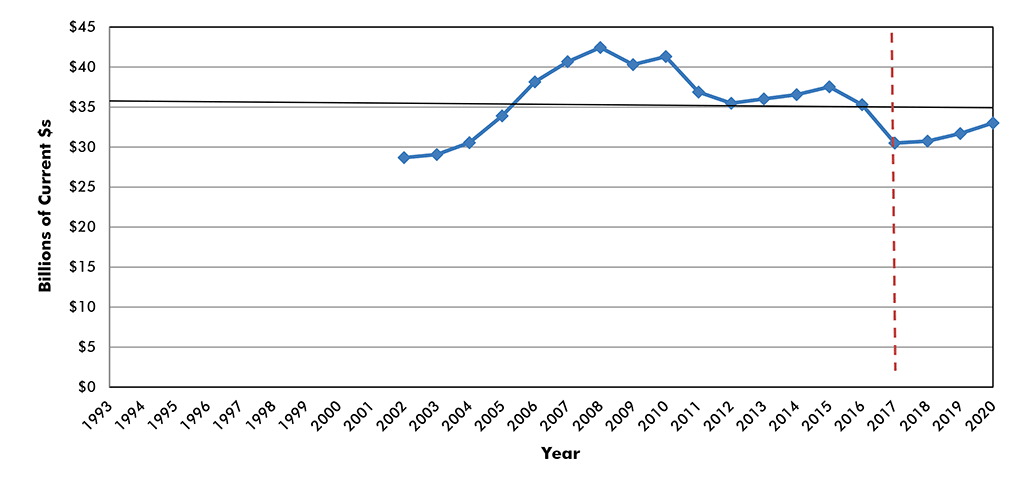
Finally, there is capital spending on ‘water supply plus sewage and waste disposal’ work to consider. Graph 15 combines the two sub-categories. It’s amazing to notice that over the past 15 years, from 2002 to 2017, the put-in-place dollars in this segment of the construction market have ended up where they started. They are $30 billion now and they were $30 billion then.
(put-in-place investment)
2017 is an annual estimate based on ‘actuals’ through Q3.
Numbers for this series prior to 2002 are no longer consistent with more current data.
Chart: ConstructConnect
There was a period from 2007 to 2010 when they did percolate a little higher, to $40 billion or slightly more annually. Turning to the forecast years, 2018 to 2020, it’s hard to imagine that with ongoing economic and population growth, combined with progressively improving housing starts, spending on water delivery and sewage projects can do anything but stabilize and begin to ascend.
Put-in-place versus ‘Starts’
ConstructConnect gathers and publishes ‘starts’ statistics. And calculates and posts forecasts of the ‘starts’ data.
Customers often confuse the ‘starts’ and the government’s put-in-place investment numbers.
The following discusses ‘starts’ versus capital spending in more detail.
The Census Bureau’s put-in-place (PIP) statistics are like progress payments or ‘work-in-process’ payments as a project proceeds.
ConstructConnect’s figures are built-up. They are based on specific project-value estimates, with the full dollar amount (and square footage) entered at the beginning. (That’s why they are sometimes described as ‘lumpy’.)
Consider a $60 million office tower for which ground was broken in June 2017. It would appear in the Census Bureau’s numbers as spending of approximately $15 million this year; $25 million next year; and the final $20 million in 2019.
For ConstructConnect’s starts, the whole estimated value ($60 million) would be entered in June 2017.
Due to the staged timing, inflation is more likely to enter into the PIP numbers.
Graphs of the starts lead the PIP investment numbers. A cyclical peak for starts will appear before a cyclical peak for the PIP series. The same goes for cyclical troughs.
The starts are also more volatile (i.e., because they are ‘lumpy’). Their cyclical swings are far greater. In technical terms, their amplitudes are wider.
What is perhaps most important to understand, however, is that the volume of starts is unlikely to ever ascend to the same lofty heights as the PIP numbers.
The chief reason is because the PIP numbers must cover the ‘universe’. The Census Bureau makes estimates, or what are called ‘imputations’, to fill in all the blanks.
The Census Bureau is required to generate all-encompassing numbers to support two crucial line items − i.e., investment in residential and nonresidential structures – in the nation’s gross domestic product (GDP) calculation.
ConstructConnect’s starts, being based on actual planned projects discovered and documented and entered into an extensive database by its teams of researchers, are ‘solid’ but not all inclusive.
Furthermore, ConstructConnect makes no estimations for missing material. And certain owners won’t reveal the extent of what they are building.
Most important, renovation work is difficult to identify. To understand how significant this is, consider that approximately half of all residential construction is renovation activity.
The bottom line is that the two series bear a lead (starts) to lag (PIP) relationship with each other, but they can’t truly be equated.










Recent Comments
comments for this post are closed