The Census Bureau has just released its December 2017 put-in-place construction statistics. ‘Put-in-place’ as a concept captures work-in-process or progress payments as projects proceed.

One chief benefit of having December results is that the full year now comes into better focus. Annual 2017 versus annual 2016 U.S. total construction spending was +3.8%.
The +3.8% pick-up was the lowest since 2011’s -2.6%. Over the five years prior to 2017, from 2012 to 2016, there was an average annual increase of +8.5%.
Within the latest data set from the Census Bureau, there are indications that last year’s soft spot in construction spending may be ending and that the future is brightening once again.
Specifically, the latest quarterly results (Q4) for many of the key type-of-structure categories are picking up the pace relative to their prior three-month results (i.e., Q3). Table 1 sets out the shifts that are underway.
For each type-of-structure, Table 1 takes the behind-the-scenes put-in-place data and compares the percentage changes of latest-12-months-over-previous-12-months versus latest-three-months-over-previous-three-months (annualized).
Then a check mark is place in one of the two far-right columns, depending on whether spending in the type of structure is speeding up or slowing down. A further explanation of what constitutes ‘speeding up’ or ‘slowing down’ appears in italics at the end of this section.
By the way, with publication of data for December, the background latest year-to-date and latest 12-month put-in-place numbers are the same – which is to say, they are the annual totals. Hence, the percentage changes in columns three and four are the same.
Table 1 highlights that put-in-place spending for ‘total construction’ and for ‘non-residential construction’ have been speeding up of late. The former has accelerated from +3.8% to +7.1% and the latter has shifted from -0.6% to +9.5%. Residential, however, has moved in the other direction, from +10.4% as an annual change to +3.9% as its latest-three-month change.
Among non-residential sub-categories, five have check marks in the ‘slowing down’ column and ten (i.e., twice as many) in the speeding up column. One (‘power’) has been neutral.
Furthermore, among those categories that have been ‘speeding up’, there have been several for which the improvement has been dramatic. ‘Educational’ has gone from +2.5% to +30.4%; ‘public safety’ from +2.6% to +30.4%; ‘transportation’ from +3.2% to +37.9%; ‘highway and street’ from -3.8% to +16.4%; and ‘sewage and waste disposal’ from -13.5% to +17.5%.
There have been sub-categories that have eased back, but none that have slipped outrageously.
Table 1: U.S. Put-in-place Construction Investment − December, 2017
Based on ‘current’ (i.e., not adjusted for inflation) $s, seasonally adjusted at annual rates (SAAR)
| Weighting of type-of-structure category (% of total $s) |
Year to date 2017/ Year to date 2016 |
Latest 12 mons vs. previous 12 mons | Latest 3 mons vs. previous 3 mons (annualized) |
Slowing Down 1 of 3 ‘Total’ categories / 5 of 16 sub-categories |
Speeding Up 2 of 3 ‘Total’ categories / 10 of 16 sub- categories |
||||||||
| Total Construction | 100.0% | 3.8% | 3.8% | 7.1% | ✔ | ||||||||
| Total Residential | 40.9% | 10.4% | 10.4% | 3.9% | ✔ | ||||||||
| Total Nonresidential | 59.1% | -0.6% | -0.6% | 9.5% | ✔ | ||||||||
| Lodging | 2.6% | 5.7% | 5.7% | 0.9% | ✔ | ||||||||
| Office | 6.0% | 2.1% | 2.1% | 13.6% | ✔ | ||||||||
| Commercial (retail) | 7.4% | 13.5% | 13.5% | 2.9% | ✔ | ||||||||
| Health care | 3.5% | 3.3% | 3.3% | 11.1% | ✔ | ||||||||
| Educational | 7.3% | 2.5% | 2.5% | 30.4% | ✔ | ||||||||
| Religious | 0.3% | -8.3% | -8.3% | -15.1% | ✔ | ||||||||
| Public safety | 0.8% | 2.6% | 2.6% | 30.4% | ✔ | ||||||||
| Amusement and recreation | 1.9% | 4.4% | 4.4% | -10.4% | ✔ | ||||||||
| Transportation | 3.9% | 3.2% | 3.2% | 37.9% | ✔ | ||||||||
| Communication | 2.3% | 4.5% | 4.5% | 9.1% | ✔ | ||||||||
| Power (electric; oil & gas) | 8.6% | -6.3% | -6.3% | -7.3% | |||||||||
| Highway and street | 5.7% | -3.8% | -3.8% | 16.4% | ✔ | ||||||||
| Sewage and waste disposal | 1.6% | -13.5% | -13.5% | 17.5% | ✔ | ||||||||
| Water supply | 0.9% | -9.9% | -9.9% | -11.1% | ✔ | ||||||||
| Conservation and development | 0.7% | -6.3% | -6.3% | 46.1% | ✔ | ||||||||
| Manufacturing | 5.7% | -12.6% | -12.6% | -3.5% | ✔ |
In the final two columns, if there is no check mark in the cell, then the type-of-structure category has stayed within 1.0%, up or down.
For December, the year-to-date figure is the same as the ‘latest 12 months’ figure.
Data source: Census Bureau / Table: ConstructConnect
Explanation of ‘speeding up’ or ‘slowing down’: If the three-month percent change exceeds the 12-month percent change, then construction activity in that type-of-structure category is considered to be speeding up. A check mark is entered in the far-right column of Table 1. (If the opposite is occurring, a check mark is entered in the ‘slowing down’ column.)
If a type-of-structure category has a latest 3-month percent-change that is negative, but less negative, than its 12-month percent-change, such a circumstance is also considered to be an instance of ‘speeding up’ and warrants a check mark in the right-hand column. (Or, if it’s turning more negative, then it’s ‘slowing down’ further.)
If the percentage changes for a type-of-structure swing from negative to positive, or vice versa, then it’s obvious where the check mark should go.
For my commentary on the 2017 annual put-in-place construction results within the context of the past several years, please refer to the article at ConstructConnect’s corporate website entitled: Construction Spending Climbs to All-time High in December.
Graph 1 shows that the volumes of ConstructConnect’s residential and non-residential building starts have been nearly equal since late 2012. Non-residential building starts broke a little higher during most of 2016, but then flattened out all the way through 2017.
Residential starts have exhibited mainly steady upward progress since recovering from a cyclical bottom in the summer of 2011. At $300 billion in 2017, however, they have still not caught up with the peak of $375 billion they achieved in 2006.
The slope of the curve for engineering/civil starts has been demonstrating some lift over the 12 years from 2006 to the present, but the degree of the incline has been modest. In 2017, engineering starts did move higher faster thanks to groundbreakings on several petrochemical mega projects.
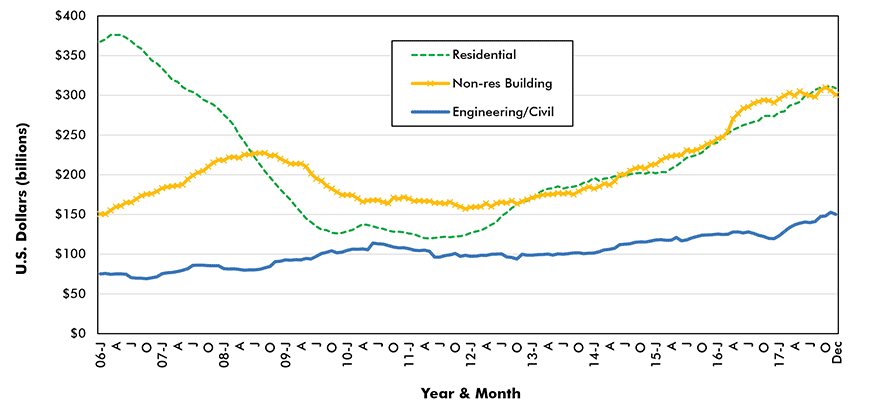
Chart: ConstructConnect.


Recent Comments
comments for this post are closed