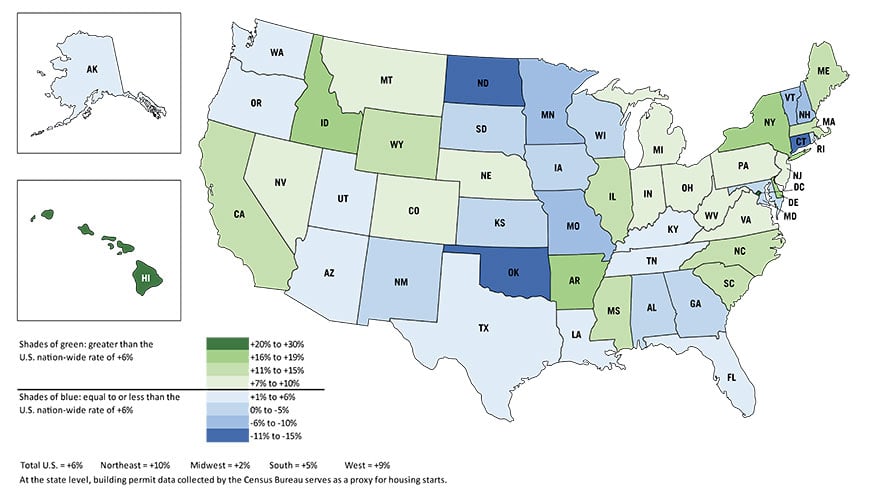
The three maps in this infographic focus attention on the 2017-over-2016 percentage changes in homebuilding activity in America’s states. The Census Bureau does not publish home starts statistics at the state level, but it does compile and release residential permits numbers.
Therefore, the shadings in the maps are based on permits data (in units). The words ‘permits’ and ‘starts’ will be used interchangeably in the following commentary.
The total number of new home permits in the U.S. in 2017 was +6% compared with 2016. As the ‘legend-key’ sets out, individual states with percentage increases over +6% are shaded in green − for warmth.
As the shading moves from lighter green to darker green, the percentage increases move higher.
States shaded in blue − for chillier − had year-over-year increases that were +6% or less. The darkest shades of blue are reserved for states where there were significant 2017-over-2016 declines.
Map 1 has coloring for all the states, mixing together both greens and blues. Maps 2 and 3 are for specific hues. Separating the colors helps to identify where there are significant groupings or clusters of states.
Map 1: 2017 versus 2016 U.S. State Housing Starts (in Units)
Data source: Census Bureau.
Graphic: ConstructConnect.
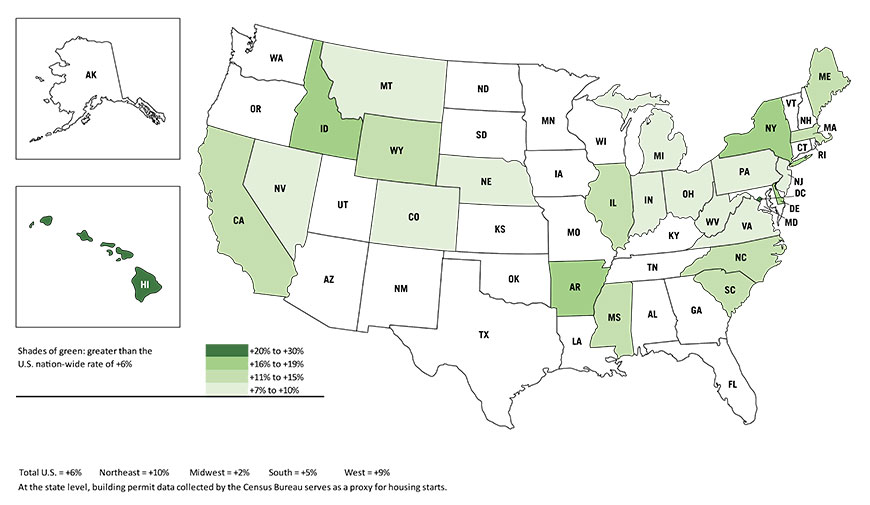
Map 2 shows that most of the larger housing starts increases occurred in the west and the east. In the west, it was mainly in the southern corner and in the northern mountain states. In the east, it was in the Great Lakes states (except for Wisconsin and Minnesota) and along much of the Atlantic seaboard.
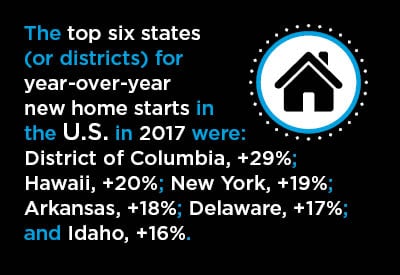
The top six states (or districts) for year-over-year new home starts in the U.S. in 2017 were: District of Columbia, +29%; Hawaii, +20%; New York, +19%; Arkansas, +18%; Delaware, +17%; and Idaho, +16%. (Idaho was also the state with the largest population increase last year, +2.2%.)
Map 2: 2017 versus 2016 U.S. State Housing Starts (in Units)
(greater than the U.S. nation-wide rate of +6%)
Data source: Census Bureau.
Graphic: ConstructConnect.
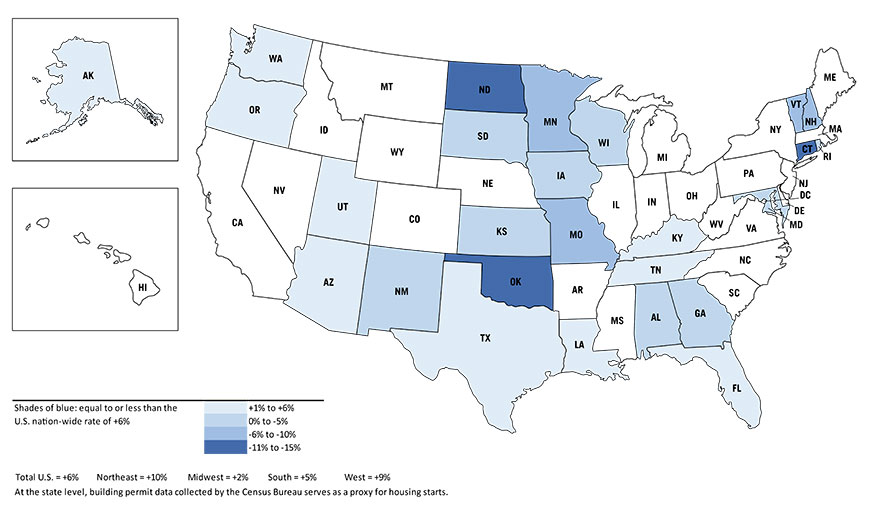
From Map 3, it’s apparent that the states with only average or weaker performances of housing starts last year were in the northwest, the southeast and most notably in the middle of the country. The middle northern states are the agricultural heartland. The middle southern states are recovering from an energy-sector downturn.
The seven states with the worst records of housing starts in 2017 were: North Dakota, -15%; Connecticut, -14%; Oklahoma, -11%; and Vermont, New Hampshire, Missouri and Minnesota, all with -6%.
Map 3: 2017 versus 2016 U.S. State Housing Starts (in Units)
(equal to or less than the U.S. nation-wide rate of +6%)
Data source: Census Bureau.
Graphic: ConstructConnect.
Table 1: 2017 vs 2016 New Home Permits
(in units)
| Rank | State/District | % Change |
| 1 | District of Columbia | 29% |
| 2 | Hawaii | 20% |
| 3 | New York | 19% |
| 4 | Arkansas | 18% |
| 5 | Delaware | 17% |
| 6 | Idaho | 16% |
| 7 | Mississippi | 14% |
| 7 | North Carolina | 14% |
| 7 | Wyoming | 14% |
| 10 | California | 13% |
| 11 | Illinois | 12% |
| 11 | Massachusetts | 12% |
| 13 | Maine | 11% |
| 13 | South Carolina | 11% |
| 15 | Indiana | 10% |
| 15 | Nebraska | 10% |
| 17 | Colorado | 9% |
| 17 | Michigan | 9% |
| 19 | Montana | 8% |
| 19 | Nevada | 8% |
| 19 | New Jersey | 8% |
| 19 | Pennsylvania | 8% |
| 19 | Virginia | 8% |
| 24 | Ohio | 7% |
| 24 | West Virginia | 7% |
| 26 | Arizona | 6% |
| 26 | Utah | 6% |
| 26 | Washington | 6% |
| 29 | Oregon | 5% |
| 29 | Texas | 5% |
| 31 | Florida | 4% |
| 31 | Louisiana | 4% |
| 31 | Tennessee | 4% |
| 34 | Alaska | 3% |
| 35 | Kentucky | 2% |
| 36 | Alabama | 0% |
| 37 | Wisconsin | -1% |
| 38 | New Mexico | -2% |
| 38 | South Dakota | -2% |
| 40 | Georgia | -3% |
| 40 | Rhode Island | -3% |
| 42 | Iowa | -4% |
| 42 | Kansas | -4% |
| 44 | Maryland | -5% |
| 45 | Minnesota | -6% |
| 45 | Missouri | -6% |
| 45 | New Hampshire | -6% |
| 45 | Vermont | -6% |
| 49 | Oklahoma | -11% |
| 50 | Connecticut | -14% |
| 51 | North Dakota | -15% |
Data source: Census Bureau.
Table: ConstructConnect.









Recent Comments