When assessing building material cost changes, the primary source for the U.S. is the Producer Price Index (PPI) data series calculated by the Bureau of Labor Statistics (BLS). (The BLS is also responsible for the Consumer Price Index.)
For Canada, one turns to the Industrial Product Price Index (IPPI) and Raw Materials Price Index (RMPI) data series from Statistics Canada.
While the history of the latest PPI numbers (Table 1) extends to January 2018, the IPPI and RMPI figures (Table 2) are currently available only through December 2017.
The PPI results include specific findings for ‘final demand construction’ (i.e., overall construction) as well as private capital versus government investment, plus five specific type-of-structure sub-categories.
Table 1 shows that the year-over-year (y/y) increase in ‘final demand construction’ is presently +3.4% and that the y/y cost of ‘public’ construction, at +3.6%, has risen a little faster than ‘private’ construction, +3.4%.
With respect to warehouse, school, office, industrial and health care construction, the y/y increases range from a low of +2.5% y/y for office buildings to a high of +4.6% for industrial buildings.
For Canada, the ‘total construction’ price index and the three sub-component indices have been calculated by CanaData based on the various weightings of materials that go into each of residential, non-residential building and engineering construction. (For example, single-family housing depends more on lumber inputs than most other kinds of construction; roads and highways on asphalt; etc.)
Canada’s ‘total construction’ materials cost index was +4.1% in December 2017, with engineering (+5.0%) in the driver’s seat, residential (+3.8%) riding shotgun and non-residential building (+3.1%) looking out the side window from the back seat.
Among main material inputs in the U.S. (Table 1), there were the following that registered y/y double-digit percentage gains in January 2018: asphalt, +21.6% (although it was -7.7% over the past six months); softwood lumber, +14.5%; plywood, +14.8%; iron and steel scrap, +14.7%; and copper wire and cable, +19.3%. Mention should also be made of the big climb in the cost of diesel fuel, +43.4% y/y.
The y/y cost increases for some other key U.S. construction material inputs have been: gypsum, +7.0%; cement, +3.1%; ready-mix concrete, +3.3%; and clay brick, +2.6%.
% Change in the Janaury 2018 Index from:
| 3 Years | 1 Year | 6 months | 3 months | 1 month | |||||
| Ago | Ago | Ago | Ago | Ago | |||||
| Product/Good/Service/Commodity | |||||||||
| Final Demand Construction | 6.1% | 3.4% | 1.3% | 0.5% | 0.8% | ||||
| Construction for private capital investment | 6.0% | 3.4% | 1.3% | 0.4% | 0.7% | ||||
| Construction for Government | 6.2% | 3.6% | 1.4% | 0.8% | 1.0% | ||||
| New warehouse building construction | 7.1% | 3.5% | 0.9% | 0.5% | 0.3% | ||||
| New school building construction | 6.6% | 4.2% | 1.7% | 1.0% | 1.4% | ||||
| New office building construction | 6.1% | 2.5% | 1.1% | 0.3% | 0.5% | ||||
| New industrial building construction | 6.7% | 4.6% | 1.6% | 0.6% | 1.0% | ||||
| New health care building construction | 3.9% | 3.4% | 1.1% | 0.1% | 0.4% | ||||
| Architectural & engineering services | 6.0% | 1.0% | 0.9% | 0.7% | 0.4% | ||||
| Construction machinery & equipment | 0.5% | -1.2% | -1.5% | -1.6% | -1.7% | ||||
| Asphalt | -28.5% | 21.6% | -7.7% | -8.6% | -6.1% | ||||
| Plastic construction products | 5.2% | 4.1% | 2.8% | 0.0% | -0.3% | ||||
| Softwood lumber | 15.2% | 14.5% | 4.6% | 0.3% | 1.0% | ||||
| Hardwood lumber | -3.3% | 5.7% | 2.8% | 2.4% | 0.3% | ||||
| Millwork | 7.1% | 4.2% | 1.2% | 0.9% | 0.4% | ||||
| Plywood | 5.8% | 14.8% | 9.8% | 4.0% | 0.9% | ||||
| Gypsum | 10.3% | 7.0% | 1.1% | 2.2% | 2.3% | ||||
| Insulation materials | 4.9% | 1.8% | 1.2% | 0.8% | 1.0% | ||||
| Construction sand, gravel & crushed stone | 11.5% | 2.9% | 1.5% | 1.1% | 1.2% | ||||
| Cement | 14.1% | 3.1% | 0.7% | 0.8% | 1.1% | ||||
| Ready-mix concrete | 11.0% | 3.3% | 1.6% | 1.3% | 0.9% | ||||
| Precast concrete products | 5.5% | 2.4% | 0.7% | 0.6% | 0.2% | ||||
| Prestressed concrete products | 12.6% | 2.1% | 0.7% | 0.5% | 0.4% | ||||
| Brick (clay) | 3.6% | 2.6% | 1.2% | 0.6% | 0.3% | ||||
| Coal | 0.7% | -0.6% | 3.0% | 2.2% | 1.7% | ||||
| Iron ore | -8.2% | 2.0% | -12.6% | -8.2% | -3.9% | ||||
| Iron and steel scrap | 5.5% | 14.7% | 15.3% | 17.8% | 12.9% | ||||
| Steel bars, plates and structural shapes | -11.4% | 4.4% | -0.6% | -2.5% | 0.0% | ||||
| Fabricated structural metal products | 2.6% | 2.7% | 2.1% | 1.0% | 0.7% | ||||
| Flat glass | 10.0% | 1.8% | 2.0% | 1.3% | 0.7% | ||||
| Lighting fixtures | 3.6% | 2.0% | 1.1% | 1.1% | 0.9% | ||||
| Plumbing fixtures & brass fittings | 4.1% | 3.2% | 1.1% | 1.3% | 1.1% | ||||
| Heating equipment | 6.4% | 2.2% | 2.2% | 1.4% | 0.6% | ||||
| Copper wire & cable | 7.0% | 19.3% | 12.0% | 4.6% | 3.7% | ||||
| Fiber optic cable | -0.5% | -0.2% | 0.0% | -0.2% | 0.0% | ||||
| Regular gasoline unleaded | 26.2% | 13.7% | 18.3% | 7.8% | 3.6% | ||||
| Diesel Fuel | 26.5% | 43.4% | 28.6% | 5.7% | 3.2% | ||||
| Jet Fuel | 14.0% | 24.5% | 39.0% | 11.7% | 5.0% | ||||
| Natural gas | -15.4% | -30.9% | -6.3% | 1.7% | -13.1% | ||||
| Natural gas to electric utilities | -9.1% | -16.8% | -9.6% | -4.9% | -7.5% | ||||
| Commercial electric power | 3.5% | 3.3% | -5.3% | -2.8% | 2.9% | ||||
| Industrial electric power | 9.9% | 5.5% | -3.5% | 0.7% | 3.1% | ||||
| Residential electric power | 4.5% | 3.9% | -1.5% | 1.6% | 1.9% | ||||
| Commercial natural gas | -2.6% | -0.3% | 2.2% | 4.0% | -1.3% | ||||
| Industrial natural gas | -13.3% | -6.7% | -1.6% | 1.0% | -2.8% | ||||
| Residential natural gas | -1.0% | 0.9% | -0.3% | -0.5% | -2.1% | ||||
| Construction materials | 4.4% | 3.7% | 1.5% | 0.8% | 0.5% |
Table: ConstructConnect.
In Canada, the outsized y/y material cost increases have been limited to: softwood lumber, +23.9%; asphalt, +19.7% (although -11.1% over the past six months); and diesel fuel, +13.6%.
Iron ore in Canada has moved in the opposite direction, -13.5% y/y (although it has been +20.6% during the latest six months).
In Canada, ready-mix concrete has been +4.9% y/y; clay brick, +3.7%; and gypsum, +1.3%.
The price hikes for softwood lumber in both the U.S. and Canada are being influenced, either directly or indirectly, by the 20%-to-25% tariffs (i.e., depending on the province of origin) imposed on imports last fall by the Trump Administration.
In Canada, the IPPI measures the charge producers impose when their product passes through the front gate. Further transportation, warehousing and retailing costs are excluded. It appears, however, that price hikes for softwood lumber further down the demand stream (i.e., when new home groundbreakings are initiated) are facilitating or encouraging or forcing price movements earlier in the supply chain.
Raw Materials Price Index (RMPI) Results
% Change in the December 2017 Index from:
| 3 Years | 1 Year | 6 Months | 3 Months | 1 Month | |||
| Ago | Ago | Ago | Ago | Ago | |||
| Type of Construction Indices: | |||||||
| Residential | 11.4% | 3.8% | 0.4% | 0.1% | -0.1% | ||
| Non-residential Building | 8.8% | 3.1% | 1.9% | 1.3% | -0.3% | ||
| Engineering/Civil | 5.6% | 5.0% | 2.7% | 0.9% | -0.3% | ||
| Total Construction | 8.6% | 4.1% | 1.6% | 0.7% | -0.2% | ||
| Key Aggregates: | |||||||
| Lumber and other wood products | 9.6% | 4.4% | 0.6% | -0.7% | -0.2% | ||
| Primary ferrous metal products | -4.6% | 2.5% | -4.0% | 2.3% | 0.4% | ||
| Primary non-ferrous metal products | 13.4% | 5.1% | 1.7% | 2.7% | -1.2% | ||
| Fabricated metal products and construction materials | 9.8% | 2.7% | 0.3% | 1.0% | -0.3% | ||
| Machinery and equipment (includes HVAC) | 4.2% | -0.2% | -0.5% | 1.4% | 0.2% | ||
| Electrical, electronic and telecommunications | 4.8% | -1.5% | -1.6% | 2.0% | -0.1% | ||
| Cement, glass, other non-metallic minerals | 5.3% | 2.8% | 2.0% | 1.1% | 0.4% | ||
| Petroleum and coal products | 5.2% | 11.2% | 15.3% | 6.9% | -0.7% | ||
| Chemicals and chemical products | 2.0% | 1.3% | -0.1% | 3.7% | 0.8% | ||
| Construction Inputs: | |||||||
| Softwood lumber (spruce-pine-fir) | 24.8% | 23.9% | 12.6% | 6.5% | -4.1% | ||
| Veneer and plywood | 8.8% | 8.0% | -1.7% | -12.9% | 0.7% | ||
| Waferboard and particle board | 26.2% | 2.7% | -0.1% | -1.9% | -0.1% | ||
| Shakes and shingles and wood siding | -0.1% | -0.2% | -1.4% | 0.7% | -0.3% | ||
| Wood windows and doors | 6.4% | 0.7% | 0.3% | 0.3% | 0.3% | ||
| Glass and glass products (except automotive) | 7.1% | -0.7% | -0.4% | 0.2% | 0.0% | ||
| Ready-mix concrete | 8.2% | 4.9% | 3.8% | 2.6% | 0.5% | ||
| Clay products (brick) | 10.5% | 3.7% | 0.5% | -1.3% | -0.3% | ||
| Fabricated structural metal | 12.6% | 2.4% | 1.5% | -0.4% | -1.3% | ||
| Prefabricated metal buildings | 16.1% | -1.9% | -3.6% | 3.4% | 0.3% | ||
| Metal windows and doors | 10.5% | 6.3% | 1.1% | 0.0% | 0.0% | ||
| Metal roofing | 8.9% | 6.9% | 0.5% | -0.1% | 0.0% | ||
| Bolts, nuts, screws, washers, fasteners | 15.5% | 3.9% | 3.8% | 0.4% | 0.1% | ||
| Hardware | 8.3% | 0.7% | -1.5% | 1.4% | 0.0% | ||
| Plastic pipe fittings | 15.0% | 1.2% | 1.3% | 0.0% | 0.0% | ||
| Plastic plumbing fixtures | 13.9% | 9.1% | 4.3% | 5.5% | 0.0% | ||
| Electric lamps, lighting fixtures | -4.7% | -2.6% | -3.1% | 0.0% | 0.0% | ||
| Concrete pipes and fittings | -2.7% | 2.2% | 3.4% | -2.8% | 0.0% | ||
| Asphalt | -13.9% | 19.7% | -11.1% | -7.8% | 0.9% | ||
| Gasoline (regular) | 13.8% | 10.4% | 10.6% | 2.0% | -3.4% | ||
| Diesel fuel | 0.3% | 13.6% | 27.5% | 15.4% | 1.0% | ||
| Natural gas | -19.7% | -3.8% | -4.4% | -5.1% | 0.0% | ||
| Gypsum | 26.5% | 1.3% | -4.4% | 4.2% | 0.0% | ||
| Iron ore | 17.7% | -13.5% | 20.6% | 5.2% | 12.6% | ||
| Stone | 3.4% | 2.1% | -1.7% | -2.6% | -1.2% |
Table: ConstructConnect.
The U.S. PPI results incorporate more ‘intermediate stage’ measurements.
Included below are graphs laying out the index value histories for many of the Table 1 and Table 2 building materials.
In the U.S., as is shown in the history graphs, costs for the following products have moved up beyond their pre-Great Recession peaks: gypsum; insulation materials; cement; ready-mix concrete; and flat glass.
Softwood lumber and plywood have managed nice recoveries but they are still only level with their earlier summits.
Still resisting much in the way of upward price movement in the U.S. are coal, iron ore and steel bars, plates and structural shapes.
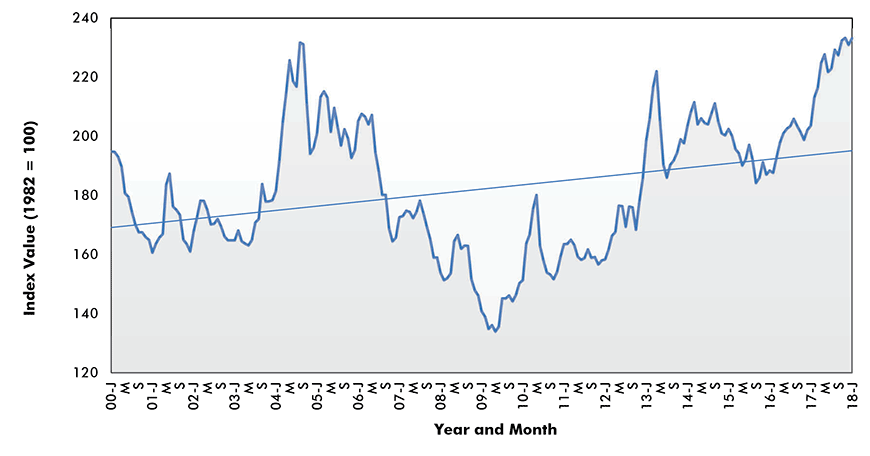
Chart: ConstructConnect.
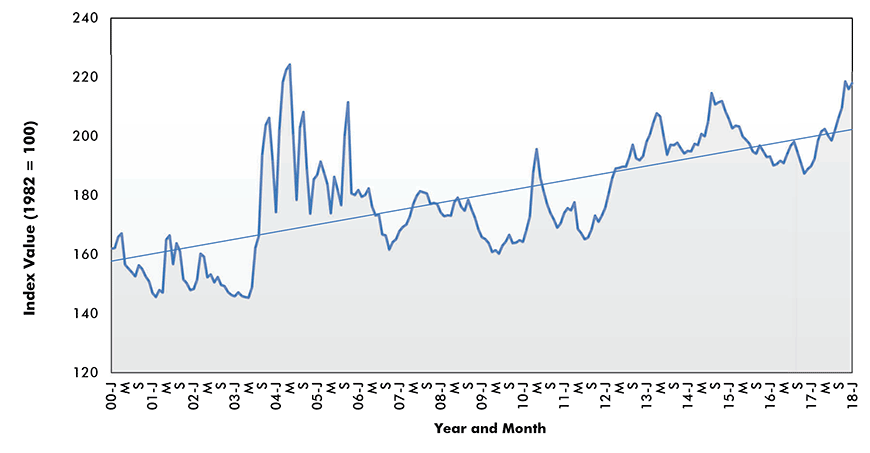
Chart: ConstructConnect.

Chart: ConstructConnect.
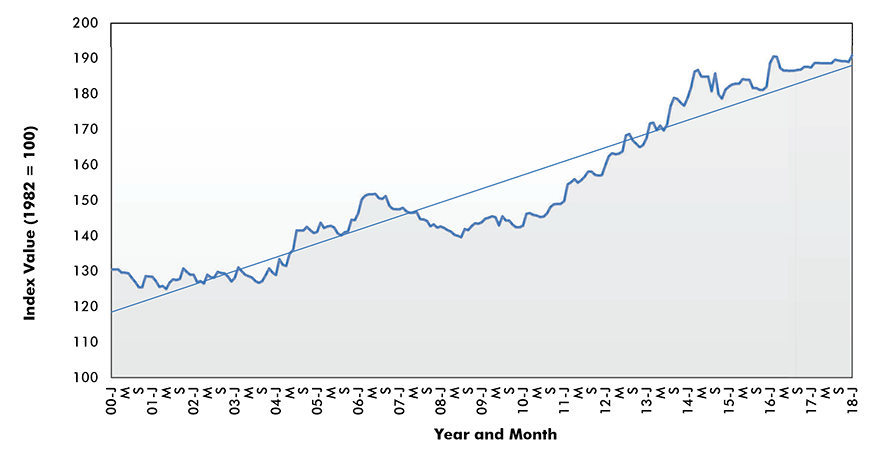
Chart: ConstructConnect.
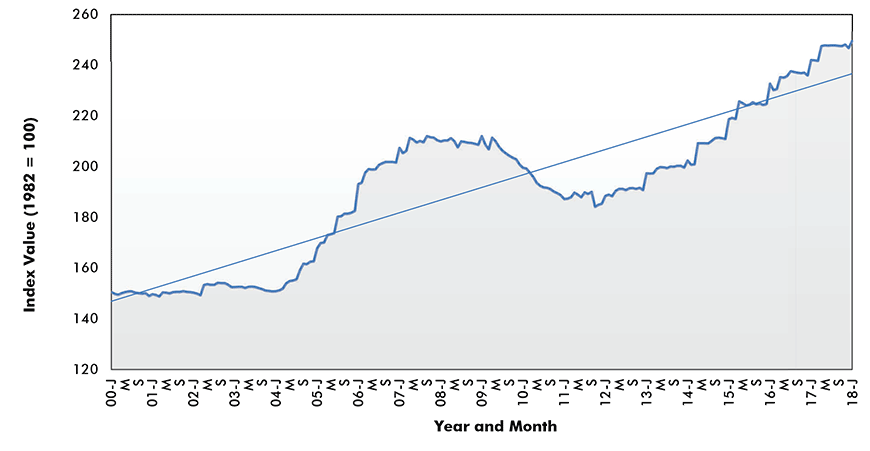
Chart: ConstructConnect.
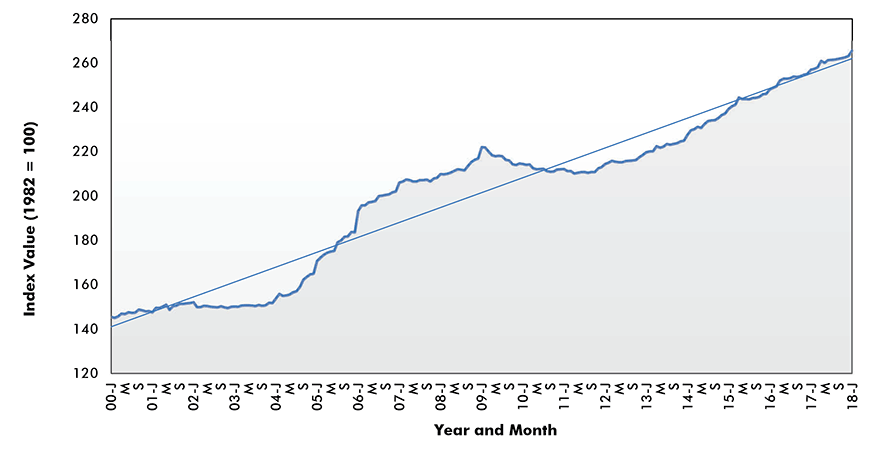
Chart: ConstructConnect.
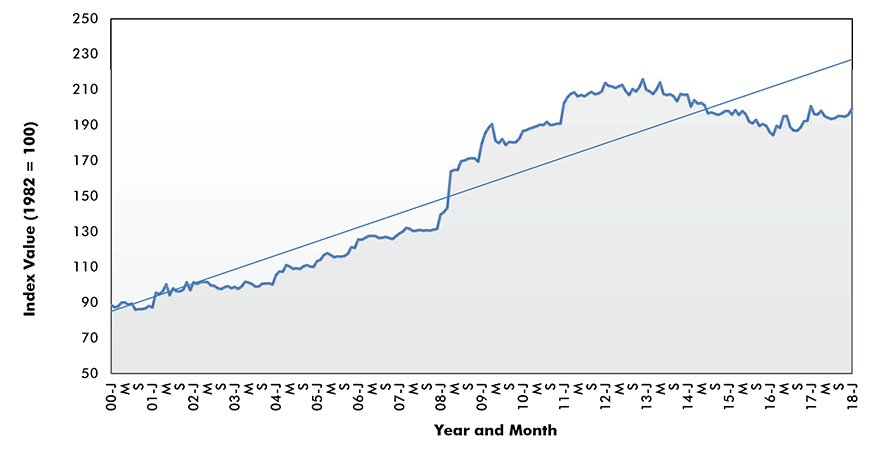
Chart: ConstructConnect.

Chart: ConstructConnect.
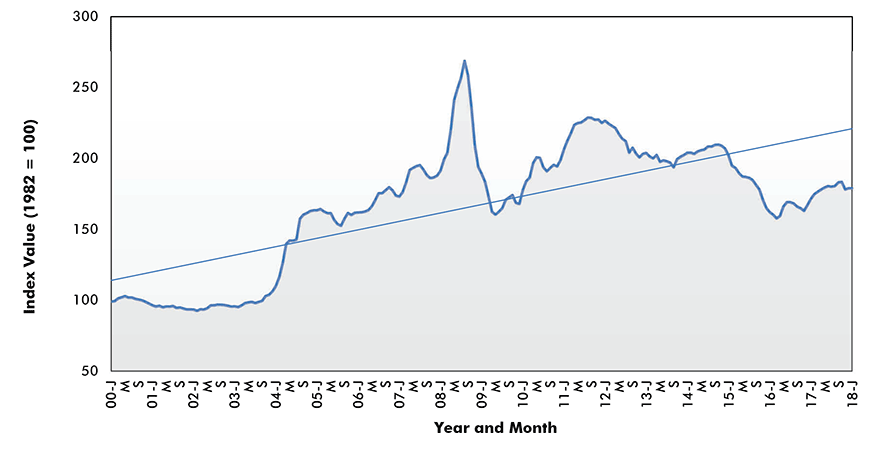
Chart: ConstructConnect.
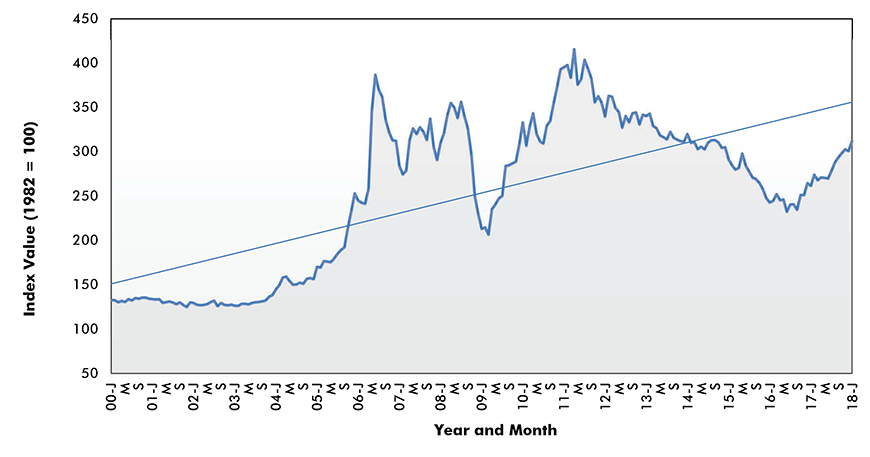
Chart: ConstructConnect.
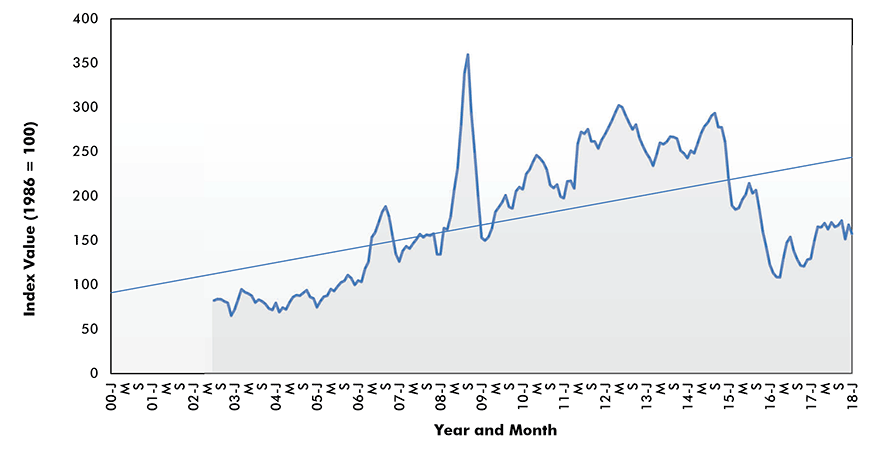
Chart: ConstructConnect.
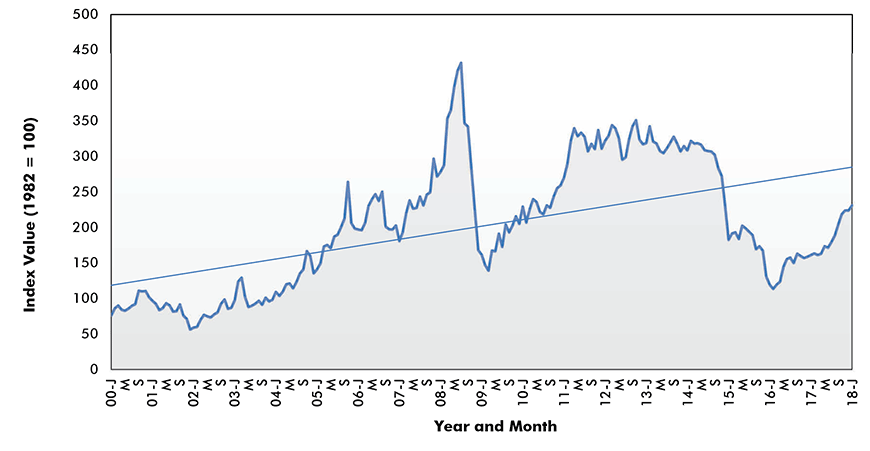
Chart: ConstructConnect.
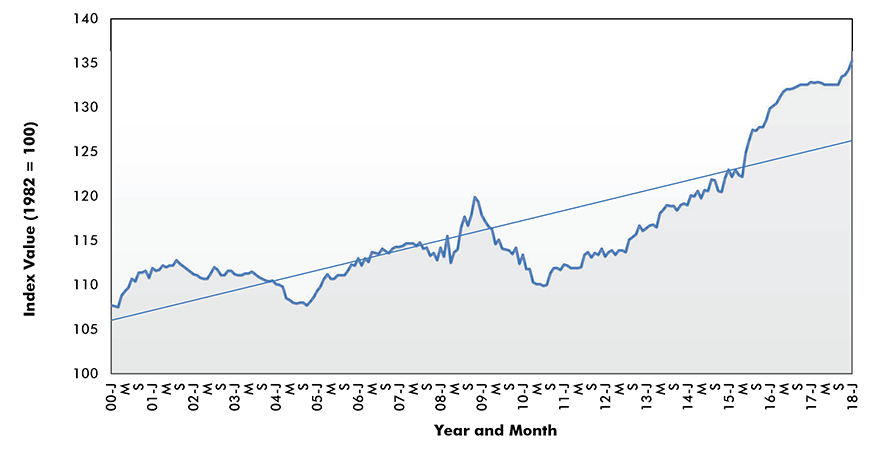
Chart: ConstructConnect.
In Canada, there’s a lengthy list of building materials for which prices are in the ascendant: softwood lumber; ready-mix concrete; fabricated structure metal; gypsum; and glass (although the glass curve has been level at its new peak for the past two-and-a-half years).
Prices for waferboard and particle board in Canada are running lukewarm while those for iron ore and asphalt have chilled.

Chart: ConstructConnect.

Chart: ConstructConnect.
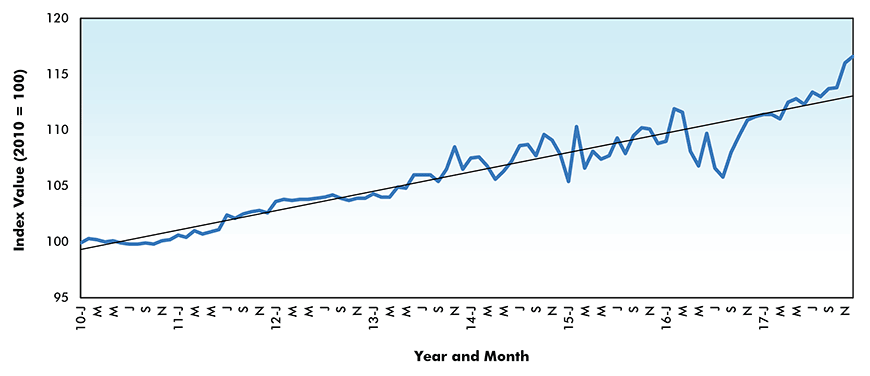
Chart: ConstructConnect.
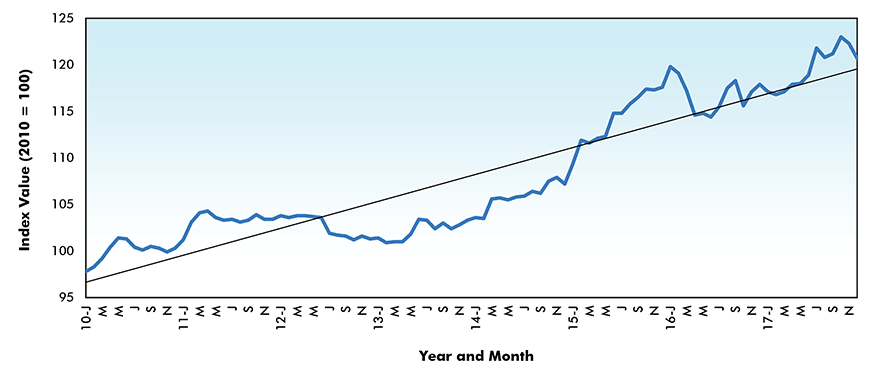
Chart: ConstructConnect.
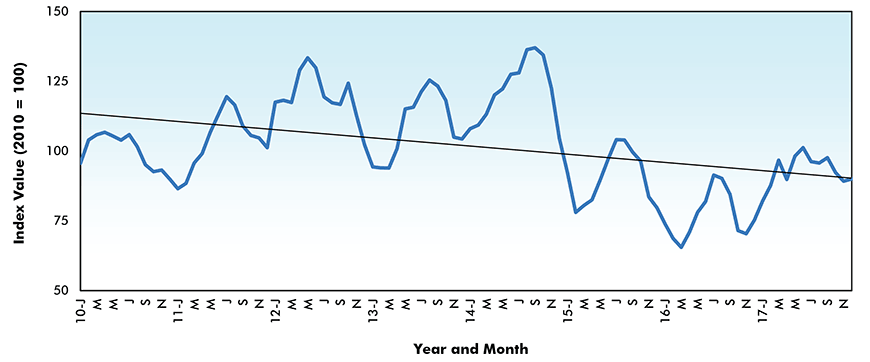
Chart: ConstructConnect.
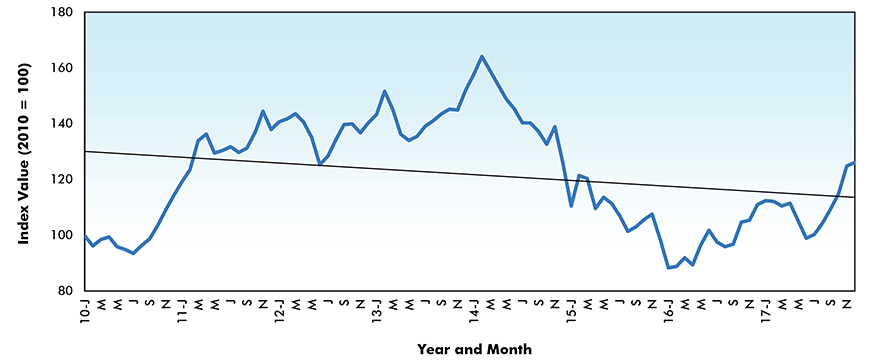
Chart: ConstructConnect.
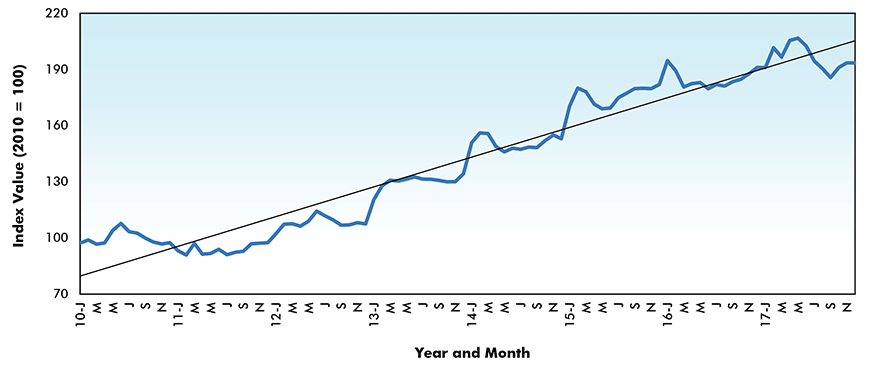
Chart: ConstructConnect.

Chart: ConstructConnect.
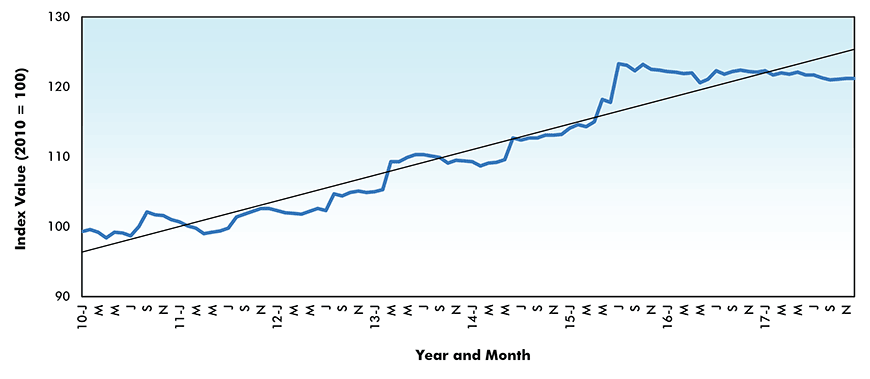
Chart: ConstructConnect.
There’s a final graph to be discussed, the one labeled ‘Big 5 Commodities – Price Indices’.
The five commodities that are especially important for the general interest they garner are lumber, cement, steel, copper and gasoline.
The economy’s recovery from the Great Recession began in July 2009. Versus the summer of 2009, the cost of softwood lumber has risen the most, +60%. Next in line are copper and cement, both slightly more than +20%. Steel is about +10% and gasoline, after wild swings up and down, is right back where it started.
(Since July 2009 Trough)
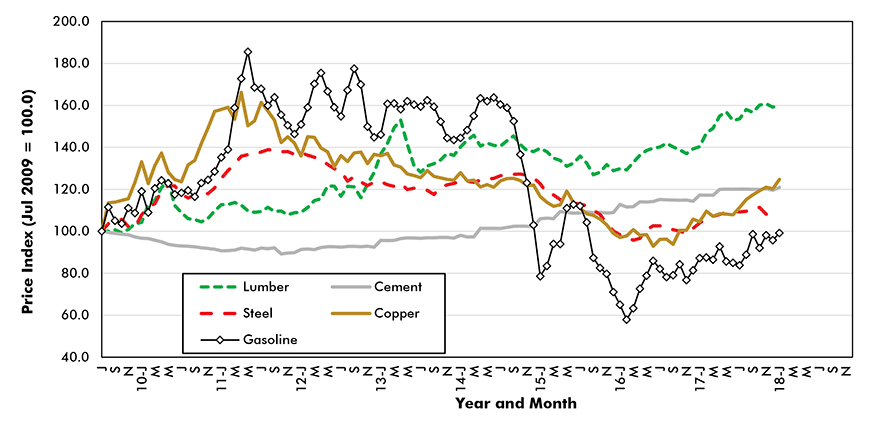
Chart: ConstructConnect.







Recent Comments