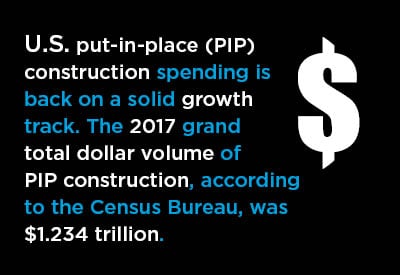
In 2017, the grand total dollar volume of U.S. put-in-place (PIP) construction, according to the Census Bureau, was $1.234 trillion. PIP statistics are published by the Census Bureau. They are analogous to work-in-process or progress payments as projects proceed. They lag ConstructConnect’s up-front ‘starts’, which are lump-sum figures estimated when ground is broken. Also, the ‘starts’ set the table for the later PIP numbers.
PIP construction spending is back on a solid growth track. Just the same, 2016 was the first year in which the total value of construction finally climbed above its previous peak in 2006.
There’s a remarkable story in that lengthy separation. There was nearly a decade during which construction lost its way. Indeed, there were several years when it fell into a dark scary pit.
Between 2006 and 2011, the total value of U.S. construction sank from nearly $1.2 trillion to only $800 billion, an enormous decline of approximately one-third. Furthermore, those figures are in ‘current’ rather than ‘constant’ dollars. They include whatever price increases occurred along the way.
In other words, 2011’s miserly number was ‘true’ and not biased downwards by an adjustment for inflation.
ConstructConnect’s forecasts for all the various type-of-structure PIP sub-categories are set out in the accompanying table.
Table 1: U.S. Construction Spending (put-in-place investment)
(billions of “current” $s)
| Type of Construction: | 2013 | 2014 | 2015 | 2016 | 2017 | 2018 | 2019 | 2020 |
| Grand Total | 906.4 | 1,005.6 | 1,113.6 | 1,185.7 | 1,234.1 | 1,311.2 | 1,387.4 | 1,462.6 |
| (year versus previous year) | 11.0% | 10.7% | 6.5% | 4.1% | 6.3% | 5.8% | 5.4% | |
| Total Residential | 329.2 | 374.9 | 428.8 | 473.2 | 524.0 | 569.0 | 610.0 | 647.2 |
| 13.9% | 14.4% | 10.4% | 10.7% | 8.6% | 7.2% | 6.1% | ||
| Total Nonresidential | 577.1 | 630.8 | 684.9 | 712.5 | 710.1 | 742.2 | 777.4 | 815.4 |
| 9.3% | 8.6% | 4.0% | -0.3% | 4.5% | 4.7% | 4.9% | ||
| Total Commercial/for Lease | 104.6 | 126.2 | 143.3 | 170.8 | 184.6 | 197.5 | 205.7 | 211.6 |
| 20.6% | 13.6% | 19.1% | 8.1% | 7.0% | 4.2% | 2.9% | ||
| Lodging | 13.5 | 16.7 | 21.9 | 26.9 | 28.5 | 30.6 | 31.6 | 31.0 |
| 24.1% | 30.9% | 22.9% | 5.9% | 7.4% | 3.2% | -2.0% | ||
| Office | 38.0 | 46.6 | 55.5 | 67.3 | 68.8 | 71.7 | 74.8 | 78.2 |
| 22.7% | 19.2% | 21.1% | 2.3% | 4.2% | 4.4% | 4.5% | ||
| Commercial/Retail | 53.2 | 62.8 | 65.9 | 76.6 | 87.3 | 95.2 | 99.3 | 102.4 |
| 18.2% | 4.9% | 16.2% | 14.0% | 9.0% | 4.3% | 3.2% | ||
| Total Institutional | 148.1 | 147.9 | 156.2 | 162.0 | 166.4 | 175.7 | 184.2 | 192.5 |
| -0.1% | 5.6% | 3.7% | 2.7% | 5.6% | 4.8% | 4.5% | ||
| Health Care | 40.7 | 38.6 | 39.1 | 38.7 | 40.1 | 42.8 | 45.5 | 48.7 |
| -5.0% | 1.3% | -1.1% | 3.6% | 6.7% | 6.5% | 6.9% | ||
| Educational | 79.1 | 79.7 | 84.8 | 89.4 | 91.4 | 95.1 | 98.7 | 102.2 |
| 0.8% | 6.4% | 5.4% | 2.2% | 4.1% | 3.8% | 3.5% | ||
| Religious | 3.6 | 3.4 | 3.6 | 3.5 | 3.2 | 3.2 | 3.2 | 3.3 |
| -5.7% | 5.6% | -2.1% | -9.1% | 0.8% | 1.2% | 1.5% | ||
| Public Safety | 9.5 | 9.4 | 8.5 | 8.0 | 8.2 | 9.4 | 10.2 | 11.1 |
| -0.7% | -10.1% | -5.9% | 2.9% | 14.2% | 9.2% | 8.1% | ||
| Amusement and Recreation | 15.2 | 16.8 | 20.3 | 22.5 | 23.6 | 25.3 | 26.5 | 27.3 |
| 10.3% | 20.8% | 10.8% | 4.9% | 7.2% | 4.8% | 3.0% | ||
| Total Engineering/Civil | 273.9 | 298.0 | 305.4 | 304.4 | 292.7 | 302.0 | 317.0 | 335.5 |
| 8.8% | 2.5% | -0.3% | -3.8% | 3.2% | 5.0% | 5.9% | ||
| Transportation | 39.5 | 42.0 | 44.8 | 42.2 | 43.8 | 50.3 | 53.9 | 57.1 |
| 6.5% | 6.7% | -5.9% | 3.7% | 14.9% | 7.2% | 6.0% | ||
| Communication | 17.8 | 17.3 | 21.7 | 22.0 | 23.0 | 25.5 | 26.8 | 28.0 |
| -2.7% | 25.4% | 1.6% | 4.5% | 10.7% | 5.3% | 4.4% | ||
| Power | 93.3 | 110.1 | 103.0 | 105.8 | 99.8 | 98.5 | 103.0 | 110.5 |
| 18.0% | -6.5% | 2.7% | -5.6% | -1.3% | 4.5% | 7.3% | ||
| Highway and Street | 81.4 | 84.7 | 90.6 | 91.4 | 87.8 | 86.1 | 89.5 | 93.9 |
| 4.2% | 6.9% | 0.8% | -3.9% | -1.9% | 3.9% | 4.9% | ||
| Sewage and Waste Disposal | 22.4 | 23.2 | 24.4 | 22.8 | 19.7 | 21.0 | 22.0 | 23.1 |
| 3.3% | 5.2% | -6.6% | -13.4% | 6.3% | 5.1% | 4.9% | ||
| Water Supply | 13.6 | 13.4 | 13.2 | 12.5 | 11.4 | 12.3 | 13.0 | 13.7 |
| -1.6% | -1.7% | -4.8% | -9.1% | 7.9% | 6.0% | 5.6% | ||
| Conservation and Development | 6.0 | 7.3 | 7.7 | 7.7 | 7.2 | 8.3 | 8.7 | 9.2 |
| 22.5% | 5.7% | -0.1% | -6.3% | 14.8% | 5.2% | 5.0% | ||
| Total Industrial/Manufacturing | 50.5 | 58.6 | 79.9 | 75.3 | 66.4 | 67.0 | 70.5 | 75.7 |
| 16.0% | 36.3% | -5.8% | -11.9% | 1.0% | 5.2% | 7.4% |
"Current" means not adjusted for inflation.
Data source: U.S. Census Bureau.
Chart: ConstructConnect.
Graphs for several of the most important categories of PIP construction are also included below.
The grand total is the summation of all the sub-category forecasts. Individual projections have been made for each sub-category, based on varying combinations of appropriate key drivers and the historical patterns of the series.
For example, some construction sub-categories are highly cyclical and move through time in waves. Their peaks and troughs have wide amplitudes. Falling into this category are ‘office buildings’ and ‘lodging’.
Other series tend to stick close to their trend lines, because they are tied to government spending or some specific demographic characteristic − e.g., the aging of the population as post-World War II baby boomers increasingly move into their ‘senior’ years.
Exemplifying the former are ‘transportation’ and ‘highways and streets’. The latter is best represented by ‘health care’.
There are several factors that are contributing a bullish bent to the construction forecasts across the board. Included are the new low corporate tax regime that is intended to be a spur to capital investment and the extraordinarily tight labor market that is lifting incomes and consumer confidence and pushing gross domestic product (GDP) to speedier growth.
At the same time, though, there are ‘barometric readings’ out of Washington that threaten stormier weather. The Trump administration is launching tariff offensives against imports from numerous nations. The latest such action is a warning to China that another $200 billion-worth of its exports may soon be ‘dinged’.
There are two major consequences. The first is an escalation in construction material costs, which may cause some frugal owners to set aside pending investment plans. The second is a billowing of uncertainty, which is anathema to the risk acceptance needed for major construction project go-aheads.
Shaky stock markets have been demonstrating their displeasure with the latest twists and turns being taken by U.S. foreign trade measures.
(put-in-place investment)
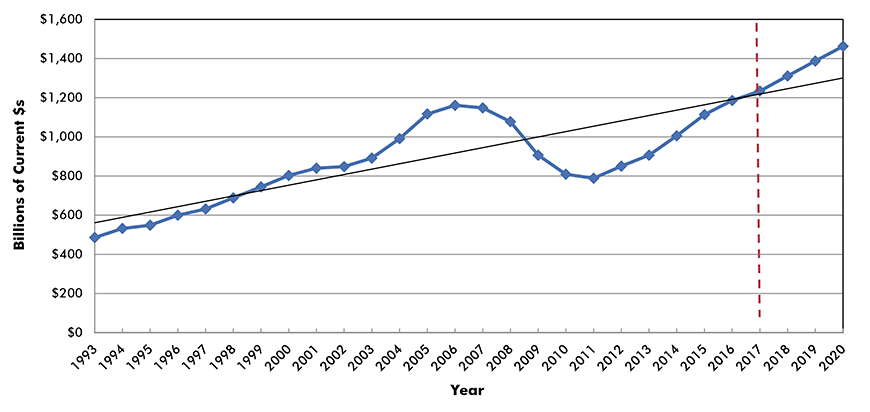
Chart: ConstructConnect
Residential construction: In residential construction, there’s a wide-spread expectation that multi-family housing starts will take a back seat to single-family homes in the period ahead, as millennials achieve better employment, begin to raise children and seek lifestyles like what they had with their parents in the suburbs.
But affordability may put a damper on enthusiastic intentions to buy single-family housing. A monthly rental commitment, even though it may be climbing, is still not as burdensome as meeting a mortgage payment in an era of rising interest rates, especially if an individual or a couple is also trying to pay off a heavy student loan or two.
Pent up demand will propel residential construction spending higher nonetheless. Between 2005 and 2009-12, capital spending on housing in America dropped by more than half. There are still years of improvement needed to satisfy residential requirements from underlying demographic influences.
(put-in-place investment)
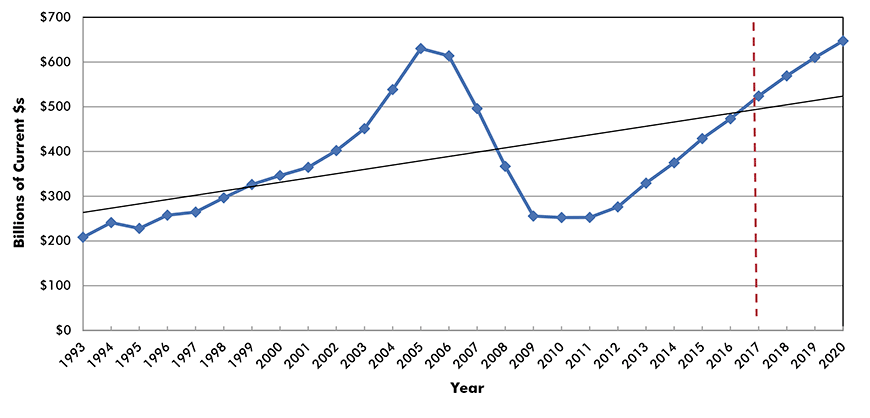
Chart: ConstructConnect
Lodging: A lower-wattage image of America on the world stage has dampened in-bound tourism from other countries. Greater prosperity at home, however, has bumped up business and pleasure travel within America. ‘Lodging’ construction is currently enjoying one of its cyclical peaks. The surge in spending on new and spruced-up hotels and motels will gradually dissipate.
(put-in-place investment)
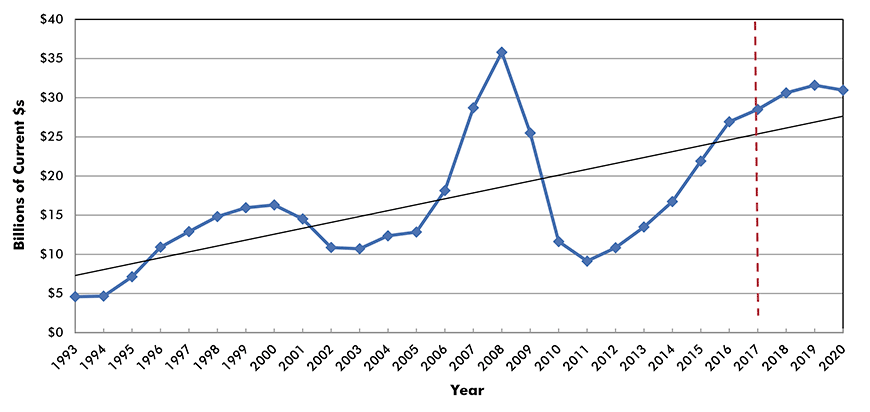
Chart: ConstructConnect
Office building: There are eight cities in the U.S. with office vacancy rates notably lower than the national average – San Francisco, Oakland, Manhattan, Austin, Charlotte, Boston, Seattle and Orlando.
Seven of those eight are well-known high-technology breeding grounds. The exception, Orlando – which is more famous for its entertainment theme parks – also does have high-tech credentials through its proximity to rocket launching nearby on the Florida coastline, at Cape Canaveral and the Kennedy space center.
High-tech has become the prime driver of the U.S. economy − i.e., the NASDAQ stock index has shot up by a factor of four since early 2009 − and low office vacancy rates promote office space construction. It’s worth keeping in mind that much of high-tech research and development requires office space.
(put-in-place investment)
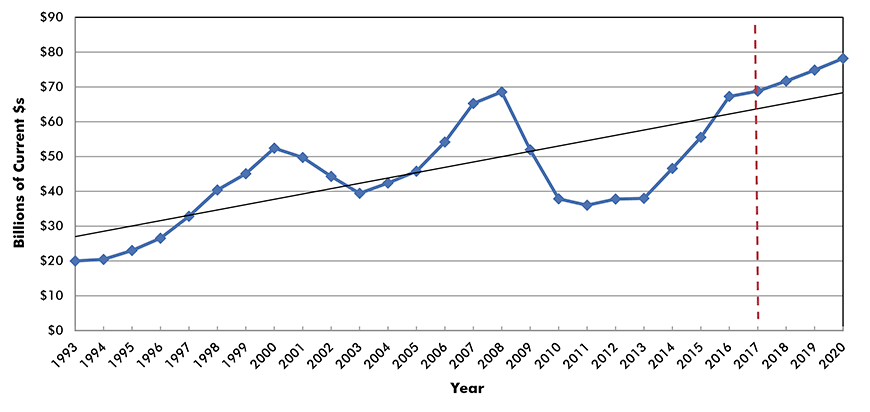
Chart: ConstructConnect
Commercial: The ‘commercial’ category of construction, as defined by the Census Bureau, includes retail, warehouses and restaurants. The fading of ‘bricks and mortar’ shop-keeping in favor of web-based platforms has meant, and will continue to point towards, a corresponding uptick in the need for large distribution centers (i.e., warehouses) to fulfill on-line orders.
And a swelling in the ranks of workers with more money in their pockets portends ongoing robust spending on facilities designed to provide amusement and entertainment.
(put-in-place investment)
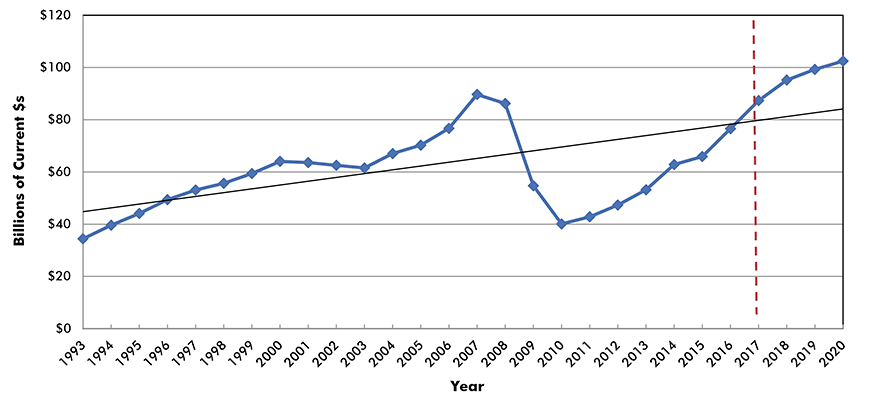
Chart: ConstructConnect
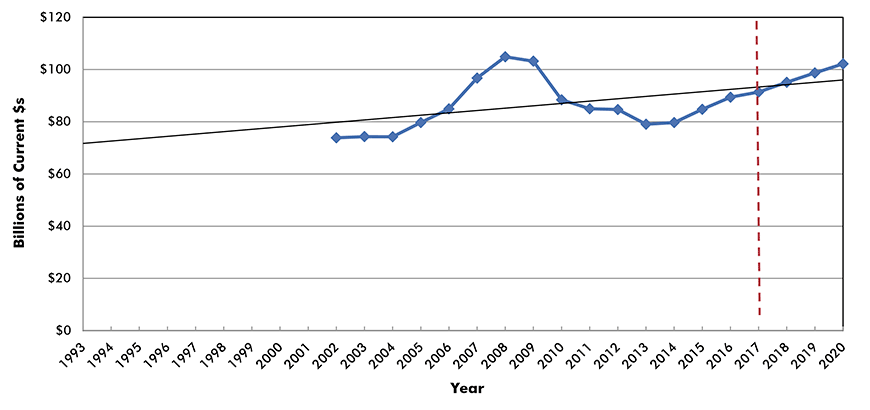
Educational: To the extent that the suburbs do experience a revival over the next several years, there will be spending on elementary and secondary schools. But if the young adult cohort chooses to stay mainly in downtown cores, many new schools will be situated in urban spaces that previously served another purpose (e.g., an abandoned garment factory).
At the level of higher education, foreign student enrolments have taken a plunge and ‘home-grown’ American students have been lured away from ‘hallowed halls’ by readily-available job opportunities. The current minimal unemployment rate of 3.8% is almost unprecedented.
Ironically, interest in an on-campus life is faltering at a time when universities and colleges are sitting on piles of cash readily available for expansions due to joint-venture research arrangements with private enterprises and capital gains from well-managed and augmented-by-grateful-alumni endowment funds.
(put-in-place investment)
Numbers for this series prior to 2002 are no longer consistent with more current data.
Chart: ConstructConnect
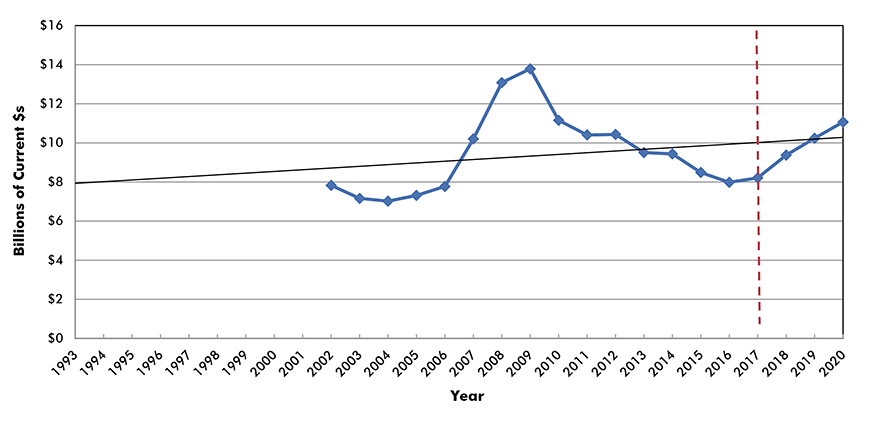
Public Safety: In ‘public safety’ construction, private prison work is making a comeback. Prisons run by the private sector fell out of favor during the Obama years, but they’ve been deemed necessary lately due to a surfeit of unwelcome immigrants being held in detention.
(put-in-place investment)
Numbers for this series prior to 2002 are no longer consistent with more current data.
Chart: ConstructConnect
Transportation: In ‘transportation’, there isn’t a major international airport in the country that does not have a multi-billion-dollar expansion plan underway – in such areas as runways, extra passenger gates, de-icing facilities, repair-shop hangars, inter-terminal transit systems and access and egress roadways and expressways.
Also, with a ready supply of bored and looking-for-something-to-do passengers at their command, airports have become almost a last bastion for ‘bricks and mortar’ retail outlets.
(put-in-place investment)
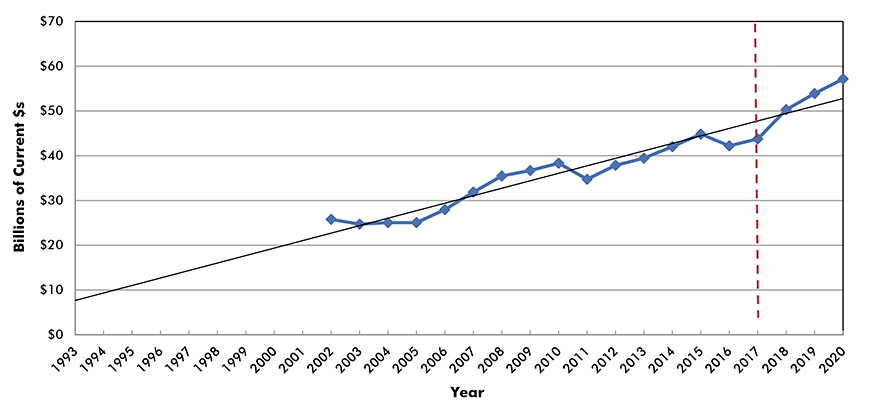
Numbers for this series prior to 2002 are no longer consistent with more current data.
Chart: ConstructConnect
Power: ‘Power’ construction will find support from renewable sources (wind and solar), new transmission lines and conversion of existing generating stations from coal to natural gas. The abundance of natural gas in the U.S., derived from hydraulic fracturing of shale rock, is also bringing forward mega pipeline projects.
(put-in-place investment)
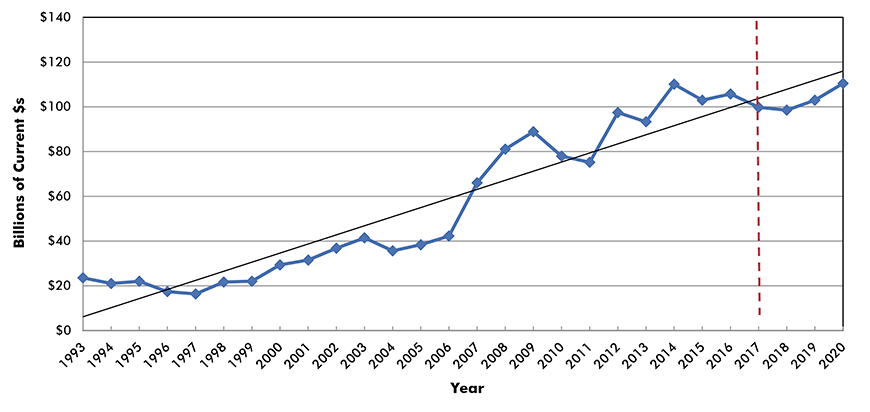
Chart: ConstructConnect
Manufacturing: President Trump has expressed a determination to bring American manufacturing jobs back from a perceived brink, with the help of tariff protection and reduced taxes. As for stimulating the construction of additional square footage, however, there’s a formidable challenge to be overcome.
Capacity utilization rates in most of the manufacturing sector are still stuck below 80.0%. Firms don’t generally consider expanding plants until their usage rates are heading into the upper echelons. At present, corporate money saved on taxes, or repatriated from overseas is going towards dividends, share buy-backs and/or equipment and machinery purchases. The latter are usually geared towards automation and robotics, which save on labor input.
Still, over time, accumulating corporate profits and fuller-shift production lines will nudge manufacturers onto a bigger-footprint growth path.
(put-in-place investment)
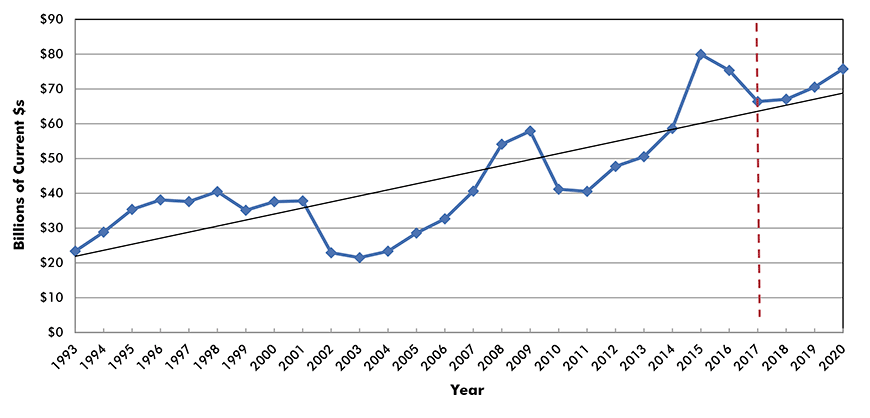
Chart: ConstructConnect







Recent Comments
comments for this post are closed